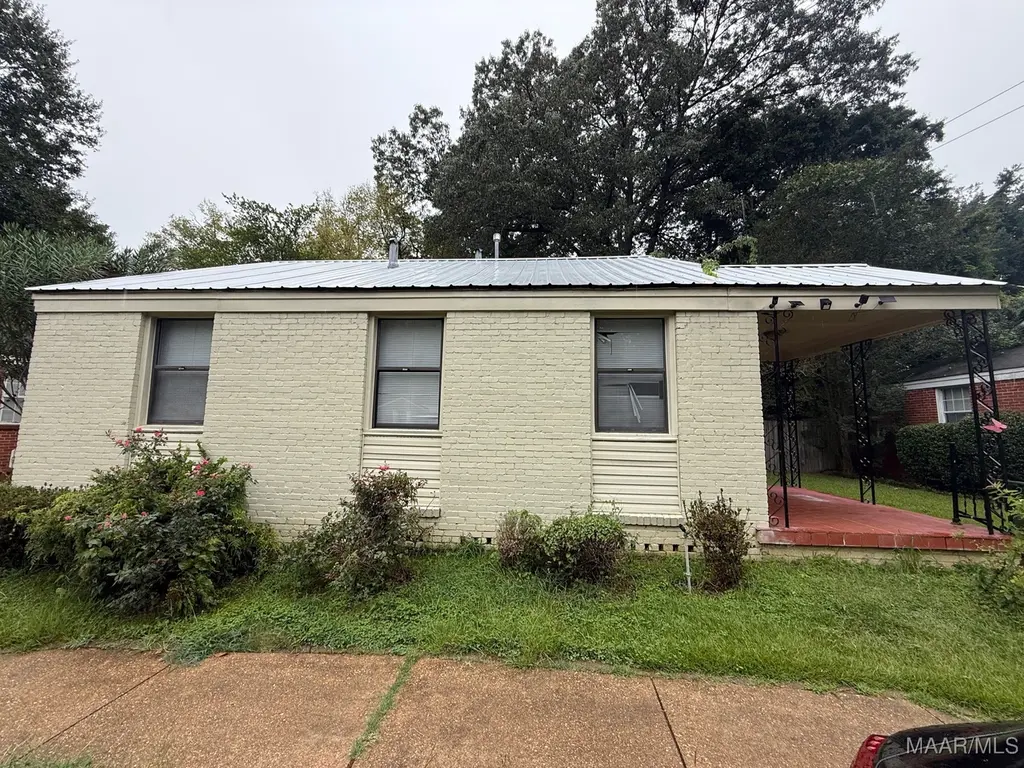
208 Bradley Dr · Montgomery, AL
Flood risk 1/10 · Minimal
- FEMA flood zone
- X (unshaded)
- Chance of flooding over 30 yrs
- 0.0%
- Est. flood insurance / yr
- $507 – $1,088
Fire risk 1/10 · Minimal
- Est. fire insurance / yr
- $916 – $1,700
Heat risk 7/10 · Major
- Hot days now (above 107°F)
- 7 days/yr
- Hot days in 30 yrs
- 18 days/yr
Wind risk 8/10 · Major
- Chance of severe wind over 30 yrs
- 80.0%
Air-quality risk 3/10 · Minor
- Unhealthy air days now
- 4 days/yr
- Unhealthy air days in 30 yrs
- 4 days/yr
Risk factors via First Street. Map © Google.
Why this score? — see what drove the C grade
The composite is a weighted blend of 9 inputs, each scored 0–100. Each bar is that input's sub-score; the figure is the points it added to the 100-point composite (weight × sub-score).
- Cash flow +29.6/30.0
- DSCR +10.0/10.0
- 1% rule +7.5/10.0
- Rent growth +3.2/5.0
- Livability +3.2/5.0
- Condition / age +2.5/5.0
- Schools +1.7/10.0
- ARV discount +0.0/15.0
- Appreciation +0.0/10.0
$92,900
🖨 Deal sheet (PDF) 📄 Offer letter ✓ Due diligence
Listing remarks MLS
Investor Special! Three-bedroom, two-bath home sitting on a spacious lot and full of potential. This property features original hardwood floors throughout and is ready for its new owner’s personal touches. A great opportunity to add value and make this home shine again—perfect for investors or anyone looking for a project!
Key facts
- Spacious lot
- Parking
- Built 1946
Tags
Neighborhood map
What this means for you Summary
Snapshot
- This is a 3-bed/1.0-bath single-family listed at $93k.
Deal economics
- At list price, monthly cash flow is $335 ($4k/yr) — positive.
- The deal already cash-flows at list — no discount required.
- Meets the 1% rule at list price ($1k rent vs $93k).
- Recommended offer: $82k (12.0% below list) — sets the bar for market timing.
- Cap rate 10.6% vs local median 6.0% in Montgomery — top-decile yield for the area; either an underpriced asset or a hidden risk that comps aren't pricing in. Stress-test before assuming the spread holds.
Location & tenants
- Location reads 65/100 on livability (#138 in AL) — a middle-class / working-renter tenant base. Strengths: cost of living A+, housing A+; Watch: schools C-, employment D, crime F.
- Montgomery County (urban): math 9% / reading 31% proficiency, ranked #106 of 129 in AL (top 82%) — low school quality limits family demand, transient renter base, plan for 1-2y turnover; 70% free/reduced lunch — lower-income household profile, screen leases tightly.
- Market conditions: Rents rising (+2.6%/yr); 207 active listings in the ZIP; 40 comparable units currently listed for rent nearby; rentals lingering (median 45d on market — plan ~5-8 weeks vacancy on turnover, expect pricing pressure); 55% of comp listings sitting > 30 days — soft ceiling on asking rent; 460 units permitted in Montgomery County in 2024 (37 in 5+ unit buildings).
Forward outlook
- Local home prices are declining (-3.0%/yr); year-one equity from $642 of loan paydown is wiped out by about $3k of value loss. Plan a longer hold.
- Montgomery County population projected to shrink 8% by 2050 — rents likely to lag national; underwrite the cash flow, not the appreciation.
- At projected returns (-3.0% appreciation + 2.6% rent growth), your $26k cash investment doubles in ~8 years — after that, you're playing with house money.
Negotiation context
- It's been on market 292 days — a 12% lower offer ($82k) is reasonable based on typical stale-listing flexibility.
- 5 sale attempts since 28y ago with the ask held roughly flat each time — persistent listings suggest the price (not the market) is what's stuck; bring a comps-based counter.
- Current owner paid $16k; list at $93k implies a 463% gain — meaningful room to come down on a strong offer.
Risks & watch-outs
- Watch-outs: built in 1946 — expect roof / HVAC / electrical / plumbing capex.
- Climate carrying-cost: severe wind risk, 80% chance of damaging wind over 30y; extreme-heat days projected 7→18/yr by 2055 (HVAC capex compounding) — expect insurance premiums to compound above CPI over the hold.
Questions for the listing agent
- It's been on market 292 days. Have you received any prior offers? Is the seller open to a 12% concession, seller financing, or rate buy-down credit?
- Built in 1946 — when were the roof, HVAC, electrical panel, plumbing, and water heater last replaced?
- Why hasn't it sold? Are there any deal-killer items the seller is aware of (foundation, flood, title, zoning, code violations)?
- Is there a deadline driving the sale (1031 exchange, divorce, estate, relocation)? That informs how much negotiation room exists.
- Crime grade is F in this area — have there been break-ins, vandalism, or insurance claims at this property in the last 3 years? What carrier currently insures it and at what premium?
- What's the average days-on-market for RENTAL listings here right now (not sales)? A rising rental-DOM trend means longer vacancies and softer asking-rent achievability than the comps imply.
- What's the recent tenant-quality profile in this submarket — average credit score on applications, eviction rate, late-payment / NSF rate, and stable-employment percentage? A property-management company in the area should have these aggregated.
- How much new for-sale + rental construction is in the pipeline within 1–3 miles? Heavy new supply typically softens prices + rents 12–24 months out; constrained supply supports both.
Investment metrics
- 1% rule
- 1.25% ✓
- Cap rate
- 10.62%
- Cash-on-cash
- 15.45%
- DSCR
- 1.69
- GRM
- 6.7
CMA / ARV
- ARV (median comp)
- $63,720
- List price
- $92,900
- Delta
- 45.79%
- Verdict
- OVERPRICED
- Comps
- 20 within 1.0 mi
Show comp detail 12 sales within ~0.75 mi
| Address | Dist | Beds/Ba | Sqft | Sold | Price | $/sf | Match |
|---|---|---|---|---|---|---|---|
| 137 Oak Forest Dr | 0.10mi | 2/1.0 (-1) | 1,183 (+6%) | 0mo | $47,000 | $40 | 81 |
| 13 Oak Forest Dr | 0.32mi | 2/1.0 (-1) | 1,110 (-1%) | 2mo | $46,500 | $42 | 77 |
| 3010 Althea St | 0.17mi | 3/1.5 | 1,186 (+6%) | 7mo | $40,000 | $34 | 74 |
| 2318 Winona Ave | 0.51mi | 2/1.0 (-1) | 1,118 (-0%) | 2mo | $89,000 | $80 | 69 |
| 111 Bradley Dr | 0.13mi | 3/2.0 | 1,222 (+9%) | 8mo | $8,000 | $7 | 68 |
| 13 Bradley Dr | 0.29mi | 3/1.0 | 1,264 (+13%) | 6mo | $110,000 | $87 | 60 |
| 3405 Vermont Dr | 0.60mi | 3/1.5 | 1,061 (-5%) | 6mo | $88,000 | $83 | 56 |
| 2933 Willow Lane Dr | 0.39mi | 3/2.0 | 1,234 (+10%) | 6mo | $121,000 | $98 | 55 |
| 302 Whetstone Dr | 0.41mi | 2/1.0 (-1) | 1,025 (-8%) | 8mo | $72,000 | $70 | 55 |
| 508 Forest Hills Dr | 0.40mi | 3/2.0 | 1,267 (+13%) | 1mo | $55,500 | $44 | 55 |
| 2414 Chapman St | 0.55mi | 2/1.0 (-1) | 1,026 (-8%) | 4mo | $39,000 | $38 | 52 |
| 49 Marlborough St | 0.65mi | 3/2.0 | 1,252 (+12%) | 6mo | $115,900 | $93 | 41 |
Match score weights: distance 35% · size 25% · config 20% · recency 20%. Top-matched comps best support the ARV.
Projected returns pro-forma
-3.0% appreciation · 2.65% rent growth · sell at horizon
- IRR
- 5.8%
- Equity multiple
- 1.22×
- Total profit
- $5,847
- Equity at exit
- $13,852
- IRR
- 14.9%
- Equity multiple
- 2.18×
- Total profit
- $30,816
- Equity at exit
- $8,032
Cash invested: $26,012 (down + closing). Projections, not guarantees.
Landlord ↔ Tenant lean methodology
- Overall (STATE)
- 90 Strongly Landlord-Friendly
- State Alabama
- 90 Strongly Landlord-Friendly · R+15
- County
- — inherits STATE
- City
- — inherits STATE
ZIP-level market 36109
- Home prices YoY
- -20.1%
- Rents YoY
- 2.6%
- Active inventory
- 207
- Price-to-rent
- 6.7×
Monthly cashflow live
- Estimated rent
- $1,160 high interval (Pro) →
- Mortgage (P&I)
- −$487
- Tax from tax record
- −$56 /mo · $672/yr
- Insurance
- −$39
- HOA
- −$0
- Vacancy / Maint / Mgmt
- −$244
- Net cashflow
- $335
Break-even live
Sensitivity live
| Price | -10% $387 | -5% $361 | +0% $335 | +5% $309 | +10% $282 |
|---|---|---|---|---|---|
| Rent | -10% $243 | -5% $289 | +0% $335 | +5% $381 | +10% $427 |
| Rate | -1.0pp $382 | -0.5pp $358 | base $335 | +0.5pp $311 | +1.0pp $286 |
UW: 25.0% down · 7.5% · 30yr · 1.5% tax · 5.0% vac · 8.0% maint · 8.0% mgmt
Financing live
Cash to close
- Down payment
- $23,225
- Closing costs
- $2,787
- Reserves months
- —
- Total cash needed
- —
Loan-product check · same deal, 3 products live
Conventional
25% down · 7.5% · 30yr
- Down + closing
- —
- Monthly P&I
- —
- Monthly cashflow
- —
- DSCR
- —
- Eligible?
- —
Personal DTI + credit; lowest rate.
DSCR
20% down · 8.5% · 30yr
- Down + closing
- —
- Monthly P&I
- —
- Monthly cashflow
- —
- DSCR
- —
- Eligible?
- —
No personal income docs; deal must DSCR.
Hard money
10% down · 12.0% · 12mo
- Down + closing
- —
- Monthly P&I
- —
- Monthly cashflow
- —
- DSCR
- —
- Eligible?
- —
Short-term bridge; refi at stabilization.
Rent comps 40 comps
| Address | Beds | Baths | Sqft | Rent | $/sqft | DOM | Units | Dist |
|---|---|---|---|---|---|---|---|---|
| 319 Olivia Ct Montgomery, AL | 2.0 | 1.0 | 850 | $700 | $0.82 | 22d | 1 | 0.03mi |
| 301 Bradley Dr Montgomery, AL | 2.0 | 1.0 | 841 | $935 | $1.11 | 14d | 1 | 0.08mi |
| 122 Oak Forest Dr Montgomery, AL | 3.0 | 1.0 | 1092 | $975 | $0.89 | 22d | 1 | 0.11mi |
| 311 Bradley Dr Montgomery, AL | 3.0 | 1.0 | 1104 | $825 | $0.75 | 44d | 1 | 0.12mi |
| 15 Bradley Dr Montgomery, AL | 3.0 | 2.0 | 1365 | $1,500 | $1.10 | 22d | 1 | 0.29mi |
| 7 Calhoun Rd Unit B Montgomery, AL | 2.0 | 1.0 | 961 | $850 | $0.88 | 44d | 1 | 0.47mi |
| 2229 Madison Ave Montgomery, AL | 2.0 | 1.0 | 1100 | $625 | $0.57 | 44d | 1 | 0.49mi |
| 3233 Hillcrest Ln Montgomery, AL | 3.0 | 2.0 | 1278 | $1,395 | $1.09 | 22d | 1 | 0.50mi |
| 2113 Brewton St Montgomery, AL | 3.0 | 1.0 | 1363 | $1,150 | $0.84 | 44d | 1 | 0.53mi |
| 3319 Willow Lane Dr Montgomery, AL | 3.0 | 2.0 | 1032 | $1,200 | $1.16 | 44d | 1 | 0.55mi |
| 3329 Vermont Dr Montgomery, AL | 3.0 | 1.5 | 1465 | $1,395 | $0.95 | 14d | 1 | 0.56mi |
| 2310 Yancey Ave Montgomery, AL | 3.0 | 1.0 | 1212 | $1,250 | $1.03 | 44d | 1 | 0.58mi |
| 2243 Winona Ave Montgomery, AL | 3.0 | 1.0 | 1492 | $1,225 | $0.82 | 22d | 1 | 0.58mi |
| 3334 Cottonwood Dr Montgomery, AL | 3.0 | 2.0 | 1025 | $1,295 | $1.26 | 14d | 1 | 0.61mi |
| 108 Calhoun Rd Unit 108B Montgomery, AL | 2.0 | 1.0 | 1350 | $750 | $0.56 | 44d | 1 | 0.67mi |
| 239 Forest Hills Dr Montgomery, AL | 4.0 | 1.5 | 1500 | $1,450 | $0.97 | 22d | 1 | 0.67mi |
| 3136 Harrison Rd Montgomery, AL | 3.0 | 1.5 | 1355 | $1,025 | $0.76 | 44d | 1 | 0.74mi |
| 3515 Cottonwood Dr Montgomery, AL | 3.0 | 1.5 | 1246 | $1,350 | $1.08 | 44d | 1 | 0.76mi |
| 2122 Windsor Ave Montgomery, AL | 2.0 | 1.0 | 1052 | $725 | $0.69 | 44d | 1 | 0.80mi |
| 2009 Palmetto St Montgomery, AL | 3.0 | 1.0 | 1487 | $1,050 | $0.71 | 44d | 1 | 0.82mi |
| 2009 Yancey Ave Montgomery, AL | 3.0 | 1.0 | 1140 | $1,080 | $0.95 | 22d | 1 | 0.82mi |
| 1827 Capitol Ave Montgomery, AL | 2.0 | 1.0 | 1068 | $1,600 | $1.50 | 44d | 1 | 0.84mi |
| 1827 Capitol Ave Montgomery, AL | 2.0 | 1.0 | 1068 | $1,600 | $1.50 | 14d | 1 | 0.84mi |
| 67 Holliday Dr Montgomery, AL | 3.0 | 1.0 | 1156 | $1,200 | $1.04 | 44d | 1 | 0.86mi |
| 2023 Windsor Ave Montgomery, AL | 2.0 | 1.0 | 889 | $895 | $1.01 | 44d | 1 | 0.89mi |
| 200 Eton Rd Montgomery, AL | 3.0 | 1.5 | 1500 | $895 | $0.60 | 14d | 1 | 0.89mi |
| 3323 Bedford Ln Montgomery, AL | 3.0 | 2.0 | 1134 | $1,200 | $1.06 | 22d | 1 | 0.90mi |
| 186 E Salem Dr Montgomery, AL | 3.0 | 1.0 | 1040 | $1,195 | $1.15 | 22d | 1 | 0.92mi |
| 3602 Little John Dr Montgomery, AL | 4.0 | 1.0 | 1286 | $1,400 | $1.09 | 22d | 1 | 0.92mi |
| 2000 Cherry St Montgomery, AL | 2.0 | 1.0 | 1106 | $950 | $0.86 | 44d | 1 | 0.93mi |
| 118 Nottingham Ct Montgomery, AL | 3.0 | 2.0 | 1344 | $1,275 | $0.95 | 44d | 1 | 0.95mi |
| 3346 Bedford Ln Montgomery, AL | 3.0 | 1.0 | 1134 | $1,295 | $1.14 | 14d | 1 | 0.96mi |
| 517 N Florida St Unit B Montgomery, AL | 2.0 | 1.0 | 900 | $750 | $0.83 | 44d | 1 | 0.96mi |
| 424 N California St Apt D Montgomery, AL | 2.0 | 1.0 | 850 | $778 | $0.92 | 22d | 1 | 0.98mi |
| 2454 Spruce Curv Montgomery, AL | 3.0 | 1.0 | 988 | $1,100 | $1.11 | 44d | 1 | 1.04mi |
| 3318 Habersham Rd Montgomery, AL | 3.0 | 2.0 | 1134 | $1,250 | $1.10 | 14d | 1 | 1.04mi |
| 39 S Lewis St Montgomery, AL | 2.0 | 1.0 | 1209 | $950 | $0.79 | 44d | 1 | 1.07mi |
| 688 Joryne Dr Montgomery, AL | 3.0 | 2.0 | 1500 | $1,200 | $0.80 | 44d | 1 | 1.07mi |
| 3456 Harrison Rd Montgomery, AL | 3.0 | 1.0 | 1008 | $1,300 | $1.29 | 44d | 1 | 1.09mi |
| 1117 Karen Rd Montgomery, AL | 3.0 | 1.0 | 1308 | $1,195 | $0.91 | 44d | 1 | 1.15mi |
Listing history 27 events
-
2026-06-18days on market $92,900 Active 292 DOM
-
2026-06-17days on market $92,900 Active 291 DOM
-
2026-06-16days on market $92,900 Active 290 DOM
-
2026-06-15days on market $92,900 Active 289 DOM
-
2026-06-14days on market $92,900 Active 287 DOM
-
2026-06-13pricedays on market $92,900 Active 286 DOM
-
2026-06-10days on market $93,900 Active 284 DOM
-
2026-06-09days on market $93,900 Active 283 DOM
-
2026-06-08days on market $93,900 Active 282 DOM
-
2026-06-07days on market $93,900 Active 281 DOM
-
2026-06-03days on market $93,900 Active 277 DOM
-
2026-06-02days on market $93,900 Active 276 DOM
-
2026-06-01days on market $93,900 Active 275 DOM
-
2026-05-31days on market $93,900 Active 274 DOM
-
2026-05-30days on market $93,900 Active 273 DOM
-
2026-05-11price $93,900 336-char remark
Show marketing remark (336 chars)
Investor Special! Three-bedroom, two-bath home sitting on a spacious lot and full of potential. This property features original hardwood floors throughout and is ready for its new owner’s personal touches. A great opportunity to add value and make this home shine again—perfect for investors or anyone looking for a project!
-
2025-10-10price $94,000 336-char remark
Show marketing remark (336 chars)
Investor Special! Three-bedroom, two-bath home sitting on a spacious lot and full of potential. This property features original hardwood floors throughout and is ready for its new owner’s personal touches. A great opportunity to add value and make this home shine again—perfect for investors or anyone looking for a project!
-
2025-08-30$95,000 Active 336-char remark
Show marketing remark (336 chars)
Investor Special! Three-bedroom, two-bath home sitting on a spacious lot and full of potential. This property features original hardwood floors throughout and is ready for its new owner’s personal touches. A great opportunity to add value and make this home shine again—perfect for investors or anyone looking for a project!
-
2021-03-08soldstatus $16,500
-
2019-12-02soldstatus $41,000 370-char remark
Show marketing remark (370 chars)
This is a charming home in a desirable neighborhood! It has 3 bedrooms and 2 full bathrooms! It also has a living room and a den; the windows and the roof are relatively new. The backyard is huge and it also has a deck-perfect for a cookout during football season! This house could be a perfect starter home or an excellent addition to your portfolio. Come see it today!
-
2019-09-09$43,990 370-char remark
Show marketing remark (370 chars)
This is a charming home in a desirable neighborhood! It has 3 bedrooms and 2 full bathrooms! It also has a living room and a den; the windows and the roof are relatively new. The backyard is huge and it also has a deck-perfect for a cookout during football season! This house could be a perfect starter home or an excellent addition to your portfolio. Come see it today!
-
2006-11-22soldstatus $138,644
-
2006-11-13soldstatus $69,862
-
2006-07-31$69,500
-
2004-05-10soldstatus $32,000
-
2003-09-03$41,000
-
1998-07-15$56,900
ⓘ Source: listings_history table (triggers on properties + properties_extension) + one-shot
backfill from property_details.listing_events for pre-trigger history.
Tax reassessment forecast AL · Resets to sale price
- Current annual tax
- $672 · $56/mo
- Projected year-2 tax
- $672 · $56/mo
- Expected delta
- $0/yr ($0/mo · 0.0%)
ⓘ Screening estimate from a state-policy table — verify with the county assessor before closing.
Climate risk First Street
- Flood 1/10 Low FEMA zone X (unshaded) · 0% chance over 30 yrs
- Wildfire 1/10 Low
- Heat 7/10 Severe 7 d/yr ≥107°F today · 18 d/yr by 30 yrs out
- Wind 8/10 Severe 80% chance of damaging wind over 30 yrs
- Air quality 3/10 Moderate 4 unhealthy d/yr today · 4 by 30 yrs out
Nearby sold comps map
Loading sold comps map…
Walkable amenities ~0.75 mi
Loading nearby amenities…
Taxation est. · year 1
- Rental income
- $13,926
- − Mortgage interest
- −$5,204
- − Property taxes
- −$672
- − Insurance
- −$464
- − Repairs & maintenance
- −$1,114
- − Management
- −$1,114
- − Depreciation
- −$2,703
- Taxable income
- $2,654
- Est. tax owed @ 24.0%
- −$637
- After-tax cash flow
- $3,381/yr
For passive investors: Depreciation is non-cash, so a rental often shows a tax loss while cash-flowing — sheltering income. Rental losses are passive: they offset passive income freely, and up to $25,000/yr can offset ordinary (W-2) income if you actively participate and your MAGI is under $100k (phasing out to $0 by $150k); unused losses carry forward. On sale, claimed depreciation is recaptured at up to 25%, and gains may owe capital-gains tax (a 1031 exchange can defer both). Figures are a year-1 estimate at your 24.0% rate — not tax advice; consult a CPA.
Schools (NCES district)
- District
- Montgomery County
- NCES district ID
- 0102430
- Math proficiency
- 9% ▼ -21.00%
- Reading proficiency
- 31% ▼ -1.00%
- Median HH income
- $43,902
- Composite
- 17.24/100
- National rank
- #9093
- State rank
- #106 of 129 in AL
Livability — Montgomery
- Score
- 65/100
- State rank
- #138
- US rank
- #13416
Category grades
Schools grade is shown separately in the Schools card above.
Census & demographics
- Census place
- Montgomery, AL
- County
- Montgomery County · 190,016 people
- City population
- 175,913
- Metro
- Montgomery, AL
- Population (ZIP)
- 23,581
- Household income
- $59,193
- Rent vs Own
- Severe rent burden
- 1039.0
Population outlook (Montgomery County) Hauer SSP2
- Today (2025)
- 224,008 people
- By 2030
- 221,460 · -1.1%
- By 2040
- 214,179 · -4.4%
- By 2050
- 204,912 · -8.5%
- By 2075
- 177,821 · -20.6%
- By 2100
- 145,134 · -35.2%
Race, ethnicity, and origin ACS 2023
- Neighborhood character
- Diverse neighborhood (Simpson 0.60)
- Race & ethnicity
- White 49% Black 39% Hispanic / Latino 8% Two or more races 4%
- Hispanic origin (detail)
- Mexican 4%
- Common ancestry
- Slovak 2% Lithuanian 1% Serbian 1%
- Foreign-born
- 4% · Canada, South Korea
- Languages at home
- 94% English-only · Spanish 5%
Political lean MEDSL · Montgomery
- 2024 margin
- Solid D (+30.7) · D 64.8% · R 34.1% · Other 1.1%
- 2008→2024 swing
- +11.5pp toward D · 2008: 19.2pp · 2024: 30.7pp
- All cycles
- 2024: D+30.7 2020: D+31.5 2016: D+26.2 2012: D+24.3 2008: D+19.2
Not yet ingested
- Civics
- —
Market trends
- HPI YoY
- ▼ -37.64%
- Current HPI
- 149.3867
- Rent YoY
- ▲ 2.65%
- Metro
- Montgomery, AL
- State GDP YoY
- ▲ 2.94%
- F500 in state
- 4
Industry mix (Fortune 500 HQ in AL)
| Industry | F500 HQs | Revenue |
|---|---|---|
| Financial Services | 1 | $8B |
|
||
| Healthcare | 1 | $5B |
|
||
Price history
+65.0% since first listed12 events — show timeline
- 2026-05-11 Price Changed $93,900 MAAR
- 2025-10-10 Price Changed $94,000 MAAR
- 2025-08-30 Listed $95,000 MAAR
- 2021-03-08 Sold (Public Records) $16,500 Public Records
- 2019-12-02 Sold (MLS) $41,000 MAAR
- 2019-09-09 Listed $43,990 MAAR
- 2006-11-22 Sold (Public Records) $138,644 Public Records
- 2006-11-13 Sold (MLS) $69,862 MAAR
- 2006-07-31 Listed $69,500 MAAR
- 2004-05-10 Sold (MLS) $32,000 MAAR
- 2003-09-03 Listed $41,000 MAAR
- 1998-07-15 Listed $56,900 MAAR
Property tax history
+10.2%/yrLatest (2025): $672 · +0.0% YoY. Source: county tax records.
Cash-flow waterfall
monthlySold comps — $/sqft
last 12 mo · ≤1 miLoading sold comps…