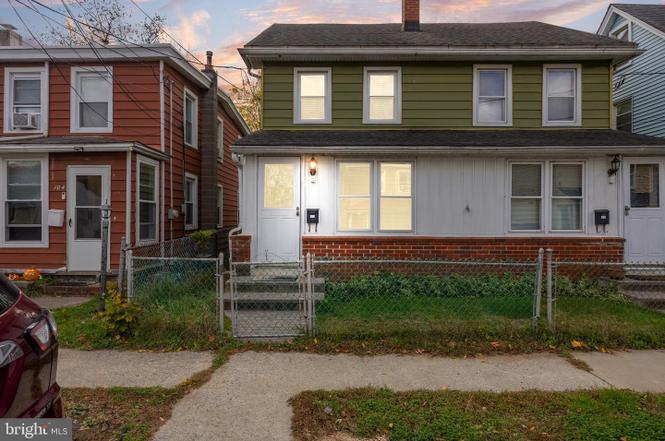
102 Shreve St · Vincentown, NJ
Flood risk 1/10 · Minimal
- FEMA flood zone
- X (unshaded)
- Chance of flooding over 30 yrs
- 0.0%
- Est. flood insurance / yr
- $507 – $1,088
Fire risk 3/10 · Minor
- Est. fire insurance / yr
- $526 – $976
Heat risk 6/10 · Moderate
- Hot days now (above 104°F)
- 7 days/yr
- Hot days in 30 yrs
- 15 days/yr
Wind risk 6/10 · Moderate
- Chance of severe wind over 30 yrs
- 53.0%
Air-quality risk 4/10 · Minor
- Unhealthy air days now
- 5 days/yr
- Unhealthy air days in 30 yrs
- 7 days/yr
Risk factors via First Street. Map © Google.
Why this score? — see what drove the C+ grade
The composite is a weighted blend of 9 inputs, each scored 0–100. Each bar is that input's sub-score; the figure is the points it added to the 100-point composite (weight × sub-score).
- Cash flow +22.2/30.0
- ARV discount +15.0/15.0
- DSCR +7.1/10.0
- 1% rule +5.7/10.0
- Schools +3.4/10.0
- Rent growth +2.9/5.0
- Livability +2.5/5.0
- Condition / age +2.5/5.0
- Appreciation +0.0/10.0
$237,500
🖨 Deal sheet 📄 Offer letter ✓ Due diligence
Listing remarks
UNIQUE OPPORTUNITY: TWO SIDE-BY-SIDE HOMES! Live in one, rent the other. Discover a rare chance to own two neighboring homes, each listed separately, but available for joint purchase---perfect for multi-generational living, rental income, or investment potential. Each home offers its own private entrance, yard, and utilities, allowing for flexible living arrangements. Live comfortably in one property while using the other as a rental unit, a guest home, or a space for extended family. New roof (reshingled) 2013. Expansive 3rd floor bedroom is a true retreat. .. great for a Teen Suite. Whether you're looking to expand your real estate portfolio or find a practical solution for dual living,
Key facts
- Built 1880
- Listed 236 days
Property features AI
Exterior
- Parking: Off-street parking
- Utilities: Public water; Public sewer
- Home design: Semi-detached home; Rural location; Fee simple ownership; Property in very good condition
- Construction: Frame construction with aluminum siding; Stone foundation; Asphalt shingle roof; Replacement vinyl-clad windows; Unfinished basement
- Exterior features: Exterior lighting; Sidewalks; Street lights; Chain link fencing; Front yard; Rear yard; Side yards
Interior
- Kitchen: Gas oven/range; Refrigerator
- Bedrooms: Two bedrooms on the first upper level; One bedroom on the second upper level
- Flooring: Laminate plank; Carpet; Wood
- Bathrooms: One full bathroom
- Heating & cooling: Forced air heating (natural gas); Window air conditioning units (electric); 100 amp electrical service; Natural gas hot water
- Interior features: Jetted bathtub; Tub with shower; Formal separate dining room; Recessed lighting; Wood floors
- Laundry & utility: Washer on the main floor
Neighborhood map
What this means for you Summary
Snapshot
- This is a 3-bed/1.0-bath single-family listed at $238k.
Deal economics
- At list price, monthly cash flow is $389 ($5k/yr) — positive.
- The deal already cash-flows at list — no discount required.
- Meets the 1% rule at list price ($3k rent vs $238k).
- Recommended offer: $209k (12.0% below list) — sets the bar for market timing.
- Cap rate 8.3% vs local median 4.5% in Vincentown — top-decile yield for the area; either an underpriced asset or a hidden risk that comps aren't pricing in. Stress-test before assuming the spread holds.
Location & tenants
- Location reads: area grade C — affects rentability + tenant quality, not the cash-flow math above.
- Rancocas Valley Regional High School District (suburban): math 29% / reading 49% proficiency, ranked #236 of 472 in NJ (top 50%) — families likely to look elsewhere, expect single-tenant / working-renter base with shorter leases.
- Market conditions: Rents rising (+1.4%/yr); 134 active listings in the ZIP; 10 comparable units currently listed for rent nearby; rentals leasing fast (median 2d on market — plan ~1-2 weeks tenant-placement turnaround); solid renter incomes; 2,161 units permitted in Burlington County in 2024 (988 in 5+ unit buildings).
Forward outlook
- Local home prices are declining (-3.0%/yr); year-one equity from $2k of loan paydown is wiped out by about $7k of value loss. Plan a longer hold.
- Burlington County population projected to shrink 5% by 2050 — rents likely to lag national; underwrite the cash flow, not the appreciation.
Negotiation context
- It's been on market 237 days — a 12% lower offer ($209k) is reasonable based on typical stale-listing flexibility.
Risks & watch-outs
- Watch-outs: built in 1880 — expect roof / HVAC / electrical / plumbing capex.
- Climate carrying-cost: major wind risk, 53% chance of damaging wind over 30y; extreme-heat days projected 7→15/yr by 2055 (HVAC capex compounding) — expect insurance premiums to compound above CPI over the hold.
Questions for the listing agent
- It's been on market 237 days. Have you received any prior offers? Is the seller open to a 12% concession, seller financing, or rate buy-down credit?
- Built in 1880 — when were the roof, HVAC, electrical panel, plumbing, and water heater last replaced?
- Why hasn't it sold? Are there any deal-killer items the seller is aware of (foundation, flood, title, zoning, code violations)?
- Is there a deadline driving the sale (1031 exchange, divorce, estate, relocation)? That informs how much negotiation room exists.
- What's the average days-on-market for RENTAL listings here right now (not sales)? A rising rental-DOM trend means longer vacancies and softer asking-rent achievability than the comps imply.
- What's the recent tenant-quality profile in this submarket — average credit score on applications, eviction rate, late-payment / NSF rate, and stable-employment percentage? A property-management company in the area should have these aggregated.
- How much new for-sale + rental construction is in the pipeline within 1–3 miles? Heavy new supply typically softens prices + rents 12–24 months out; constrained supply supports both.
Investment metrics
- 1% rule
- 1.07% ✓
- Cap rate
- 8.26%
- Cash-on-cash
- 7.02%
- DSCR
- 1.31
- GRM
- 7.8
CMA / ARV
- ARV (on-the-fly)
- $319,858
- Comps found
- 3
Show comp detail 3 sales within ~0.75 mi
| Address | Dist | Beds/Ba | Sqft | Sold | Price | $/sf | Match |
|---|---|---|---|---|---|---|---|
| 143 Hulme St | 0.13mi | 2/1.0 (-1) | 836 (-11%) | 6mo | $275,000 | $329 | 65 |
| 245 Spout Spring Ave | 0.64mi | 2/1.0 (-1) | 875 (-7%) | 11mo | $315,000 | $360 | 45 |
| 216 Spout Spring Ave | 0.75mi | 3/1.0 | 1,031 (+10%) | 11mo | $352,000 | $341 | 40 |
Match score weights: distance 35% · size 25% · config 20% · recency 20%. Top-matched comps best support the ARV.
Projected returns pro-forma
-3.0% appreciation · 1.42% rent growth · sell at horizon
- IRR
- -7.3%
- Equity multiple
- 0.73×
- Total profit
- $-17,650
- Equity at exit
- $35,412
- IRR
- 0.2%
- Equity multiple
- 1.01×
- Total profit
- $870
- Equity at exit
- $20,535
Cash invested: $66,500 (down + closing). Projections, not guarantees.
Landlord ↔ Tenant lean methodology
- Overall (STATE)
- 21 Tenant-Leaning
- State New Jersey
- 21 Tenant-Leaning · D+6
- County
- — inherits STATE
- City
- — inherits STATE
ZIP-level market 08060
- Home prices YoY
- -34.5%
- Rents YoY
- 1.4%
- Active inventory
- 134
- Price-to-rent
- 7.8×
Monthly cashflow live
- Estimated rent
- $2,530 high interval (Pro) →
- Mortgage (P&I)
- −$1,245
- Tax from tax record
- −$265 /mo · $3,182/yr
- Insurance
- −$99
- HOA
- −$0
- Vacancy / Maint / Mgmt
- −$531
- Net cashflow
- $389
Break-even live
UW: 25.0% down · 7.5% · 30yr · 1.5% tax · 5.0% vac · 8.0% maint · 8.0% mgmt
Financing live
Cash to close
- Down payment
- $59,375
- Closing costs
- $7,125
- Reserves months
- —
- Total cash needed
- —
Loan-product check · same deal, 3 products live
Conventional
25% down · 7.5% · 30yr
- Down + closing
- —
- Monthly P&I
- —
- Monthly cashflow
- —
- DSCR
- —
- Eligible?
- —
Personal DTI + credit; lowest rate.
DSCR
20% down · 8.5% · 30yr
- Down + closing
- —
- Monthly P&I
- —
- Monthly cashflow
- —
- DSCR
- —
- Eligible?
- —
No personal income docs; deal must DSCR.
Hard money
10% down · 12.0% · 12mo
- Down + closing
- —
- Monthly P&I
- —
- Monthly cashflow
- —
- DSCR
- —
- Eligible?
- —
Short-term bridge; refi at stabilization.
Rent comps 10 comps
| Address | Beds | Baths | Sqft | Rent | $/sqft | DOM | Units | Dist |
|---|---|---|---|---|---|---|---|---|
| 1401 Windmill Way Lumberton, NJ | 1.0–2.0 | 1.0–2.0 | 947 | $2,315 | $2.44 | 1d | 29 | 0.56mi |
| 105 Broad St Unit 1 Mt Holly, NJ | 3.0 | 1.0 | 1100 | $2,200 | $2.00 | 1d | 1 | 0.79mi |
| 102 Ridgway St Unit 1 Mt Holly, NJ | 3.0 | 2.5 | 850 | $2,200 | $2.59 | 1d | 1 | 0.83mi |
| 533 Garden St Mount Holly, NJ | 1.0–2.0 | 1.0 | 750 | $2,185 | $2.91 | 1d | 8 | 0.95mi |
| 100 Dorchester Dr Lumberton, NJ | 1.0–2.0 | 1.0–2.0 | 1057 | $3,195 | $3.02 | 1d | 22 | 1.21mi |
| 302 Barrington Ct Mt Holly, NJ | 1.0–3.0 | 1.0–2.5 | 1226 | $2,959 | $2.41 | 1d | 9 | 1.23mi |
| 64 Regency Dr Mt Holly, NJ | 1.0–3.0 | 1.0–2.0 | 1066 | $2,800 | $2.63 | 1d | 1 | 1.24mi |
| 3a Hunter Cir Eastampton Township, NJ | 1.0–2.0 | 1.0–1.5 | 865 | $2,255 | $2.61 | 1d | 25 | 1.28mi |
| 1 Kirby Ct Mt Holly, NJ | 1.0–3.0 | 1.0–2.5 | 1349 | $3,125 | $2.32 | 1d | 12 | 1.32mi |
| 12000 Hamilton Way Eastampton Township, NJ | 1.0–2.0 | 1.0–2.5 | 1100 | $2,894 | $2.63 | 1d | 10 | 1.49mi |
Listing history 17 events
-
2026-06-18days on market $237,500 Active 237 DOM
-
2026-06-17days on market $237,500 Active 236 DOM
-
2026-06-16days on market $237,500 Active 235 DOM
-
2026-06-15days on market $237,500 Active 234 DOM
-
2026-06-13days on market $237,500 Active 232 DOM
-
2026-06-13days on market $237,500 Active 231 DOM
-
2026-06-09days on market $237,500 Active 228 DOM
-
2026-06-08days on market $237,500 Active 227 DOM
-
2026-06-07days on market $237,500 Active 226 DOM
-
2026-06-04days on market $237,500 Active 223 DOM
-
2026-06-03days on market $237,500 Active 222 DOM
-
2026-06-02days on market $237,500 Active 221 DOM
-
2026-06-01days on market $237,500 Active 220 DOM
-
2026-05-31days on market $237,500 Active 219 DOM
-
2026-03-12price $237,500
-
2025-10-25$250,000 Active
-
2025-10-16historical $250,000
ⓘ Source: listings_history table (triggers on properties + properties_extension) + one-shot
backfill from property_details.listing_events for pre-trigger history.
Tax reassessment forecast NJ · Partial reset (capped growth)
- Current annual tax
- $3,182 · $265/mo
- Projected year-2 tax
- $4,548 · $379/mo
- Expected delta
- +$1,366/yr (+$114/mo · 42.9%)
ⓘ Screening estimate from a state-policy table — verify with the county assessor before closing.
Climate risk First Street
- Flood 1/10 Low FEMA zone X (unshaded) · 0% chance over 30 yrs
- Wildfire 3/10 Moderate
- Heat 6/10 Major 7 d/yr ≥104°F today · 15 d/yr by 30 yrs out
- Wind 6/10 Major 53% chance of damaging wind over 30 yrs
- Air quality 4/10 Moderate 5 unhealthy d/yr today · 7 by 30 yrs out
Nearby sold comps map
Loading sold comps map…
Walkable amenities ~0.75 mi
Loading nearby amenities…
Taxation est. · year 1
- Rental income
- $30,358
- − Mortgage interest
- −$13,304
- − Property taxes
- −$3,182
- − Insurance
- −$1,188
- − Repairs & maintenance
- −$2,429
- − Management
- −$2,429
- − Depreciation
- −$6,909
- Taxable income
- $919
- Est. tax owed @ 24.0%
- −$221
- After-tax cash flow
- $4,448/yr
For passive investors: Depreciation is non-cash, so a rental often shows a tax loss while cash-flowing — sheltering income. Rental losses are passive: they offset passive income freely, and up to $25,000/yr can offset ordinary (W-2) income if you actively participate and your MAGI is under $100k (phasing out to $0 by $150k); unused losses carry forward. On sale, claimed depreciation is recaptured at up to 25%, and gains may owe capital-gains tax (a 1031 exchange can defer both). Figures are a year-1 estimate at your 24.0% rate — not tax advice; consult a CPA.
Schools (NCES district)
- District
- Rancocas Valley Regional High School District
- NCES district ID
- 3413620
- Math proficiency
- 29% ▼ -18.00%
- Reading proficiency
- 49% ▼ -4.00%
- Median HH income
- $58,992
- Composite
- 34.45/100
- National rank
- #5195
- State rank
- #236 of 472 in NJ
Livability — Vincentown
No livability data for this city. (Only ~50 U.S. cities are tracked.)
Census & demographics
- County
- Burlington County · 323,710 people
- Metro
- Philadelphia-Camden-Wilmington, PA-NJ-DE-MD
- Population (ZIP)
- 25,835
- Household income
- $109,292
- Rent vs Own
- Severe rent burden
- 562.0
Population outlook (Burlington County) Hauer SSP2
- Today (2025)
- 453,425 people
- By 2030
- 452,359 · -0.2%
- By 2040
- 445,033 · -1.9%
- By 2050
- 431,760 · -4.8%
- By 2075
- 406,277 · -10.4%
- By 2100
- 364,732 · -19.6%
Race, ethnicity, and origin ACS 2023
- Neighborhood character
- Diverse neighborhood (Simpson 0.68)
- Race & ethnicity
- White 49% Black 25% Two or more races 15% Hispanic / Latino 13% Asian 4%
- Hispanic origin (detail)
- Mexican 2% Puerto Rican 7%
- Common ancestry
- Romanian 4% Lithuanian 2% Italian 1%
- Foreign-born
- 11% · Canada, Dominican Republic, China
- Languages at home
- 87% English-only · Spanish 7% Other Indo-European 2% French/Haitian/Cajun 1%
Political lean MEDSL · Burlington
- 2024 margin
- D (+16.6) · D 57.6% · R 41.0% · Other 1.3%
- 2008→2024 swing
- -2.0pp toward R · 2008: 18.6pp · 2024: 16.6pp
- All cycles
- 2024: D+16.6 2020: D+19.5 2016: D+14.8 2012: D+18.7 2008: D+18.6
Not yet ingested
- Civics
- —
Market trends
- HPI YoY
- ▼ -156.50%
- Current HPI
- 296.564
- Rent YoY
- ▲ 1.42%
- Metro
- Philadelphia-Camden-Wilmington, PA-NJ-DE-MD
- State GDP YoY
- ▲ 2.05%
- F500 in state
- 34
Industry mix (Fortune 500 HQ in NJ)
| Industry | F500 HQs | Revenue |
|---|---|---|
| Consumer Goods | 3 | $31B |
|
||
| Pharmaceuticals | 2 | $153B |
|
||
| Technology | 2 | $21B |
|
||
| Insurance | 2 | $20B |
|
||
| Healthcare | 2 | $19B |
|
||
| Financial Services | 1 | $70B |
|
||
Price history
-5.0% since first listed3 events — show timeline
- 2026-03-12 Price Changed $237,500 BRIGHT MLS
- 2025-10-25 Listed $250,000 BRIGHT MLS
- 2025-10-16 Coming Soon $250,000 BRIGHT MLS
Property tax history
+4.0%/yrLatest (2025): $3,182 · +6.6% YoY. Source: county tax records.
Cash-flow waterfall
monthlySold comps — $/sqft
last 12 mo · ≤1 miLoading sold comps…