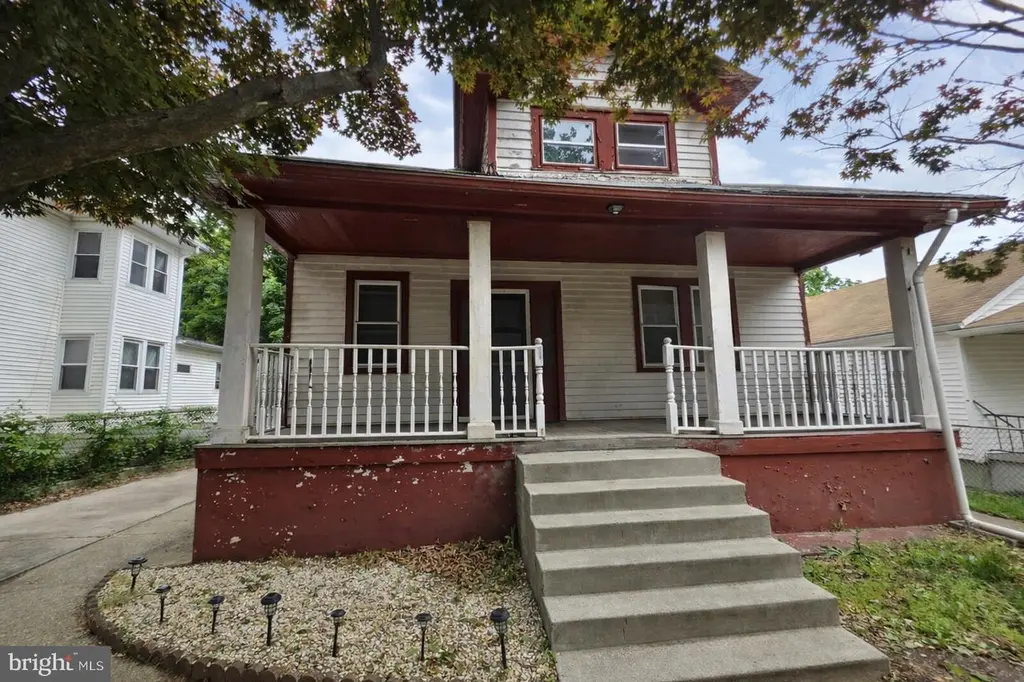
414 W Cherry St · Vineland, NJ
Flood risk 1/10 · Minimal
- FEMA flood zone
- X (unshaded)
- Chance of flooding over 30 yrs
- 0.0%
- Est. flood insurance / yr
- $507 – $1,088
Fire risk 1/10 · Minimal
- Est. fire insurance / yr
- $526 – $976
Heat risk 7/10 · Major
- Hot days now (above 103°F)
- 7 days/yr
- Hot days in 30 yrs
- 15 days/yr
Wind risk 6/10 · Moderate
- Chance of severe wind over 30 yrs
- 65.0%
Air-quality risk 3/10 · Minor
- Unhealthy air days now
- 3 days/yr
- Unhealthy air days in 30 yrs
- 5 days/yr
Risk factors via First Street. Map © Google.
Why this score? — see what drove the C+ grade
The composite is a weighted blend of 9 inputs, each scored 0–100. Each bar is that input's sub-score; the figure is the points it added to the 100-point composite (weight × sub-score).
- Cash flow +23.1/30.0
- ARV discount +15.0/15.0
- DSCR +7.4/10.0
- 1% rule +6.8/10.0
- Livability +3.3/5.0
- Rent growth +2.5/5.0
- Condition / age +2.5/5.0
- Schools +1.9/10.0
- Appreciation +0.0/10.0
$184,950
🖨 Deal sheet 📄 Offer letter ✓ Due diligence
Listing remarks MLS
Nicely Kept 3 Bdrm. Home w/ LR, DR, Kitchen, Bath and Full Finished Basement. Fenced in Rear Yard.
Key facts
- 7,501 sq ft lot
- Built 1932
- Listed 23 days
Property features AI
Finance
- Other: Ownership: Fee simple
Exterior
- Parking: Driveway; Off-street parking; On-street parking
- Utilities: Public water; Public sewer; Natural gas for heat and hot water
- Home design: Detached structure; Pitched shingle roof; Frame construction; Block foundation; Lot dimensions approximately 50 x 150
- Construction: Frame construction; Block foundation; Pitched shingle roof
- Exterior features: Exterior lighting; Sidewalks; Street lights; Chain link fencing (fully fenced)
Interior
- Bedrooms: Two bedrooms on the upper level; One bedroom on the main level
- Bathrooms: Two full bathrooms total; One full bath on the main level; One full bath on the lower level
- Heating & cooling: Radiator heat; Natural gas heating and hot water
- Interior features: Full basement
Neighborhood map
What this means for you Summary
Snapshot
- This is a 3-bed/2.0-bath single-family listed at $185k.
Deal economics
- At list price, monthly cash flow is $331 ($4k/yr) — positive.
- The deal already cash-flows at list — no discount required.
- Meets the 1% rule at list price ($2k rent vs $185k).
- Recommended offer: $182k (1.5% below list) — sets the bar for market timing.
- Cap rate 8.4% vs local median 4.5% in Vineland — top-decile yield for the area; either an underpriced asset or a hidden risk that comps aren't pricing in. Stress-test before assuming the spread holds.
Location & tenants
- Location reads 66/100 on livability (#363 in NJ) — a middle-class / working-renter tenant base. Strengths: housing A+, health & safety A+; Watch: employment D+, schools D, crime F.
- Vineland Public School District (urban): math 9% / reading 34% proficiency, ranked #418 of 472 in NJ (top 89%) — low school quality limits family demand, transient renter base, plan for 1-2y turnover.
- Market conditions: 173 active listings in the ZIP; 1 comparable units currently listed for rent nearby; 216 units permitted in Cumberland County in 2024 (73 in 5+ unit buildings).
- This rent runs 40% of the median local income ($65k/yr) — at the standard rent-burdened threshold; future hikes will face affordability resistance.
Forward outlook
- Local home prices are declining (-3.0%/yr); year-one equity from $1k of loan paydown is wiped out by about $6k of value loss. Plan a longer hold.
- Cumberland County population projected to shrink 7% by 2050 — rents likely to lag national; underwrite the cash flow, not the appreciation.
Negotiation context
- It's been on market 24 days — a 2% lower offer ($182k) is reasonable based on typical stale-listing flexibility.
- 3 sale attempts since 20y ago with the ask held roughly flat each time — persistent listings suggest the price (not the market) is what's stuck; bring a comps-based counter.
- Current owner paid $133k; 39% above their basis — modest negotiation headroom, anchor on the comps not their cost.
Risks & watch-outs
- Watch-outs: built in 1932 — expect roof / HVAC / electrical / plumbing capex.
- Climate carrying-cost: major wind risk, 65% chance of damaging wind over 30y; extreme-heat days projected 7→15/yr by 2055 (HVAC capex compounding) — expect insurance premiums to compound above CPI over the hold.
Questions for the listing agent
- Built in 1932 — when were the roof, HVAC, electrical panel, plumbing, and water heater last replaced?
- Is there a deadline driving the sale (1031 exchange, divorce, estate, relocation)? That informs how much negotiation room exists.
- Schools are D-rated, which usually means shorter tenancies and higher turnover. Who's the typical renter profile here, and what's been the actual vacancy rate?
- Crime grade is F in this area — have there been break-ins, vandalism, or insurance claims at this property in the last 3 years? What carrier currently insures it and at what premium?
- What's the average days-on-market for RENTAL listings here right now (not sales)? A rising rental-DOM trend means longer vacancies and softer asking-rent achievability than the comps imply.
- What's the recent tenant-quality profile in this submarket — average credit score on applications, eviction rate, late-payment / NSF rate, and stable-employment percentage? A property-management company in the area should have these aggregated.
- How much new for-sale + rental construction is in the pipeline within 1–3 miles? Heavy new supply typically softens prices + rents 12–24 months out; constrained supply supports both.
Investment metrics
- 1% rule
- 1.18% ✓
- Cap rate
- 8.44%
- Cash-on-cash
- 7.66%
- DSCR
- 1.34
- GRM
- 7.1
CMA / ARV
- ARV (on-the-fly)
- $288,576
- Comps found
- 5
Show comp detail 5 sales within ~0.75 mi
| Address | Dist | Beds/Ba | Sqft | Sold | Price | $/sf | Match |
|---|---|---|---|---|---|---|---|
| 739 E Montrose St | 0.49mi | 4/2.0 (+1) | 1,679 (-3%) | 4mo | $320,000 | $191 | 64 |
| 78 W Montrose St | 0.53mi | 3/2.0 | 1,740 (+1%) | 14mo | $290,500 | $167 | 62 |
| 426 W Chestnut Ave | 0.07mi | 3/1.0 | 1,532 (-11%) | 20mo | $210,000 | $137 | 57 |
| 66 W Walnut Rd | 0.58mi | 3/2.0 | 1,533 (-11%) | 6mo | $355,000 | $232 | 49 |
| 415 S East Ave | 0.61mi | 4/2.0 (+1) | 1,860 (+8%) | 14mo | $295,000 | $159 | 42 |
Match score weights: distance 35% · size 25% · config 20% · recency 20%. Top-matched comps best support the ARV.
Projected returns pro-forma
-3.0% appreciation · 3.0% rent growth · sell at horizon
- IRR
- -4.6%
- Equity multiple
- 0.83×
- Total profit
- $-8,813
- Equity at exit
- $27,577
- IRR
- 5.2%
- Equity multiple
- 1.38×
- Total profit
- $19,857
- Equity at exit
- $15,991
Cash invested: $51,786 (down + closing). Projections, not guarantees.
Landlord ↔ Tenant lean methodology
- Overall (STATE)
- 21 Tenant-Leaning
- State New Jersey
- 21 Tenant-Leaning · D+6
- County
- — inherits STATE
- City
- — inherits STATE
ZIP-level market 08360
- Active inventory
- 173
- Price-to-rent
- 7.1×
Monthly cashflow live
- Estimated rent
- $2,182 medium interval (Pro) →
- Mortgage (P&I)
- −$970
- Tax from tax record
- −$346 /mo · $4,156/yr
- Insurance
- −$77
- HOA
- −$0
- Vacancy / Maint / Mgmt
- −$458
- Net cashflow
- $331
Break-even live
UW: 25.0% down · 7.5% · 30yr · 1.5% tax · 5.0% vac · 8.0% maint · 8.0% mgmt
Financing live
Cash to close
- Down payment
- $46,238
- Closing costs
- $5,548
- Reserves months
- —
- Total cash needed
- —
Loan-product check · same deal, 3 products live
Conventional
25% down · 7.5% · 30yr
- Down + closing
- —
- Monthly P&I
- —
- Monthly cashflow
- —
- DSCR
- —
- Eligible?
- —
Personal DTI + credit; lowest rate.
DSCR
20% down · 8.5% · 30yr
- Down + closing
- —
- Monthly P&I
- —
- Monthly cashflow
- —
- DSCR
- —
- Eligible?
- —
No personal income docs; deal must DSCR.
Hard money
10% down · 12.0% · 12mo
- Down + closing
- —
- Monthly P&I
- —
- Monthly cashflow
- —
- DSCR
- —
- Eligible?
- —
Short-term bridge; refi at stabilization.
Rent comps 1 comps
| Address | Beds | Baths | Sqft | Rent | $/sqft | DOM | Units | Dist |
|---|---|---|---|---|---|---|---|---|
| 890 E Walnut Rd Vineland, NJ | 1.0–2.0 | 1.0–1.5 | 937 | $2,100 | $2.24 | 1d | 8 | 1.07mi |
Listing history 25 events
-
2026-06-19days on market $184,950 Active 24 DOM
-
2026-06-18days on market $184,950 Active 23 DOM
-
2026-06-17days on market $184,950 Active 22 DOM
-
2026-06-16days on market $184,950 Active 21 DOM
-
2026-06-15days on market $184,950 Active 20 DOM
-
2026-06-14days on market $184,950 Active 18 DOM
-
2026-06-13days on market $184,950 Active 17 DOM
-
2026-06-10days on market $184,950 Active 15 DOM
-
2026-06-09days on market $184,950 Active 14 DOM
-
2026-06-08days on market $184,950 Active 13 DOM
-
2026-06-07days on market $184,950 Active 12 DOM
-
2026-06-03days on market $184,950 Active 8 DOM
-
2026-06-02days on market $184,950 Active 7 DOM
-
2026-06-01days on market $184,950 Active 6 DOM
-
2026-05-31days on market $184,950 Active 5 DOM
-
2026-05-30days on market $184,950 Active 4 DOM
-
2026-05-26$184,950 Active
-
2006-09-21soldstatus $133,400
-
2006-09-19soldstatus $133,400 98-char remark
Show marketing remark (111 chars)
Nicely Kept 3 Bedroom Home w/ LR, DR, Kitchen, Bath and Full Finished Basement. Fenced in Yard. Priced to Sell!
-
2006-09-19soldstatus $133,400 111-char remark
Show marketing remark (111 chars)
Nicely Kept 3 Bedroom Home w/ LR, DR, Kitchen, Bath and Full Finished Basement. Fenced in Yard. Priced to Sell!
-
2006-07-19historical 98-char remark
Show marketing remark (98 chars)
Nicely Kept 3 Bdrm. Home w/ LR, DR, Kitchen, Bath and Full Finished Basement. Fenced in Rear Yard.
-
2006-07-13historical 111-char remark
Show marketing remark (111 chars)
Nicely Kept 3 Bedroom Home w/ LR, DR, Kitchen, Bath and Full Finished Basement. Fenced in Yard. Priced to Sell!
-
2006-06-13$133,400 98-char remark
Show marketing remark (98 chars)
Nicely Kept 3 Bdrm. Home w/ LR, DR, Kitchen, Bath and Full Finished Basement. Fenced in Rear Yard.
-
2006-06-12$129,900 111-char remark
Show marketing remark (111 chars)
Nicely Kept 3 Bedroom Home w/ LR, DR, Kitchen, Bath and Full Finished Basement. Fenced in Yard. Priced to Sell!
-
1995-11-06soldstatus $79,000
ⓘ Source: listings_history table (triggers on properties + properties_extension) + one-shot
backfill from property_details.listing_events for pre-trigger history.
Tax reassessment forecast NJ · Partial reset (capped growth)
- Current annual tax
- $4,156 · $346/mo
- Projected year-2 tax
- $4,381 · $365/mo
- Expected delta
- +$225/yr (+$19/mo · 5.4%)
ⓘ Screening estimate from a state-policy table — verify with the county assessor before closing.
Climate risk First Street
- Flood 1/10 Low FEMA zone X (unshaded) · 0% chance over 30 yrs
- Wildfire 1/10 Low
- Heat 7/10 Severe 7 d/yr ≥103°F today · 15 d/yr by 30 yrs out
- Wind 6/10 Major 65% chance of damaging wind over 30 yrs
- Air quality 3/10 Moderate 3 unhealthy d/yr today · 5 by 30 yrs out
Nearby sold comps map
Loading sold comps map…
Walkable amenities ~0.75 mi
Loading nearby amenities…
Taxation est. · year 1
- Rental income
- $26,185
- − Mortgage interest
- −$10,360
- − Property taxes
- −$4,156
- − Insurance
- −$925
- − Repairs & maintenance
- −$2,095
- − Management
- −$2,095
- − Depreciation
- −$5,380
- Taxable income
- $1,174
- Est. tax owed @ 24.0%
- −$282
- After-tax cash flow
- $3,685/yr
For passive investors: Depreciation is non-cash, so a rental often shows a tax loss while cash-flowing — sheltering income. Rental losses are passive: they offset passive income freely, and up to $25,000/yr can offset ordinary (W-2) income if you actively participate and your MAGI is under $100k (phasing out to $0 by $150k); unused losses carry forward. On sale, claimed depreciation is recaptured at up to 25%, and gains may owe capital-gains tax (a 1031 exchange can defer both). Figures are a year-1 estimate at your 24.0% rate — not tax advice; consult a CPA.
Schools (NCES district)
- District
- Vineland Public School District
- NCES district ID
- 3416800
- Math proficiency
- 9% ▼ -17.00%
- Reading proficiency
- 34% ▬ 0.00%
- Median HH income
- $51,168
- Composite
- 19.17/100
- National rank
- #8819
- State rank
- #418 of 472 in NJ
Livability — Vineland
- Score
- 66/100
- State rank
- #363
- US rank
- #12180
Category grades
Schools grade is shown separately in the Schools card above.
Census & demographics
- Census place
- Vineland, NJ
- County
- Cumberland County · 80,266 people
- City population
- 45,038
- Metro
- Vineland-Bridgeton, NJ
- Population (ZIP)
- 45,038
- Household income
- $65,359
- Rent vs Own
- Severe rent burden
- 1328.0
Population outlook (Cumberland County) Hauer SSP2
- Today (2025)
- 152,743 people
- By 2030
- 150,373 · -1.6%
- By 2040
- 146,881 · -3.8%
- By 2050
- 142,653 · -6.6%
- By 2075
- 129,468 · -15.2%
- By 2100
- 107,456 · -29.6%
Race, ethnicity, and origin ACS 2023
- Neighborhood character
- Diverse neighborhood (Simpson 0.62)
- Race & ethnicity
- Hispanic / Latino 51% White 32% Two or more races 17% Black 11% Asian 1%
- Hispanic origin (detail)
- Mexican 11% Puerto Rican 33% Dominican 2%
- Common ancestry
- Romanian 2% Subsaharan African 1% Scotch-Irish 1%
- Foreign-born
- 14% · Canada, Jamaica
- Languages at home
- 59% English-only · Spanish 37% Russian/Polish/Slavic 2% Other Indo-European 1%
Political lean MEDSL · Cumberland
- 2024 margin
- Toss-up / Even · D 47.6% · R 51.3% · Other 1.1%
- 2008→2024 swing
- -25.4pp toward R · 2008: 21.6pp · 2024: -3.8pp
- All cycles
- 2024: R+3.8 2020: D+6.0 2016: D+5.3 2012: D+23.1 2008: D+21.6
Not yet ingested
- Civics
- —
Market trends
- HPI YoY
- ▼ -320.06%
- Current HPI
- 278.786
- Rent YoY
- —
- Metro
- Vineland-Bridgeton, NJ
- State GDP YoY
- ▲ 2.05%
- F500 in state
- 34
Industry mix (Fortune 500 HQ in NJ)
| Industry | F500 HQs | Revenue |
|---|---|---|
| Consumer Goods | 3 | $31B |
|
||
| Pharmaceuticals | 2 | $153B |
|
||
| Technology | 2 | $21B |
|
||
| Insurance | 2 | $20B |
|
||
| Healthcare | 2 | $19B |
|
||
| Financial Services | 1 | $70B |
|
||
Price history
+134.1% since first listed9 events — show timeline
- 2026-05-26 Listed $184,950 BRIGHT MLS
- 2006-09-21 Sold (Public Records) $133,400 Public Records
- 2006-09-19 Sold (MLS) $133,400 SJSRMLS
- 2006-09-19 Sold (MLS) $133,400 BRIGHT MLS
- 2006-07-19 Listing Removed — BRIGHT MLS
- 2006-07-13 Listing Removed — SJSRMLS
- 2006-06-13 Listed $133,400 BRIGHT MLS
- 2006-06-12 Listed $129,900 SJSRMLS
- 1995-11-06 Sold (Public Records) $79,000 Public Records
Property tax history
+3.2%/yrLatest (2025): $4,156 · +3.9% YoY. Source: county tax records.
Cash-flow waterfall
monthlySold comps — $/sqft
last 12 mo · ≤1 miLoading sold comps…