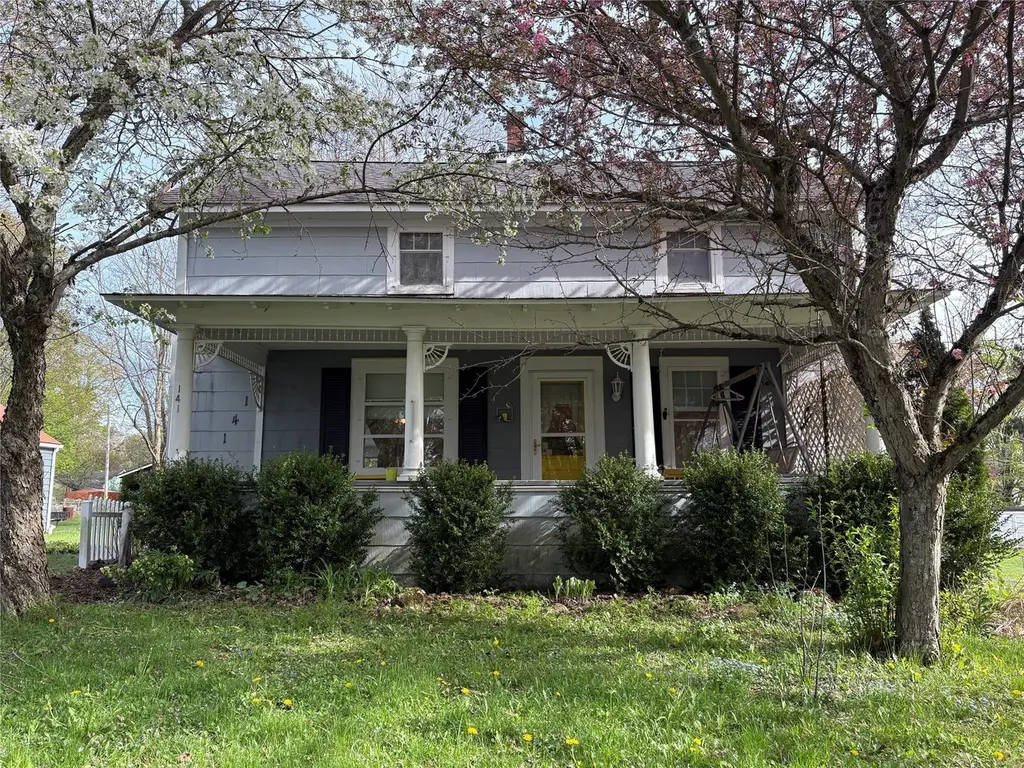
141 W 3rd St · Waterford, PA
Flood risk 1/10 · Minimal
- FEMA flood zone
- X (unshaded)
- Chance of flooding over 30 yrs
- 0.0%
- Est. flood insurance / yr
- $473 – $860
Fire risk 1/10 · Minimal
- Est. fire insurance / yr
- $511 – $949
Heat risk 2/10 · Minimal
- Hot days now (above 91°F)
- 7 days/yr
- Hot days in 30 yrs
- 18 days/yr
Wind risk 1/10 · Minimal
- Chance of severe wind over 30 yrs
- —
Air-quality risk 2/10 · Minimal
- Unhealthy air days now
- 1 days/yr
- Unhealthy air days in 30 yrs
- 2 days/yr
Risk factors via First Street. Map © Google.
Why this score? — see what drove the D grade
The composite is a weighted blend of 9 inputs, each scored 0–100. Each bar is that input's sub-score; the figure is the points it added to the 100-point composite (weight × sub-score).
- ARV discount +12.0/15.0
- Cash flow +10.5/30.0
- Schools +5.1/10.0
- Livability +4.2/5.0
- DSCR +3.0/10.0
- 1% rule +2.5/10.0
- Rent growth +2.5/5.0
- Condition / age +2.5/5.0
- Appreciation +0.0/10.0
$175,000
🖨 Deal sheet 📄 Offer letter ✓ Due diligence
Listing remarks
Fall in love with this charming two-story gem nestled in the heart of Waterford! This 3-bedroom, 1.5-bath home offers the perfect blend of character and convenience. Need more space? The dedicated office provides an easy transition into a 4th bedroom. Enjoy total peace of mind with extensive recent updates, including central air, a new furnace, updated flooring, and upgraded electrical. Outside, you’ll find convenient off-street parking and spacious storage sheds—perfect for your tools, toys, and yard items. Move in and start making memories!
Key facts
- New furnace
- Upgraded electrical
- Updated flooring
Tags
Property features AI
Exterior
- Utilities: Public water; Public sewer
- Home design: Single-family residence; Two levels / 2 stories; Residential property in R-1 zoning
- Construction: Asbestos construction material
- Exterior features: Level lot; Paved road access; Asphalt roof
Interior
- Flooring: Hardwood; Laminate
- Bathrooms: 1 full bathroom; 1 half bathroom
- Heating & cooling: Central air conditioning; Forced-air heating
- Interior features: Hardwood and laminate flooring; Unfinished basement
Neighborhood map
What this means for you Summary
Snapshot
- This is a 3-bed/1.0-bath single-family listed at $175k.
Deal economics
- At list price, monthly cash flow is $-91 ($-1k/yr) — negative.
- To cash-flow at today's rent, offer at most $159k (9.2% below list).
- To meet the 1% rule (rent ≥ 1% of price), the offer needs to be $132k (24.5% below list).
- Recommended offer: $132k (24.5% below list) — sets the bar for 1% rule.
Location & tenants
- Location reads 85/100 on livability (#79 in PA, #576 nationally) — a professional / high-income tenant draw. Strengths: crime A+, cost of living A+, housing A+; Watch: amenities F, commute D-.
- Fort Leboeuf SD (rural): math 52% / reading 68% proficiency, ranked #77 of 539 in PA (top 14%) — acceptable for families but not a draw, mixed tenant base, ~2y average lease.
- Market conditions: 40 active listings in the ZIP; 2 comparable units currently listed for rent nearby; 364 units permitted in Erie County in 2024 (188 in 5+ unit buildings).
Forward outlook
- Local home prices are declining (-3.0%/yr); year-one equity from $1k of loan paydown is wiped out by about $5k of value loss. Plan a longer hold.
- Erie County population projected at -14% by 2050 — secular population decline; favor cash flow + early exit over multi-decade hold.
Negotiation context
- It's been on market 38 days — a 3% lower offer ($170k) is reasonable based on typical stale-listing flexibility.
- Current owner paid $31k; list at $175k implies a 465% gain — meaningful room to come down on a strong offer.
Risks & watch-outs
- Watch-outs: built in 1860 — expect roof / HVAC / electrical / plumbing capex.
Questions for the listing agent
- What do current leases actually rent for vs. the listed asking? Can we see a recent rent roll and the last 12 months of T-12 income?
- It's been on market 38 days. Have you received any prior offers? Is the seller open to a 25% concession, seller financing, or rate buy-down credit?
- Built in 1860 — when were the roof, HVAC, electrical panel, plumbing, and water heater last replaced?
- Is there a deadline driving the sale (1031 exchange, divorce, estate, relocation)? That informs how much negotiation room exists.
- Schools are A-rated — typically a magnet for longer-tenancy family renters. What's the average tenant stay here, and is there a school-zone premium baked into asking?
- The area grade is low — what's the realistic commute time and amenity access for the typical tenant pool here? Any planned neighborhood developments (good or bad) we should know about?
- What's the average days-on-market for RENTAL listings here right now (not sales)? A rising rental-DOM trend means longer vacancies and softer asking-rent achievability than the comps imply.
- What's the recent tenant-quality profile in this submarket — average credit score on applications, eviction rate, late-payment / NSF rate, and stable-employment percentage? A property-management company in the area should have these aggregated.
- How much new for-sale + rental construction is in the pipeline within 1–3 miles? Heavy new supply typically softens prices + rents 12–24 months out; constrained supply supports both.
Investment metrics
- 1% rule
- 0.75% ✗
- Cap rate
- 5.67%
- Cash-on-cash
- -2.23%
- DSCR
- 0.90
- GRM
- 11.0
CMA / ARV
- ARV (median comp)
- $194,379
- List price
- $175,000
- Delta
- -9.97%
- Verdict
- FAIR
- Comps
- 17 within 1.0 mi
Show comp detail 5 sales within ~0.75 mi
| Address | Dist | Beds/Ba | Sqft | Sold | Price | $/sf | Match |
|---|---|---|---|---|---|---|---|
| 265 W 2nd St | 0.15mi | 2/1.0 (-1) | 1,130 (-8%) | 4mo | $120,000 | $106 | 71 |
| 319 Chestnut St | 0.41mi | 3/1.0 | 1,227 (-0%) | 20mo | $185,000 | $151 | 63 |
| 248 E 4th St | 0.48mi | 3/2.5 | 1,285 (+4%) | 3mo | $260,000 | $202 | 62 |
| 754 Cherry St | 0.53mi | 3/1.0 | 1,232 (0%) | 19mo | $182,000 | $148 | 59 |
| 860 Cherry St | 0.65mi | 3/2.0 | 1,066 (-14%) | 12mo | $260,000 | $244 | 34 |
Match score weights: distance 35% · size 25% · config 20% · recency 20%. Top-matched comps best support the ARV.
Projected returns pro-forma
-3.0% appreciation · 3.0% rent growth · sell at horizon
- IRR
- -20.0%
- Equity multiple
- 0.30×
- Total profit
- $-34,180
- Equity at exit
- $26,093
- IRR
- -13.0%
- Equity multiple
- 0.24×
- Total profit
- $-37,333
- Equity at exit
- $15,131
Cash invested: $49,000 (down + closing). Projections, not guarantees.
Landlord ↔ Tenant lean methodology
- Overall (STATE)
- 62 Landlord-Friendly
- State Pennsylvania
- 62 Landlord-Friendly · EVEN
- County
- — inherits STATE
- City
- — inherits STATE
ZIP-level market 16441
- Home prices YoY
- -33.2%
- Active inventory
- 40
- Price-to-rent
- 11.0×
Monthly cashflow live
- Estimated rent
- $1,320 medium interval (Pro) →
- Mortgage (P&I)
- −$918
- Tax from tax record
- −$144 /mo · $1,723/yr
- Insurance
- −$73
- HOA
- −$0
- Vacancy / Maint / Mgmt
- −$277
- Net cashflow
- $-91
Break-even live
UW: 25.0% down · 7.5% · 30yr · 1.5% tax · 5.0% vac · 8.0% maint · 8.0% mgmt
Financing live
Cash to close
- Down payment
- $43,750
- Closing costs
- $5,250
- Reserves months
- —
- Total cash needed
- —
Loan-product check · same deal, 3 products live
Conventional
25% down · 7.5% · 30yr
- Down + closing
- —
- Monthly P&I
- —
- Monthly cashflow
- —
- DSCR
- —
- Eligible?
- —
Personal DTI + credit; lowest rate.
DSCR
20% down · 8.5% · 30yr
- Down + closing
- —
- Monthly P&I
- —
- Monthly cashflow
- —
- DSCR
- —
- Eligible?
- —
No personal income docs; deal must DSCR.
Hard money
10% down · 12.0% · 12mo
- Down + closing
- —
- Monthly P&I
- —
- Monthly cashflow
- —
- DSCR
- —
- Eligible?
- —
Short-term bridge; refi at stabilization.
Rent comps 2 comps
| Address | Beds | Baths | Sqft | Rent | $/sqft | DOM | Units | Dist |
|---|---|---|---|---|---|---|---|---|
| 125 W 2nd St Waterford, PA | 3.0 | 1.5 | 1200 | $1,300 | $1.08 | 43d | 1 | 0.07mi |
| 423 W 3rd St Unit 4 Waterford, PA | 2.0 | 1.0 | 1150 | $1,400 | $1.22 | 43d | 1 | 0.37mi |
Listing history 7 events
-
2026-06-07statusdays on market $175,000 Pending 38 DOM
-
2026-06-02days on market $175,000 Active 35 DOM
-
2026-06-01days on market $175,000 Active 34 DOM
-
2026-05-31days on market $175,000 Active 33 DOM
-
2026-05-30days on market $175,000 Active 32 DOM
-
2026-04-28$195,000 Active 560-char remark
-
1995-11-14soldstatus $31,000
ⓘ Source: listings_history table (triggers on properties + properties_extension) + one-shot
backfill from property_details.listing_events for pre-trigger history.
Tax reassessment forecast PA · Partial reset (capped growth)
- Current annual tax
- $1,723 · $144/mo
- Projected year-2 tax
- $2,244 · $187/mo
- Expected delta
- +$521/yr (+$43/mo · 30.3%)
ⓘ Screening estimate from a state-policy table — verify with the county assessor before closing.
Climate risk First Street
- Flood 1/10 Low FEMA zone X (unshaded) · 0% chance over 30 yrs
- Wildfire 1/10 Low
- Heat 2/10 Low 7 d/yr ≥91°F today · 18 d/yr by 30 yrs out
- Wind 1/10 Low
- Air quality 2/10 Low 1 unhealthy d/yr today · 2 by 30 yrs out
Nearby sold comps map
Loading sold comps map…
Walkable amenities ~0.75 mi
Loading nearby amenities…
Taxation est. · year 1
- Rental income
- $15,846
- − Mortgage interest
- −$9,803
- − Property taxes
- −$1,723
- − Insurance
- −$875
- − Repairs & maintenance
- −$1,268
- − Management
- −$1,268
- − Depreciation
- −$5,091
- Taxable loss
- −$4,181
- Est. tax savings @ 24.0%
- +$1,003
- After-tax cash flow
- $-89/yr
For passive investors: Depreciation is non-cash, so a rental often shows a tax loss while cash-flowing — sheltering income. Rental losses are passive: they offset passive income freely, and up to $25,000/yr can offset ordinary (W-2) income if you actively participate and your MAGI is under $100k (phasing out to $0 by $150k); unused losses carry forward. On sale, claimed depreciation is recaptured at up to 25%, and gains may owe capital-gains tax (a 1031 exchange can defer both). Figures are a year-1 estimate at your 24.0% rate — not tax advice; consult a CPA.
Schools (NCES district)
- District
- Fort Leboeuf SD
- NCES district ID
- 4209990
- Math proficiency
- 52% ▼ -12.00%
- Reading proficiency
- 68% ▼ -6.00%
- Median HH income
- $54,607
- Composite
- 51.46/100
- National rank
- #1725
- State rank
- #77 of 539 in PA
Livability — Waterford
- Score
- 85/100
- State rank
- #79
- US rank
- #576
Category grades
Schools grade is shown separately in the Schools card above.
Census & demographics
- Census place
- Waterford, PA
- Population (ZIP)
- 9,485
Population outlook (Erie County) Hauer SSP2
- Today (2025)
- 272,159 people
- By 2030
- 266,299 · -2.2%
- By 2040
- 250,987 · -7.8%
- By 2050
- 234,925 · -13.7%
- By 2075
- 199,164 · -26.8%
- By 2100
- 162,985 · -40.1%
Race, ethnicity, and origin ACS 2023
- Neighborhood character
- Predominantly White (96%)
- Race & ethnicity
- White 96% Hispanic / Latino 3% Two or more races 3%
- Common ancestry
- Romanian 11% Serbian 2% Lithuanian 2%
- Foreign-born
- 1%
- Languages at home
- 99% English-only · Russian/Polish/Slavic 1%
Political lean MEDSL · Erie
- 2024 margin
- Toss-up / Even · D 49.0% · R 50.0%
- 2008→2024 swing
- -20.9pp toward R · 2008: 19.9pp · 2024: -1.0pp
- All cycles
- 2024: R+1.0 2020: D+1.0 2016: R+2.0 2012: D+16.9 2008: D+19.9
Not yet ingested
- Civics
- —
Market trends
- HPI YoY
- ▼ -121.87%
- Current HPI
- 245.5495
- Rent YoY
- —
- Metro
- —
- State GDP YoY
- ▲ 1.68%
- F500 in state
- 34
Industry mix (Fortune 500 HQ in PA)
| Industry | F500 HQs | Revenue |
|---|---|---|
| Healthcare | 2 | $309B |
|
||
| Insurance | 2 | $27B |
|
||
| Telecommunications / Media | 1 | $124B |
|
||
| Industrial Distribution | 1 | $22B |
|
||
| Financial Services | 1 | $20B |
|
||
| Chemicals / Materials | 1 | $18B |
|
||
Price history
+464.5% since first listed4 events — show timeline
- 2026-06-05 Pending — GEBOR
- 2026-05-21 Price Changed $175,000 GEBOR
- 2026-04-28 Listed $195,000 GEBOR
- 1995-11-14 Sold (Public Records) $31,000 Public Records
Property tax history
+2.9%/yrLatest (2026): $1,723 · +4.3% YoY. Source: county tax records.
Cash-flow waterfall
monthlySold comps — $/sqft
last 12 mo · ≤1 miLoading sold comps…