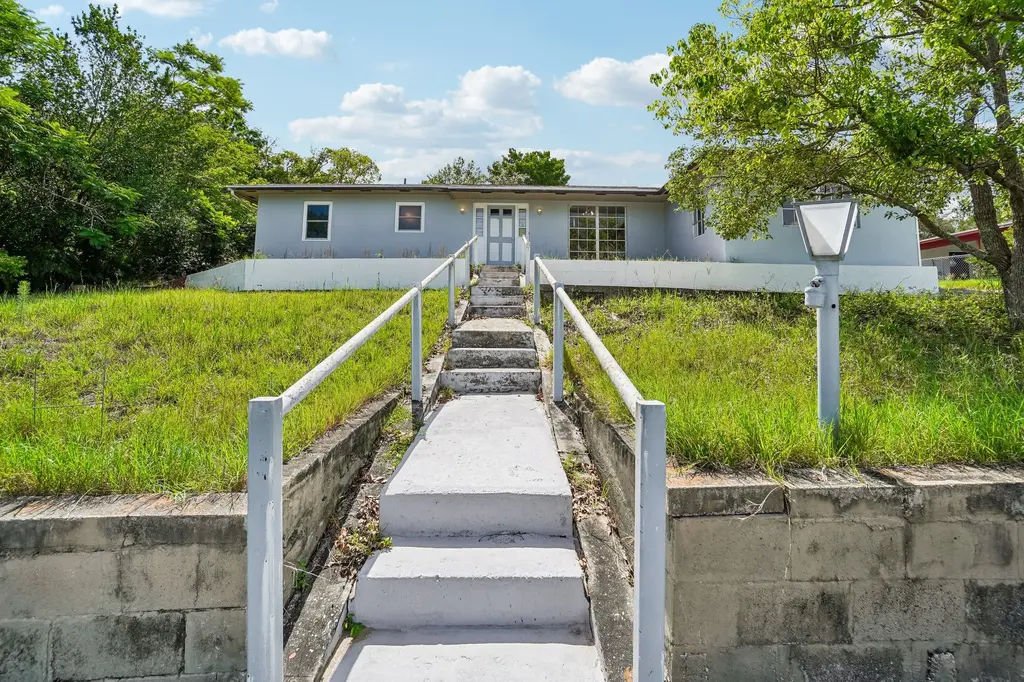
1090 Edgehill Ave · Spring Hill, FL
Flood risk 1/10 · Minimal
- FEMA flood zone
- X (unshaded)
- Chance of flooding over 30 yrs
- 0.0%
- Est. flood insurance / yr
- $507 – $1,088
Fire risk 4/10 · Minor
- Est. fire insurance / yr
- $947 – $1,759
Heat risk 10/10 · Severe
- Hot days now (above 110°F)
- 7 days/yr
- Hot days in 30 yrs
- 26 days/yr
Wind risk 10/10 · Severe
- Chance of severe wind over 30 yrs
- 99.0%
Air-quality risk 2/10 · Minimal
- Unhealthy air days now
- 1 days/yr
- Unhealthy air days in 30 yrs
- 3 days/yr
Risk factors via First Street. Map © Google.
Why this score? — see what drove the F grade
The composite is a weighted blend of 9 inputs, each scored 0–100. Each bar is that input's sub-score; the figure is the points it added to the 100-point composite (weight × sub-score).
- ARV discount +10.6/15.0
- Cash flow +7.6/30.0
- Schools +4.2/10.0
- Livability +3.2/5.0
- Condition / age +2.5/5.0
- Rent growth +2.3/5.0
- 1% rule +2.1/10.0
- DSCR +1.7/10.0
- Appreciation +0.0/10.0
$265,000
🖨 Deal sheet (PDF) 📄 Offer letter ✓ Due diligence
Listing remarks
INVESTOR SPECIAL WITH TONS OF POTENTIAL IN THE HEART OF SPRING HILL! This spacious 5 bedroom, 2 bathroom home offers approximately 1,836 square feet of living space and is ready for someone to bring it back to life. Originally built as a 2 bedroom, 2 bath home, the property was later expanded with additional bedrooms, including a garage conversion, creating plenty of possibilities for a large household, rental property, or future flip opportunity. Renovations have already been started but remain unfinished, giving the next owner the opportunity to complete the project to their own taste and vision. Several windows were replaced in 2025, and portions of the home have been painted and updated
Key facts
- Large driveway
- In-ground pool
- Garage conversion
Tags
Property features AI
Exterior
- Parking: Attached 2-car garage
- Utilities: Private water; Private sewer; Cable available; Water available
- Home design: Single family residence; One story; Faces west
- Construction: Concrete construction; Shingle roof; Slab foundation; Built on a 0.26-acre lot
- Exterior features: Lighting; Sidewalk; In-ground private pool; Asphalt road access
Interior
- Kitchen: Dishwasher; Range; Refrigerator
- Bedrooms: 2 bedrooms
- Flooring: Tile
- Bathrooms: 2 full bathrooms
- Heating & cooling: Central heating; Central air conditioning
- Interior features: Ceiling fans; Thermostat
- Laundry & utility: Washer hookup; Gas dryer hookup
Neighborhood map
What this means for you Summary
Snapshot
- This is a 2-bed/2.0-bath single-family listed at $265k.
Deal economics
- At list price, monthly cash flow is $-318 ($-4k/yr) — negative.
- To cash-flow at today's rent, offer at most $209k (21.2% below list).
- To meet the 1% rule (rent ≥ 1% of price), the offer needs to be $187k (29.3% below list).
- Recommended offer: $187k (29.3% below list) — sets the bar for 1% rule.
Location & tenants
- Location reads 63/100 on livability (#738 in FL) — a middle-class / working-renter tenant base. Strengths: cost of living A+, housing A+; Watch: health & safety C-, employment D+, amenities F.
- Hernando (suburban): math 50% / reading 50% proficiency, ranked #38 of 73 in FL (top 52%) — acceptable for families but not a draw, mixed tenant base, ~2y average lease.
- Zoned schools: Westside Elementary School (math 53% / reading 46%, grade D, #1,088 of 2,144 statewide, top 53%, 523 students, 76% FRL); Fox Chapel Middle School (math 39% / reading 44%, grade F, #348 of 571 statewide, top 62%, 862 students, 69% FRL); Weeki Wachee High School (math 41% / reading 42%, grade F, #284 of 667 statewide, top 43%, 1,435 students, 52% FRL).
- Market conditions: Rents soft (-0.9%/yr); 392 active listings in the ZIP; 8 comparable units currently listed for rent nearby; rentals at typical pace (median 26d on market — plan ~3-4 weeks tenant-placement turnaround); 2,505 units permitted in Hernando County in 2024 (318 in 5+ unit buildings).
- This rent runs 39% of the median local income ($57k/yr) — at the standard rent-burdened threshold; future hikes will face affordability resistance.
Forward outlook
- Local home prices are declining (-3.0%/yr); year-one equity from $2k of loan paydown is wiped out by about $8k of value loss. Plan a longer hold.
- Hernando County population projected at +11% by 2050 — modest demand growth; plan on rents tracking national, not racing it.
Negotiation context
- It's been on market 19 days — a 2% lower offer ($261k) is reasonable based on typical stale-listing flexibility.
- 2 sale attempts since 5y ago with the ask held roughly flat each time — persistent listings suggest the price (not the market) is what's stuck; bring a comps-based counter.
Risks & watch-outs
- Climate carrying-cost: severe wind risk, 99% chance of damaging wind over 30y; extreme-heat days projected 7→26/yr by 2055 (HVAC capex compounding) — expect insurance premiums to compound above CPI over the hold.
Questions for the listing agent
- What do current leases actually rent for vs. the listed asking? Can we see a recent rent roll and the last 12 months of T-12 income?
- Built in 1970 — when were the roof, HVAC, electrical panel, plumbing, and water heater last replaced?
- Is there a deadline driving the sale (1031 exchange, divorce, estate, relocation)? That informs how much negotiation room exists.
- The area grade is low — what's the realistic commute time and amenity access for the typical tenant pool here? Any planned neighborhood developments (good or bad) we should know about?
- What's the average days-on-market for RENTAL listings here right now (not sales)? A rising rental-DOM trend means longer vacancies and softer asking-rent achievability than the comps imply.
- What's the recent tenant-quality profile in this submarket — average credit score on applications, eviction rate, late-payment / NSF rate, and stable-employment percentage? A property-management company in the area should have these aggregated.
- How much new for-sale + rental construction is in the pipeline within 1–3 miles? Heavy new supply typically softens prices + rents 12–24 months out; constrained supply supports both.
Investment metrics
- 1% rule
- 0.71% ✗
- Cap rate
- 4.85%
- Cash-on-cash
- -5.15%
- DSCR
- 0.77
- GRM
- 11.8
CMA / ARV
- ARV (on-the-fly)
- $284,580
- Comps found
- 12
Show comp detail 12 sales within ~0.75 mi
| Address | Dist | Beds/Ba | Sqft | Sold | Price | $/sf | Match |
|---|---|---|---|---|---|---|---|
| 6913 Pinehurst Dr | 0.42mi | 3/2.0 (+1) | 1,906 (+4%) | 5mo | $235,000 | $123 | 65 |
| 6450 Trade Ct | 0.41mi | 3/2.0 (+1) | 1,887 (+3%) | 11mo | $316,700 | $168 | 62 |
| 6229 Dalton St | 0.59mi | 3/2.0 (+1) | 1,769 (-4%) | 3mo | $235,000 | $133 | 58 |
| 1358 Newhope Rd | 0.47mi | 3/2.0 (+1) | 1,920 (+5%) | 11mo | $298,000 | $155 | 56 |
| 6937 Treehaven Dr | 0.31mi | 3/2.0 (+1) | 1,626 (-11%) | 8mo | $300,000 | $185 | 55 |
| 6327 Skyline Ct | 0.62mi | 3/2.0 (+1) | 1,773 (-3%) | 7mo | $275,000 | $155 | 54 |
| 6808 Treehaven Dr | 0.34mi | 3/2.0 (+1) | 1,571 (-14%) | 2mo | $240,000 | $153 | 53 |
| 6602 Treehaven Dr | 0.55mi | 3/2.0 (+1) | 1,656 (-10%) | 2mo | $239,500 | $145 | 52 |
| 6516 Hillview Rd | 0.56mi | 3/2.0 (+1) | 1,745 (-5%) | 12mo | $300,000 | $172 | 51 |
| 380 Cobblestone Dr | 0.51mi | 2/2.0 | 1,588 (-14%) | 5mo | $299,900 | $189 | 50 |
| 1555 Newhope Rd | 0.74mi | 3/2.0 (+1) | 1,720 (-6%) | 7mo | $295,000 | $172 | 44 |
| 6256 Kimball Ct | 0.64mi | 2/2.0 | 1,633 (-11%) | 10mo | $250,000 | $153 | 43 |
Match score weights: distance 35% · size 25% · config 20% · recency 20%. Top-matched comps best support the ARV.
Projected returns pro-forma
-3.0% appreciation · 0.0% rent growth · sell at horizon
- IRR
- -28.4%
- Equity multiple
- 0.07×
- Total profit
- $-68,694
- Equity at exit
- $39,512
- IRR
- -44.2%
- Equity multiple
- -0.44×
- Total profit
- $-107,110
- Equity at exit
- $22,912
Cash invested: $74,200 (down + closing). Projections, not guarantees.
Landlord ↔ Tenant lean methodology
- Overall (STATE)
- 87 Strongly Landlord-Friendly
- State Florida
- 87 Strongly Landlord-Friendly · R+3
- County
- — inherits STATE
- City
- — inherits STATE
ZIP-level market 34606
- Home prices YoY
- -24.7%
- Rents YoY
- -0.9%
- Active inventory
- 392
- Price-to-rent
- 11.8×
Monthly cashflow live
- Estimated rent
- $1,874 high interval (Pro) →
- Mortgage (P&I)
- −$1,390
- Tax from tax record
- −$299 /mo · $3,587/yr
- Insurance
- −$110
- HOA
- −$0
- Vacancy / Maint / Mgmt
- −$394
- Net cashflow
- $-318
Break-even live
Sensitivity live
| Price | -10% $-168 | -5% $-243 | +0% $-318 | +5% $-393 | +10% $-468 |
|---|---|---|---|---|---|
| Rent | -10% $-466 | -5% $-392 | +0% $-318 | +5% $-244 | +10% $-170 |
| Rate | -1.0pp $-185 | -0.5pp $-251 | base $-318 | +0.5pp $-387 | +1.0pp $-457 |
UW: 25.0% down · 7.5% · 30yr · 1.5% tax · 5.0% vac · 8.0% maint · 8.0% mgmt
Financing live
Cash to close
- Down payment
- $66,250
- Closing costs
- $7,950
- Reserves months
- —
- Total cash needed
- —
Loan-product check · same deal, 3 products live
Conventional
25% down · 7.5% · 30yr
- Down + closing
- —
- Monthly P&I
- —
- Monthly cashflow
- —
- DSCR
- —
- Eligible?
- —
Personal DTI + credit; lowest rate.
DSCR
20% down · 8.5% · 30yr
- Down + closing
- —
- Monthly P&I
- —
- Monthly cashflow
- —
- DSCR
- —
- Eligible?
- —
No personal income docs; deal must DSCR.
Hard money
10% down · 12.0% · 12mo
- Down + closing
- —
- Monthly P&I
- —
- Monthly cashflow
- —
- DSCR
- —
- Eligible?
- —
Short-term bridge; refi at stabilization.
Rent comps 8 comps
| Address | Beds | Baths | Sqft | Rent | $/sqft | DOM | Units | Dist |
|---|---|---|---|---|---|---|---|---|
| 7176 Lockwood St Spring Hill, FL | 3.0 | 2.0 | 1272 | $1,795 | $1.41 | 26d | 1 | 0.41mi |
| 255 Killinger Ave Spring Hill, FL | 2.0 | 2.0 | 1266 | $1,900 | $1.50 | 26d | 1 | 0.66mi |
| 7646 Landmark Dr Spring Hill, FL | 2.0 | 2.0 | 1844 | $1,550 | $0.84 | 26d | 1 | 0.82mi |
| 7477 Canterbury St Spring Hill, FL | 2.0 | 2.0 | 1874 | $1,545 | $0.82 | 6d | 1 | 1.01mi |
| 8124 Omaha Cir Spring Hill, FL | 2.0 | 1.0 | 1933 | $1,365 | $0.71 | 22d | 1 | 1.07mi |
| 18720 Oak Way Dr Hudson, FL | 3.0 | 2.0 | 1839 | $2,700 | $1.47 | 5d | 1 | 1.18mi |
| 153 Rosedale Ave Spring Hill, FL | 3.0 | 2.0 | 1407 | $1,999 | $1.42 | 6d | 1 | 1.35mi |
| 153 Rosedale Ave Spring Hill, FL | 3.0 | 2.0 | 1407 | $2,100 | $1.49 | 26d | 1 | 1.35mi |
Listing history 13 events
-
2026-06-21days on market $265,000 Active 19 DOM
-
2026-06-18days on market $265,000 Active 16 DOM
-
2026-06-17days on market $265,000 Active 15 DOM
-
2026-06-16days on market $265,000 Active 14 DOM
-
2026-06-15days on market $265,000 Active 13 DOM
-
2026-06-13days on market $265,000 Active 11 DOM
-
2026-06-13days on market $265,000 Active 10 DOM
-
2026-06-09days on market $265,000 Active 7 DOM
-
2026-06-08days on market $265,000 Active 6 DOM
-
2026-06-07days on market $265,000 Active 5 DOM
-
2026-06-04days on market $265,000 Active 2 DOM
-
2026-06-02remarks 699-char remark
-
2026-06-02$265,000 Active 1 DOM
ⓘ Source: listings_history table (triggers on properties + properties_extension) + one-shot
backfill from property_details.listing_events for pre-trigger history.
Tax reassessment forecast FL · Resets to sale price
- Current annual tax
- $3,587 · $299/mo
- Projected year-2 tax
- $3,587 · $299/mo
- Expected delta
- $0/yr ($0/mo · 0.0%)
ⓘ Screening estimate from a state-policy table — verify with the county assessor before closing.
Climate risk First Street
- Flood 1/10 Low FEMA zone X (unshaded) · 0% chance over 30 yrs
- Wildfire 4/10 Moderate
- Heat 10/10 Extreme 7 d/yr ≥110°F today · 26 d/yr by 30 yrs out
- Wind 10/10 Extreme 99% chance of damaging wind over 30 yrs
- Air quality 2/10 Low 1 unhealthy d/yr today · 3 by 30 yrs out
Nearby sold comps map
Loading sold comps map…
Walkable amenities ~0.75 mi
Loading nearby amenities…
Taxation est. · year 1
- Rental income
- $22,493
- − Mortgage interest
- −$14,844
- − Property taxes
- −$3,587
- − Insurance
- −$1,325
- − Repairs & maintenance
- −$1,799
- − Management
- −$1,799
- − Depreciation
- −$7,709
- Taxable loss
- −$8,571
- Est. tax savings @ 24.0%
- +$2,057
- After-tax cash flow
- $-1,762/yr
For passive investors: Depreciation is non-cash, so a rental often shows a tax loss while cash-flowing — sheltering income. Rental losses are passive: they offset passive income freely, and up to $25,000/yr can offset ordinary (W-2) income if you actively participate and your MAGI is under $100k (phasing out to $0 by $150k); unused losses carry forward. On sale, claimed depreciation is recaptured at up to 25%, and gains may owe capital-gains tax (a 1031 exchange can defer both). Figures are a year-1 estimate at your 24.0% rate — not tax advice; consult a CPA.
Schools (NCES district)
- District
- Hernando
- NCES district ID
- 1200810
- Math proficiency
- 50% ▼ -8.00%
- Reading proficiency
- 50% ▼ -4.00%
- Median HH income
- $41,985
- Composite
- 42.03/100
- National rank
- #3329
- State rank
- #38 of 73 in FL
Livability — Spring Hill
- Score
- 63/100
- State rank
- #738
- US rank
- #15937
Category grades
Schools grade is shown separately in the Schools card above.
Census & demographics
- Census place
- Spring Hill, FL
- County
- Hernando County · 169,677 people
- City population
- 83,915
- Metro
- Tampa-St. Petersburg-Clearwater, FL
- Population (ZIP)
- 28,668
- Household income
- $57,337
- Rent vs Own
- Severe rent burden
- 733.0
Population outlook (Hernando County) Hauer SSP2
- Today (2025)
- 189,218 people
- By 2030
- 194,367 · +2.7%
- By 2040
- 203,398 · +7.5%
- By 2050
- 209,589 · +10.8%
- By 2075
- 218,452 · +15.4%
- By 2100
- 205,923 · +8.8%
Race, ethnicity, and origin ACS 2023
- Neighborhood character
- Predominantly White (74%)
- Race & ethnicity
- White 74% Hispanic / Latino 16% Two or more races 13% Black 4%
- Hispanic origin (detail)
- Mexican 1% Puerto Rican 10% Cuban 2%
- Common ancestry
- Romanian 4% Lithuanian 3% Slovak 2%
- Foreign-born
- 8% · Canada, Jamaica
- Languages at home
- 87% English-only · Spanish 11% German/W. Germanic 1%
Political lean MEDSL · Hernando
- 2024 margin
- Solid R (+37.0) · D 31.1% · R 68.2%
- 2008→2024 swing
- -33.5pp toward R · 2008: -3.6pp · 2024: -37.0pp
- All cycles
- 2024: R+37.0 2020: R+30.2 2016: R+29.0 2012: R+8.5 2008: R+3.6
Not yet ingested
- Civics
- —
Market trends
- HPI YoY
- ▼ -98.11%
- Current HPI
- 298.5201
- Rent YoY
- ▼ -0.89%
- Metro
- Tampa-St. Petersburg-Clearwater, FL
- State GDP YoY
- ▲ 3.28%
- F500 in state
- 36
Industry mix (Fortune 500 HQ in FL)
| Industry | F500 HQs | Revenue |
|---|---|---|
| Industrial Technology | 2 | $29B |
|
||
| Insurance | 2 | $17B |
|
||
| Retail | 1 | $60B |
|
||
| Technology Distribution | 1 | $58B |
|
||
| Homebuilding | 1 | $35B |
|
||
| Technology Manufacturing | 1 | $35B |
|
||
Price history
-6.4% since first listed4 events — show timeline
- 2026-06-02 Listed $265,000 Stellar MLS as Distributed by MLS Grid
- 2022-06-28 Price Changed $2,160 RENT.
- 2022-06-22 Listing Removed — Stellar MLS as Distributed by MLS Grid
- 2021-12-01 Listed $283,000 Stellar MLS as Distributed by MLS Grid
Property tax history
+9.0%/yrLatest (2025): $3,587 · +2.3% YoY. Source: county tax records.
Cash-flow waterfall
monthlySold comps — $/sqft
last 12 mo · ≤1 miLoading sold comps…