 5-Plex
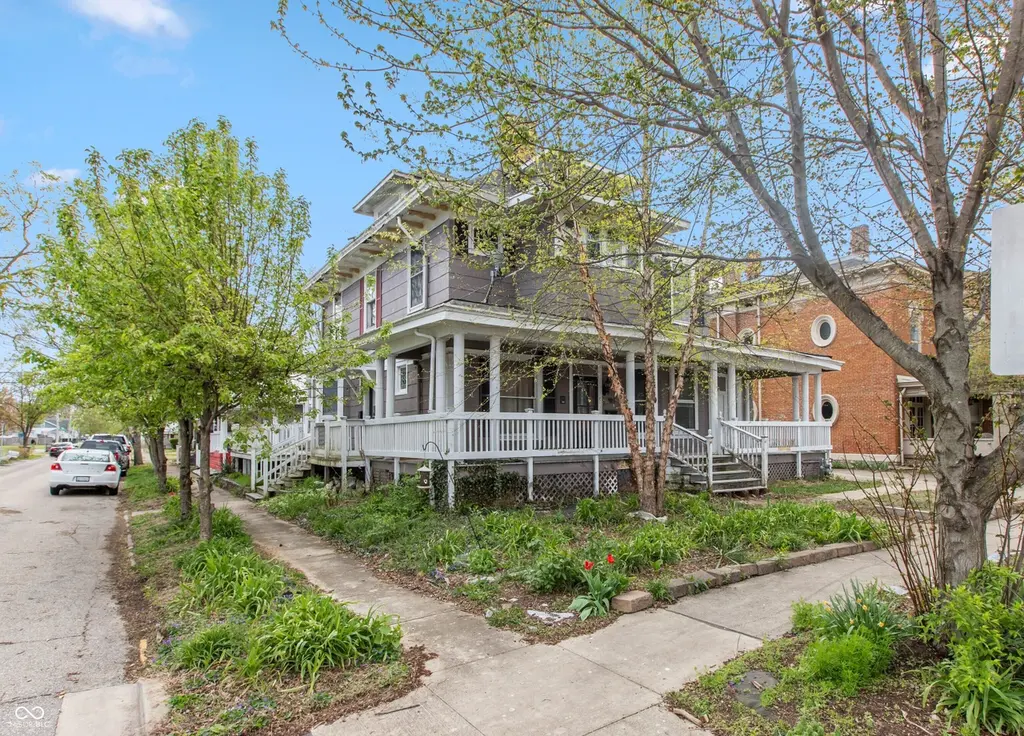
929 Franklin St · Columbus, IN
Flood risk 1/10 · Minimal
- FEMA flood zone
- X (unshaded)
- Chance of flooding over 30 yrs
- 0.0%
- Est. flood insurance / yr
- $473 – $860
Fire risk 1/10 · Minimal
- Est. fire insurance / yr
- $717 – $1,331
Heat risk 4/10 · Minor
- Hot days now (above 103°F)
- 7 days/yr
- Hot days in 30 yrs
- 19 days/yr
Wind risk 2/10 · Minimal
- Chance of severe wind over 30 yrs
- 1.0%
Air-quality risk 2/10 · Minimal
- Unhealthy air days now
- 1 days/yr
- Unhealthy air days in 30 yrs
- 2 days/yr
Risk factors via First Street. Map © Google.
Why this score? — see what drove the C+ grade
The composite is a weighted blend of 9 inputs, each scored 0–100. Each bar is that input's sub-score; the figure is the points it added to the 100-point composite (weight × sub-score).
- Cash flow +30.0/30.0
- 1% rule +10.0/10.0
- DSCR +10.0/10.0
- Livability +4.0/5.0
- Schools +3.6/10.0
- Rent growth +3.3/5.0
- Condition / age +2.5/5.0
- ARV discount +0.0/15.0
- Appreciation +0.0/10.0
$399,900
🖨 Deal sheet 📄 Offer letter ✓ Due diligence
Multi-family units
County records classify this as Multi-Family (2-4 Unit). Listing-text estimate: 5 units. estimate disagrees with records
Listing remarks MLS
Five units all rented, in historic district of Columbus. Excellent opportunity to invest in established neighborhood with cash flow positive. Sold "As Is" addendum in supplements
Key facts
- Separate utilities
- Mix of units
- 4,748 sq ft lot
Tags
Property features AI
Finance
- Other: Unit rents reported individually (examples): Unit rents range from $900–$1,300 per month; Owner pays all utilities
- Financial info: Five total units; Reported gross income: $2,550 (monthly); Reported expenses: $2,500 (monthly)
Exterior
- Parking: On-street parking available; Attached parking (no garage spaces)
- Security: Smoke detectors installed
- Utilities: Water and sewer available; No municipal solid waste service
- Home design: Residential income property (quadruplex); Converted property; Two levels
- Construction: Property size under 1/4 acre (approx. 0.11 acre)
- Exterior features: Asphalt roof; Corner lot with sidewalks; Street cuts for road access; Road frontage on a city street; Asphalt road surface
Interior
- Kitchen: Unit kitchens include Range/Oven and Refrigerator
- Bedrooms: Unit configurations vary (see unit details)
- Heating & cooling: Heat and hot water provided (included in unit utilities)
- Interior features: Full basement; Has a view; Low-maintenance lifestyle
- Laundry & utility: No on-site laundry facilities; Owner pays all utilities for building
Neighborhood map
What this means for you Summary
Snapshot
- This is a 5 × 3-bed/3.2-bath units multifamily listed at $400k.
Deal economics
- At list price, monthly cash flow is $3k ($32k/yr) — positive. Per door: $530/mo.
- The deal already cash-flows at list — no discount required.
- Meets the 1% rule at list price ($7k rent vs $400k).
- Recommended offer: $388k (3.0% below list) — sets the bar for market timing.
- Cap rate 14.2% vs local median 3.5% in Columbus — top-decile yield for the area; either an underpriced asset or a hidden risk that comps aren't pricing in. Stress-test before assuming the spread holds.
Location & tenants
- Location reads 79/100 on livability (#24 in IN, #1,978 nationally) — a middle-class / working-renter tenant base. Strengths: crime A+, cost of living A+, housing A+; Watch: amenities D+, commute F.
- Bartholomew Consolidated School Corporation (urban): math 38% / reading 45% proficiency, ranked #119 of 301 in IN (top 40%) — families likely to look elsewhere, expect single-tenant / working-renter base with shorter leases.
- Zoned schools: Lillian Schmitt Elementary School (math 24% / reading 29%, grade F, #755 of 994 statewide, top 76%, 677 students, 74% FRL); Columbus North High School (math 40% / reading 65%, grade C-, #102 of 369 statewide, top 28%, 2,224 students, 39% FRL) — zoned schools average 56% FRL vs 38% district-wide (19 pts higher); higher-poverty schools than district average — tighter screening recommended.
- Market conditions: Rents rising (+3.1%/yr); 340 active listings in the ZIP; solid renter incomes; 195 units permitted in Bartholomew County in 2024 (0 in 5+ unit buildings).
- At $7,051/mo this rent would consume 101% of the median local household income ($84k/yr) (locally 1455% of renters already pay >50% of income on rent) — very limited rent-growth headroom before tenants either downsize or default.
Forward outlook
- Local home prices are declining (-3.0%/yr); year-one equity from $3k of loan paydown is wiped out by about $12k of value loss. Plan a longer hold.
- Bartholomew County population projected at +22% by 2050 — long-run rental-demand tailwind backs the buy-and-hold thesis.
- At projected returns (-3.0% appreciation + 3.1% rent growth), your $112k cash investment doubles in ~5 years — after that, you're playing with house money.
Negotiation context
- It's been on market 51 days — a 3% lower offer ($388k) is reasonable based on typical stale-listing flexibility.
- 2 sale attempts since 5y ago with the ask held roughly flat each time — persistent listings suggest the price (not the market) is what's stuck; bring a comps-based counter.
- Current owner paid $330k; 21% above their basis — modest negotiation headroom, anchor on the comps not their cost.
Risks & watch-outs
- Watch-outs: built in 1890 — expect roof / HVAC / electrical / plumbing capex.
Questions for the listing agent
- It's been on market 51 days. Have you received any prior offers? Is the seller open to a 3% concession, seller financing, or rate buy-down credit?
- Can we see the unit-by-unit rent roll, current vacancy, and any below-market leases? What's the average tenancy length?
- What capital expenditures (roof, boiler, parking lot, exteriors) have been made in the last 5 years, and what's planned in the next 2?
- Built in 1890 — when were the roof, HVAC, electrical panel, plumbing, and water heater last replaced?
- Is there a deadline driving the sale (1031 exchange, divorce, estate, relocation)? That informs how much negotiation room exists.
- Schools are B-rated — typically a magnet for longer-tenancy family renters. What's the average tenant stay here, and is there a school-zone premium baked into asking?
- What's the average days-on-market for RENTAL listings here right now (not sales)? A rising rental-DOM trend means longer vacancies and softer asking-rent achievability than the comps imply.
- What's the recent tenant-quality profile in this submarket — average credit score on applications, eviction rate, late-payment / NSF rate, and stable-employment percentage? A property-management company in the area should have these aggregated.
- How much new apartment / multifamily construction is in the pipeline within 1–3 miles? Heavy new supply (>2% of stock underway) typically softens rents 12–24 months out; light construction supports rent growth.
Investment metrics
- 1% rule
- 1.76% ✓
- Cap rate
- 14.24%
- Cash-on-cash
- 28.39%
- DSCR
- 2.26
- GRM
- 4.7
CMA / ARV
- ARV (on-the-fly)
- $337,344
- Comps found
- 2
Show comp detail 2 sales within ~0.75 mi
| Address | Dist | Beds/Ba | Sqft | Sold | Price | $/sf | Match |
|---|---|---|---|---|---|---|---|
| 930 7th St | 0.36mi | 4/3.0 | 2,600 (-14%) | 4mo | $290,000 | $112 | 49 |
| 1612 Union St | 0.60mi | 5/3.0 (+1) | 2,835 (-6%) | 22mo | $140,000 | $49 | 31 |
Match score weights: distance 35% · size 25% · config 20% · recency 20%. Top-matched comps best support the ARV.
Projected returns pro-forma
-3.0% appreciation · 3.15% rent growth · sell at horizon
- IRR
- 22.8%
- Equity multiple
- 1.94×
- Total profit
- $105,170
- Equity at exit
- $59,626
- IRR
- 30.9%
- Equity multiple
- 3.80×
- Total profit
- $314,024
- Equity at exit
- $34,576
Cash invested: $111,972 (down + closing). Projections, not guarantees.
Landlord ↔ Tenant lean methodology
- Overall (STATE)
- 90 Strongly Landlord-Friendly
- State Indiana
- 90 Strongly Landlord-Friendly · R+11
- County
- — inherits STATE
- City
- — inherits STATE
ZIP-level market 47201
- Rents YoY
- 3.1%
- Active inventory
- 340
- Price-to-rent
- 23.6×
Monthly cashflow live
- Estimated rent
- $7,051 medium interval (Pro) →
- Mortgage (P&I)
- −$2,097
- Tax from tax record
- −$658 /mo · $7,893/yr
- Insurance
- −$167
- HOA
- −$0
- Vacancy / Maint / Mgmt
- −$1,481
- Net cashflow
- $2,649
Break-even live
5-unit breakdown (identical units grouped — click to expand)
| Units | Beds | Baths | Est. rent |
|---|---|---|---|
| 5× units | 3 | 3.2 | $7,050 |
| #1 | 3 | 3.2 | $1,410 |
| #2 | 3 | 3.2 | $1,410 |
| #3 | 3 | 3.2 | $1,410 |
| #4 | 3 | 3.2 | $1,410 |
| #5 | 3 | 3.2 | $1,410 |
| Total (5 units) | $7,051 | ||
UW: 25.0% down · 7.5% · 30yr · 1.5% tax · 5.0% vac · 8.0% maint · 8.0% mgmt
Financing live
Cash to close
- Down payment
- $99,975
- Closing costs
- $11,997
- Reserves months
- —
- Total cash needed
- —
Loan-product check · same deal, 3 products live
Conventional
25% down · 7.5% · 30yr
- Down + closing
- —
- Monthly P&I
- —
- Monthly cashflow
- —
- DSCR
- —
- Eligible?
- —
Personal DTI + credit; lowest rate.
DSCR
20% down · 8.5% · 30yr
- Down + closing
- —
- Monthly P&I
- —
- Monthly cashflow
- —
- DSCR
- —
- Eligible?
- —
No personal income docs; deal must DSCR.
Hard money
10% down · 12.0% · 12mo
- Down + closing
- —
- Monthly P&I
- —
- Monthly cashflow
- —
- DSCR
- —
- Eligible?
- —
Short-term bridge; refi at stabilization.
Listing history 22 events
-
2026-06-19days on market $399,900 Active 51 DOM
-
2026-06-18days on market $399,900 Active 50 DOM
-
2026-06-17days on market $399,900 Active 49 DOM
-
2026-06-16days on market $399,900 Active 48 DOM
-
2026-06-15days on market $399,900 Active 47 DOM
-
2026-06-14days on market $399,900 Active 45 DOM
-
2026-06-13days on market $399,900 Active 44 DOM
-
2026-06-10days on market $399,900 Active 42 DOM
-
2026-06-09days on market $399,900 Active 41 DOM
-
2026-06-08days on market $399,900 Active 40 DOM
-
2026-06-07days on market $399,900 Active 39 DOM
-
2026-06-05days on market $399,900 Active 36 DOM
-
2026-06-03days on market $399,900 Active 35 DOM
-
2026-06-02days on market $399,900 Active 34 DOM
-
2026-06-01days on market $399,900 Active 33 DOM
-
2026-05-31days on market $399,900 Active 32 DOM
-
2026-05-30days on market $399,900 Active 31 DOM
-
2026-04-28$399,900 Active
-
2022-01-25soldstatus $330,000 Closed 189-char remark
Show marketing remark (189 chars)
Five units all rented, in historic district of Columbus. Excellent opportunity to invest in established neighborhood with cash flow positive. Sold "As Is" addendum in supplements
-
2021-11-19status Pending 189-char remark
Show marketing remark (189 chars)
Five units all rented, in historic district of Columbus. Excellent opportunity to invest in established neighborhood with cash flow positive. Sold "As Is" addendum in supplements
-
2021-11-09price $338,500 189-char remark
Show marketing remark (189 chars)
Five units all rented, in historic district of Columbus. Excellent opportunity to invest in established neighborhood with cash flow positive. Sold "As Is" addendum in supplements
-
2021-09-02$349,900 Active 189-char remark
Show marketing remark (189 chars)
Five units all rented, in historic district of Columbus. Excellent opportunity to invest in established neighborhood with cash flow positive. Sold "As Is" addendum in supplements
ⓘ Source: listings_history table (triggers on properties + properties_extension) + one-shot
backfill from property_details.listing_events for pre-trigger history.
Tax reassessment forecast IN · Partial reset (capped growth)
- Current annual tax
- $7,893 · $658/mo
- Projected year-2 tax
- $7,893 · $658/mo
- Expected delta
- $0/yr ($0/mo · 0.0%)
ⓘ Screening estimate from a state-policy table — verify with the county assessor before closing.
Climate risk First Street
- Flood 1/10 Low FEMA zone X (unshaded) · 0% chance over 30 yrs
- Wildfire 1/10 Low
- Heat 4/10 Moderate 7 d/yr ≥103°F today · 19 d/yr by 30 yrs out
- Wind 2/10 Low 100% chance of damaging wind over 30 yrs
- Air quality 2/10 Low 1 unhealthy d/yr today · 2 by 30 yrs out
Nearby sold comps map
Loading sold comps map…
Walkable amenities ~0.75 mi
Loading nearby amenities…
Taxation est. · year 1
- Rental income
- $84,612
- − Mortgage interest
- −$22,401
- − Property taxes
- −$7,893
- − Insurance
- −$2,000
- − Repairs & maintenance
- −$6,769
- − Management
- −$6,769
- − Depreciation
- −$11,633
- Taxable income
- $27,147
- Est. tax owed @ 24.0%
- −$6,515
- After-tax cash flow
- $25,270/yr
For passive investors: Depreciation is non-cash, so a rental often shows a tax loss while cash-flowing — sheltering income. Rental losses are passive: they offset passive income freely, and up to $25,000/yr can offset ordinary (W-2) income if you actively participate and your MAGI is under $100k (phasing out to $0 by $150k); unused losses carry forward. On sale, claimed depreciation is recaptured at up to 25%, and gains may owe capital-gains tax (a 1031 exchange can defer both). Figures are a year-1 estimate at your 24.0% rate — not tax advice; consult a CPA.
Schools (NCES district)
- District
- Bartholomew Consolidated School Corporation
- NCES district ID
- 1800360
- Math proficiency
- 38% ▼ -11.00%
- Reading proficiency
- 45% ▼ -7.00%
- Median HH income
- $54,685
- Composite
- 36.16/100
- National rank
- #4736
- State rank
- #119 of 301 in IN
Livability — Columbus
- Score
- 79/100
- State rank
- #24
- US rank
- #1978
Category grades
Schools grade is shown separately in the Schools card above.
Census & demographics
- Census place
- Columbus, IN
- County
- Bartholomew County · 74,100 people
- City population
- 74,100
- Metro
- Columbus, IN
- Population (ZIP)
- 47,900
- Household income
- $83,958
- Rent vs Own
- Severe rent burden
- 1455.0
Population outlook (Bartholomew County) Hauer SSP2
- Today (2025)
- 90,162 people
- By 2030
- 94,432 · +4.7%
- By 2040
- 102,659 · +13.9%
- By 2050
- 109,794 · +21.8%
- By 2075
- 123,419 · +36.9%
- By 2100
- 121,047 · +34.3%
Race, ethnicity, and origin ACS 2023
- Neighborhood character
- Predominantly White (75%)
- Race & ethnicity
- White 75% Hispanic / Latino 10% Asian 9% Two or more races 6% Black 2%
- Hispanic origin (detail)
- Mexican 8% Puerto Rican 1%
- Common ancestry
- Italian 3% Slovak 2% Serbian 1%
- Foreign-born
- 14% · Canada, China
- Languages at home
- 83% English-only · Spanish 8% Other Indo-European 5% Other Asian/Pacific 2%
Political lean MEDSL · Bartholomew
- 2024 margin
- Strong R (+27.3) · D 35.3% · R 62.7% · Other 2.0%
- 2008→2024 swing
- -16.1pp toward R · 2008: -11.3pp · 2024: -27.3pp
- All cycles
- 2024: R+27.3 2020: R+26.2 2016: R+33.3 2012: R+25.4 2008: R+11.3
Not yet ingested
- Civics
- —
Market trends
- HPI YoY
- ▼ -204.94%
- Current HPI
- 150.2246
- Rent YoY
- ▲ 3.15%
- Metro
- Columbus, IN
- State GDP YoY
- ▲ 2.90%
- F500 in state
- 18
Industry mix (Fortune 500 HQ in IN)
| Industry | F500 HQs | Revenue |
|---|---|---|
| Industrial Machinery | 2 | $37B |
|
||
| Healthcare | 1 | $177B |
|
||
| Pharmaceuticals | 1 | $45B |
|
||
| Metals / Steel | 1 | $18B |
|
||
| Agriculture | 1 | $17B |
|
||
| Packaging | 1 | $12B |
|
||
Price history
+14.3% since first listed5 events — show timeline
- 2026-04-28 Listed $399,900 MIBOR as Distributed by MLS Grid
- 2022-01-25 Sold (MLS) $330,000 MIBOR as Distributed by MLS Grid
- 2021-11-19 Pending — MIBOR as Distributed by MLS Grid
- 2021-11-09 Price Changed $338,500 MIBOR as Distributed by MLS Grid
- 2021-09-02 Listed $349,900 MIBOR as Distributed by MLS Grid
Property tax history
+14.2%/yrLatest (2024): $7,893 · +10.5% YoY. Source: county tax records.
Cash-flow waterfall
monthlySold comps — $/sqft
last 12 mo · ≤1 miLoading sold comps…