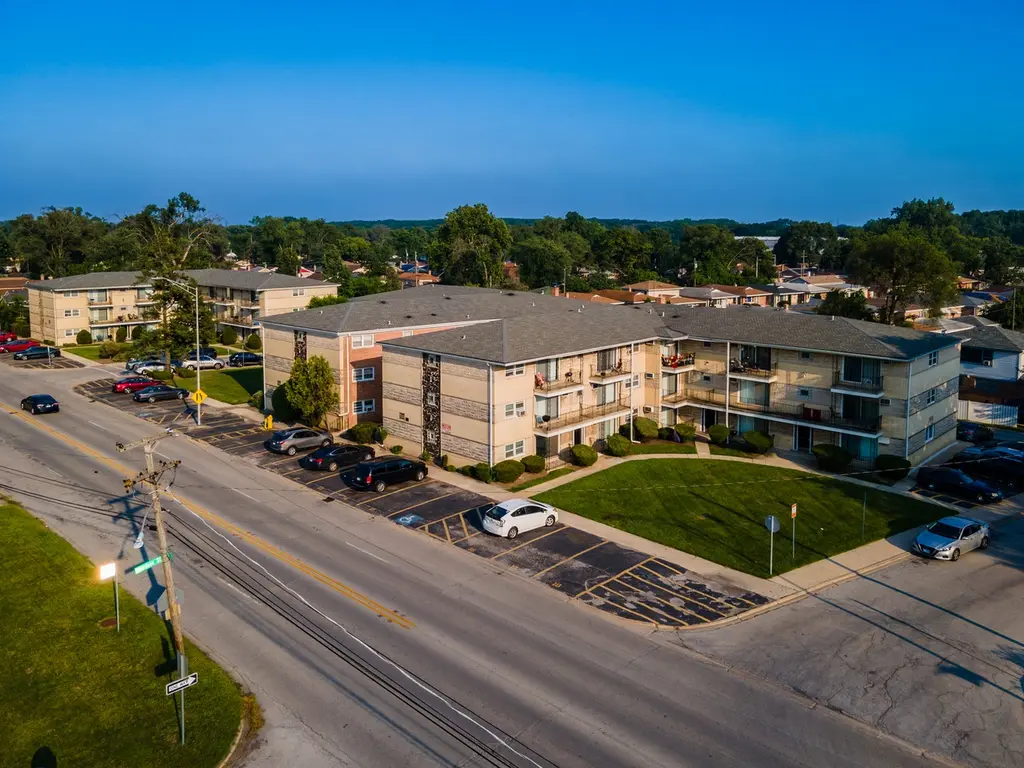
 60-Plex
1025 - 49 W Vermont St · Calumet Park, IL
Flood risk No data
- FEMA flood zone
- —
- Chance of flooding over 30 yrs
- —
- Est. flood insurance / yr
- —
Fire risk No data
- Est. fire insurance / yr
- —
Heat risk No data
- Hot days now (above threshold)
- —
- Hot days in 30 yrs
- —
Wind risk No data
- Chance of severe wind over 30 yrs
- —
Air-quality risk No data
- Unhealthy air days now
- —
- Unhealthy air days in 30 yrs
- —
Risk factors via First Street. Map © Google.
Why this score? — see what drove the B- grade
The composite is a weighted blend of 9 inputs, each scored 0–100. Each bar is that input's sub-score; the figure is the points it added to the 100-point composite (weight × sub-score).
- Cash flow +29.2/30.0
- DSCR +10.0/10.0
- 1% rule +8.2/10.0
- ARV discount +7.5/15.0
- Rent growth +4.5/5.0
- Condition / age +4.0/5.0
- Livability +3.6/5.0
- Schools +1.6/10.0
- Appreciation +0.0/10.0
$5,880,000
🖨 Deal sheet 📄 Offer letter ✓ Due diligence
Multi-family units
County records classify this as Multi-Family (5+ Unit). Listing-text estimate: 60 units. confirmed
5+ unit building — per-unit beds/baths from public records are typically unavailable; the breakdown below (if shown) is an estimate from the listing text.
Listing remarks
Pleased to present the exclusive offering of Vermont Street Apartments, a 20-unit apartment community located at 1025-1029 W. Vermont St, Calumet Park, IL 60827. This exceptional investment opportunity consists of a 20-unit yellow brick flexicore building totaling 20,153 SF and offering a desirable unit mix, strong in-place income, and significant upside potential. The property offers 23 off-street parking spaces, private balconies for each unit, and convenient on-site laundry facilities. The community features a well-maintained exterior with excellent curb appeal in a quiet residential neighborhood, supported by recent capital improvements including newer roofs, upgraded common areas, and
Key facts
- Private balconies
- Newer roofs
- 0.69 acre lot
Tags
Property features AI
Finance
- Other: Owned as a limited partnership; Additional parcel IDs included
- Financial info: Total of 60 rental units; One-bedroom units: 40 units, typical monthly rent $1,100 (max $1,300); Two-bedroom units: 20 units, typical monthly rent $960 (max $1,100)
Exterior
- Parking: Outdoor parking with capacity for 51–100 spaces
- Utilities: Electric service with circuit breakers
- Home design: Multifamily building (5+ units); Limited partnership ownership
- Construction: Brick construction; Pitched composition roof; Built before 1978
- Exterior features: Lot dimensions approximately 236 x 127
Interior
- Kitchen: 60 ranges available (building equipment)
- Bedrooms: 20 two-bedroom units; 40 one-bedroom units
- Bathrooms: Each unit has 1 full bathroom
- Heating & cooling: Central building heating; Individual window AC units
- Interior features: Central building heat; Window air conditioning units throughout (60 units)
- Laundry & utility: 6 washers (building equipment); 6 dryers (building equipment)
Neighborhood map
What this means for you Summary
Snapshot
- This is a 20×2bd/1ba + 40×1bd/1ba units multifamily listed at $5.88M. Condition is rated good.
Deal economics
- At list price, monthly cash flow is $21k ($247k/yr) — positive. Per door: $343/mo.
- The deal already cash-flows at list — no discount required.
- Meets the 1% rule at list price ($77k rent vs $5.88M).
- Recommended offer: $5.79M (1.5% below list) — sets the bar for market timing.
- Cap rate 10.5% vs local median 6.7% in Calumet Park — top-decile yield for the area; either an underpriced asset or a hidden risk that comps aren't pricing in. Stress-test before assuming the spread holds.
Location & tenants
- Location reads 72/100 on livability (#308 in IL) — a middle-class / working-renter tenant base. Strengths: commute A+, cost of living A+, housing A+; Watch: employment C-, schools F, crime F.
- Chsd 218 (suburban): math 14% / reading 20% proficiency, ranked #454 of 620 in IL (top 73%) — low school quality limits family demand, transient renter base, plan for 1-2y turnover.
- Market conditions: Rents rising fast (+7.8%/yr); 76 active listings in the ZIP; lower-income renter base — watch delinquency; 6,272 units permitted in Cook County in 2024 (4,658 in 5+ unit buildings).
- At $77,460/mo this rent would consume 2498% of the median local household income ($37k/yr) (locally 1868% of renters already pay >50% of income on rent) — very limited rent-growth headroom before tenants either downsize or default.
Forward outlook
- Local home prices are declining (-3.0%/yr); year-one equity from $41k of loan paydown is wiped out by about $176k of value loss. Plan a longer hold.
- At projected returns (-3.0% appreciation + 7.8% rent growth), your $1.65M cash investment doubles in ~6 years — after that, you're playing with house money.
Negotiation context
- It's been on market 16 days — a 2% lower offer ($5.79M) is reasonable based on typical stale-listing flexibility.
- 11 sale attempts since 2y ago with the ask held roughly flat each time — persistent listings suggest the price (not the market) is what's stuck; bring a comps-based counter.
Questions for the listing agent
- Can we see the unit-by-unit rent roll, current vacancy, and any below-market leases? What's the average tenancy length?
- What capital expenditures (roof, boiler, parking lot, exteriors) have been made in the last 5 years, and what's planned in the next 2?
- Built in 1969 — when were the roof, HVAC, electrical panel, plumbing, and water heater last replaced?
- Is there a deadline driving the sale (1031 exchange, divorce, estate, relocation)? That informs how much negotiation room exists.
- Schools are F-rated, which usually means shorter tenancies and higher turnover. Who's the typical renter profile here, and what's been the actual vacancy rate?
- Crime grade is F in this area — have there been break-ins, vandalism, or insurance claims at this property in the last 3 years? What carrier currently insures it and at what premium?
- What's the average days-on-market for RENTAL listings here right now (not sales)? A rising rental-DOM trend means longer vacancies and softer asking-rent achievability than the comps imply.
- What's the recent tenant-quality profile in this submarket — average credit score on applications, eviction rate, late-payment / NSF rate, and stable-employment percentage? A property-management company in the area should have these aggregated.
- How much new apartment / multifamily construction is in the pipeline within 1–3 miles? Heavy new supply (>2% of stock underway) typically softens rents 12–24 months out; light construction supports rent growth.
Investment metrics
- 1% rule
- 1.32% ✓
- Cap rate
- 10.49%
- Cash-on-cash
- 14.98%
- DSCR
- 1.67
- GRM
- 6.3
CMA / ARV
No comps found within radius.
Projected returns pro-forma
-3.0% appreciation · 7.82% rent growth · sell at horizon
- IRR
- 10.9%
- Equity multiple
- 1.46×
- Total profit
- $751,632
- Equity at exit
- $876,727
- IRR
- 23.6%
- Equity multiple
- 3.51×
- Total profit
- $4,131,355
- Equity at exit
- $508,395
Cash invested: $1,646,400 (down + closing). Projections, not guarantees.
Landlord ↔ Tenant lean methodology
- Overall (STATE)
- 43 Moderately Tenant-Leaning
- State Illinois
- 43 Moderately Tenant-Leaning · D+7
- County
- — inherits STATE
- City
- — inherits STATE
ZIP-level market 60827
- Home prices YoY
- -31.8%
- Rents YoY
- 7.8%
- Active inventory
- 76
- Price-to-rent
- 335.2×
Monthly cashflow live
- Estimated rent
- $77,460 high interval (Pro) →
- Mortgage (P&I)
- −$30,835
- Tax est. 1.5%
- −$7,350 /mo · $88,200/yr
- Insurance
- −$2,450
- HOA
- −$0
- Vacancy / Maint / Mgmt
- −$16,267
- Net cashflow
- $20,558
Break-even live
60-unit breakdown (identical units grouped — click to expand)
| Units | Beds | Baths | Est. rent |
|---|---|---|---|
| 20× units | 2 | 1 | $29,240 |
| #1 | 2 | 1 | $1,462 |
| #2 | 2 | 1 | $1,462 |
| #3 | 2 | 1 | $1,462 |
| #4 | 2 | 1 | $1,462 |
| #5 | 2 | 1 | $1,462 |
| #6 | 2 | 1 | $1,462 |
| #7 | 2 | 1 | $1,462 |
| #8 | 2 | 1 | $1,462 |
| #9 | 2 | 1 | $1,462 |
| #10 | 2 | 1 | $1,462 |
| #11 | 2 | 1 | $1,462 |
| #12 | 2 | 1 | $1,462 |
| #13 | 2 | 1 | $1,462 |
| #14 | 2 | 1 | $1,462 |
| #15 | 2 | 1 | $1,462 |
| #16 | 2 | 1 | $1,462 |
| #17 | 2 | 1 | $1,462 |
| #18 | 2 | 1 | $1,462 |
| #19 | 2 | 1 | $1,462 |
| #20 | 2 | 1 | $1,462 |
| 40× units | 1 | 1 | $48,240 |
| #21 | 1 | 1 | $1,206 |
| #22 | 1 | 1 | $1,206 |
| #23 | 1 | 1 | $1,206 |
| #24 | 1 | 1 | $1,206 |
| #25 | 1 | 1 | $1,206 |
| #26 | 1 | 1 | $1,206 |
| #27 | 1 | 1 | $1,206 |
| #28 | 1 | 1 | $1,206 |
| #29 | 1 | 1 | $1,206 |
| #30 | 1 | 1 | $1,206 |
| #31 | 1 | 1 | $1,206 |
| #32 | 1 | 1 | $1,206 |
| #33 | 1 | 1 | $1,206 |
| #34 | 1 | 1 | $1,206 |
| #35 | 1 | 1 | $1,206 |
| #36 | 1 | 1 | $1,206 |
| #37 | 1 | 1 | $1,206 |
| #38 | 1 | 1 | $1,206 |
| #39 | 1 | 1 | $1,206 |
| #40 | 1 | 1 | $1,206 |
| #41 | 1 | 1 | $1,206 |
| #42 | 1 | 1 | $1,206 |
| #43 | 1 | 1 | $1,206 |
| #44 | 1 | 1 | $1,206 |
| #45 | 1 | 1 | $1,206 |
| #46 | 1 | 1 | $1,206 |
| #47 | 1 | 1 | $1,206 |
| #48 | 1 | 1 | $1,206 |
| #49 | 1 | 1 | $1,206 |
| #50 | 1 | 1 | $1,206 |
| #51 | 1 | 1 | $1,206 |
| #52 | 1 | 1 | $1,206 |
| #53 | 1 | 1 | $1,206 |
| #54 | 1 | 1 | $1,206 |
| #55 | 1 | 1 | $1,206 |
| #56 | 1 | 1 | $1,206 |
| #57 | 1 | 1 | $1,206 |
| #58 | 1 | 1 | $1,206 |
| #59 | 1 | 1 | $1,206 |
| #60 | 1 | 1 | $1,206 |
| Total (60 units) | $77,460 | ||
UW: 25.0% down · 7.5% · 30yr · 1.5% tax · 5.0% vac · 8.0% maint · 8.0% mgmt
Financing live
Cash to close
- Down payment
- $1,470,000
- Closing costs
- $176,400
- Reserves months
- —
- Total cash needed
- —
Loan-product check · same deal, 3 products live
Conventional
25% down · 7.5% · 30yr
- Down + closing
- —
- Monthly P&I
- —
- Monthly cashflow
- —
- DSCR
- —
- Eligible?
- —
Personal DTI + credit; lowest rate.
DSCR
20% down · 8.5% · 30yr
- Down + closing
- —
- Monthly P&I
- —
- Monthly cashflow
- —
- DSCR
- —
- Eligible?
- —
No personal income docs; deal must DSCR.
Hard money
10% down · 12.0% · 12mo
- Down + closing
- —
- Monthly P&I
- —
- Monthly cashflow
- —
- DSCR
- —
- Eligible?
- —
Short-term bridge; refi at stabilization.
Listing history 12 events
-
2026-06-18days on market $5,880,000 Active 16 DOM
-
2026-06-17days on market $5,880,000 Active 15 DOM
-
2026-06-16days on market $5,880,000 Active 14 DOM
-
2026-06-15days on market $5,880,000 Active 13 DOM
-
2026-06-13days on market $5,880,000 Active 11 DOM
-
2026-06-09days on market $5,880,000 Active 7 DOM
-
2026-06-08days on market $5,880,000 Active 6 DOM
-
2026-06-07pricedays on market $5,880,000 Active 5 DOM
-
2026-06-04remarks 699-char remark
-
2026-06-04pricedays on market $1,960,000 Active 3 DOM
-
2026-06-03remarks 695-char remark
-
2026-06-03$5,880,000 Active 1 DOM
ⓘ Source: listings_history table (triggers on properties + properties_extension) + one-shot
backfill from property_details.listing_events for pre-trigger history.
Nearby sold comps map
Loading sold comps map…
Walkable amenities ~0.75 mi
Loading nearby amenities…
Taxation est. · year 1
- Rental income
- $929,520
- − Mortgage interest
- −$329,371
- − Property taxes
- −$88,200
- − Insurance
- −$29,400
- − Repairs & maintenance
- −$74,362
- − Management
- −$74,362
- − Depreciation
- −$171,055
- Taxable income
- $162,771
- Est. tax owed @ 24.0%
- −$39,065
- After-tax cash flow
- $207,631/yr
For passive investors: Depreciation is non-cash, so a rental often shows a tax loss while cash-flowing — sheltering income. Rental losses are passive: they offset passive income freely, and up to $25,000/yr can offset ordinary (W-2) income if you actively participate and your MAGI is under $100k (phasing out to $0 by $150k); unused losses carry forward. On sale, claimed depreciation is recaptured at up to 25%, and gains may owe capital-gains tax (a 1031 exchange can defer both). Figures are a year-1 estimate at your 24.0% rate — not tax advice; consult a CPA.
Condition & rehab AI · 12 photos
This multi-family property is in good condition with cosmetic updates needed to modernize the kitchen and bathrooms, and replace the flooring. The property has a good curb appeal and is located in a desirable residential neighborhood.
Repairs flagged
- Minor kitchen cabinets — dated and could be replaced
- Minor bathroom cabinets — dated and could be replaced
- Minor flooring — basic carpeting could be upgraded
Value-add opportunities
- Both modernize kitchen and bathrooms — modernizing these areas would appeal to both buyers and renters
- Both replace flooring — upgrading the flooring would improve the overall appearance and appeal
- Both paint interior walls — painting the interior walls would improve the overall appearance and appeal
Renovation cost estimate screening
| Repair item | Severity | Est. cost |
|---|---|---|
| kitchen cabinets · dated and could be replaced | Minor | $500–3,000 |
| bathroom cabinets · dated and could be replaced | Minor | $500–3,000 |
| flooring · basic carpeting could be upgraded | Minor | $500–3,000 |
| Total estimated repair cost · 3 items | $1,500–9,000 |
Value-add ROI direction
- Both modernize kitchen and bathrooms — modernizing these areas would appeal to both buyers and renters ↑
- Both replace flooring — upgrading the flooring would improve the overall appearance and appeal ↑
- Both paint interior walls — painting the interior walls would improve the overall appearance and appeal ↑
ⓘ Cost ranges are severity-bucket heuristics (US national rule-of-thumb). Get contractor quotes + a written scope before underwriting a rehab budget.
Schools (NCES district)
- District
- Chsd 218
- NCES district ID
- 1706540
- Math proficiency
- 14% ▼ -4.00%
- Reading proficiency
- 20% ▼ -1.00%
- Median HH income
- $57,166
- Composite
- 16.09/100
- National rank
- #9235
- State rank
- #454 of 620 in IL
Livability — Calumet Park
- Score
- 72/100
- State rank
- #308
- US rank
- #6048
Category grades
Schools grade is shown separately in the Schools card above.
Census & demographics
- Census place
- Calumet Park, IL
- County
- Cook County · 4,486,803 people
- Metro
- Chicago-Naperville-Elgin, IL-IN-WI
- Population (ZIP)
- 24,713
- Household income
- $37,217
- Rent vs Own
- Severe rent burden
- 1868.0
Population outlook (Cook County) Hauer SSP2
- Today (2025)
- 5,347,519 people
- By 2030
- 5,357,703 · +0.2%
- By 2040
- 5,324,924 · -0.4%
- By 2050
- 5,230,762 · -2.2%
- By 2075
- 4,785,735 · -10.5%
- By 2100
- 4,188,836 · -21.7%
Race, ethnicity, and origin ACS 2023
- Neighborhood character
- Predominantly Black (88%)
- Race & ethnicity
- Black 88% Two or more races 5% Hispanic / Latino 5% White 2%
- Common ancestry
- Iranian 1%
- Foreign-born
- 2% · Canada
- Languages at home
- 96% English-only · Spanish 3%
Political lean MEDSL · Cook
- 2024 margin
- Solid D (+42.0) · D 70.4% · R 28.4% · Other 1.2%
- 2008→2024 swing
- -11.4pp toward R · 2008: 53.4pp · 2024: 42.0pp
- All cycles
- 2024: D+42.0 2020: D+50.3 2016: D+53.0 2012: D+49.4 2008: D+53.4
Not yet ingested
- Civics
- —
Market trends
- HPI YoY
- ▼ -76.39%
- Current HPI
- 163.7725
- Rent YoY
- ▲ 7.82%
- Metro
- Chicago-Naperville-Elgin, IL-IN-WI
- State GDP YoY
- ▲ 1.59%
- F500 in state
- 60
Industry mix (Fortune 500 HQ in IL)
| Industry | F500 HQs | Revenue |
|---|---|---|
| Insurance | 4 | $201B |
|
||
| Consumer Goods | 4 | $87B |
|
||
| Industrial Machinery | 3 | $64B |
|
||
| Healthcare | 2 | $55B |
|
||
| Retail / Pharmacy | 1 | $148B |
|
||
| Agriculture / Food | 1 | $86B |
|
||
Price history
21 events — show timeline
- 2026-06-01 Listed $5,880,000 MRED as Distributed by MLS Grid
- 2025-05-23 Listing Removed — MRED as Distributed by MLS Grid
- 2025-05-23 Relisted — MRED as Distributed by MLS Grid
- 2025-03-04 Listing Removed — MRED as Distributed by MLS Grid
- 2025-03-04 Relisted — MRED as Distributed by MLS Grid
- 2025-03-03 Listing Removed — MRED as Distributed by MLS Grid
- 2025-03-03 Relisted — MRED as Distributed by MLS Grid
- 2025-02-22 Listing Removed — MRED as Distributed by MLS Grid
- 2025-02-21 Relisted — MRED as Distributed by MLS Grid
- 2025-02-01 Listing Removed — MRED as Distributed by MLS Grid
- 2025-02-01 Relisted — MRED as Distributed by MLS Grid
- 2025-01-04 Listing Removed — MRED as Distributed by MLS Grid
- 2025-01-03 Relisted — MRED as Distributed by MLS Grid
- 2024-12-20 Listing Removed — MRED as Distributed by MLS Grid
- 2024-12-20 Relisted — MRED as Distributed by MLS Grid
- 2024-12-06 Listing Removed — MRED as Distributed by MLS Grid
- 2024-12-06 Relisted — MRED as Distributed by MLS Grid
- 2024-11-21 Listing Removed — MRED as Distributed by MLS Grid
- 2024-09-04 Listing Removed — MRED as Distributed by MLS Grid
- 2024-09-04 Listed — MRED as Distributed by MLS Grid
- 2024-07-18 Listed — MRED as Distributed by MLS Grid
Cash-flow waterfall
monthlySold comps — $/sqft
last 12 mo · ≤1 miLoading sold comps…