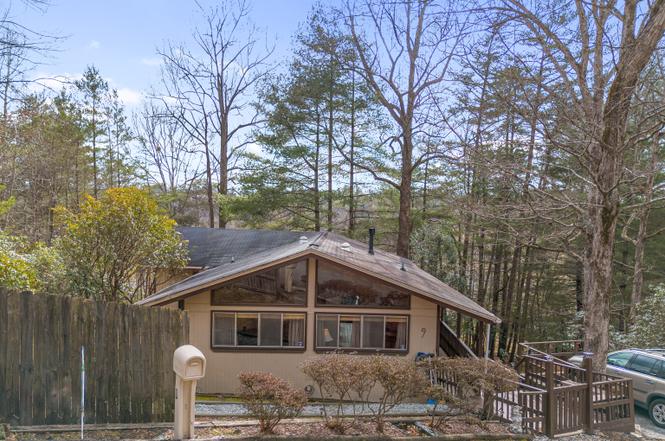
9 Golf Dr · Clayton, GA
Flood risk 1/10 · Minimal
- FEMA flood zone
- X (unshaded)
- Chance of flooding over 30 yrs
- 0.0%
- Est. flood insurance / yr
- $507 – $1,088
Fire risk 3/10 · Minor
- Est. fire insurance / yr
- $963 – $1,789
Heat risk 4/10 · Minor
- Hot days now (above 99°F)
- 7 days/yr
- Hot days in 30 yrs
- 19 days/yr
Wind risk 2/10 · Minimal
- Chance of severe wind over 30 yrs
- —
Air-quality risk 4/10 · Minor
- Unhealthy air days now
- 6 days/yr
- Unhealthy air days in 30 yrs
- 6 days/yr
Risk factors via First Street. Map © Google.
Why this score? — see what drove the D+ grade
The composite is a weighted blend of 9 inputs, each scored 0–100. Each bar is that input's sub-score; the figure is the points it added to the 100-point composite (weight × sub-score).
- ARV discount +12.7/15.0
- Cash flow +10.7/30.0
- Appreciation +5.3/10.0
- Schools +3.6/10.0
- Livability +3.3/5.0
- DSCR +3.1/10.0
- Rent growth +2.5/5.0
- Condition / age +2.5/5.0
- 1% rule +1.9/10.0
$260,000
🖨 Deal sheet 📄 Offer letter ✓ Due diligence
Listing remarks MLS
Completely renovated 3BR/2BA home with new hardwood floors, new granite in kitchen & baths located convenient to Clayton & walking distance to Rabun County Golf Course. This home is situated on two lots with an adjoining lot included (Lot 8,9 & 10). Partial basement with new bath & extra living area. Ready to move right in. Also has dual heat system -gas & electric.
Key facts
- Massive storage
- Huge kitchen sink
- Granite countertops
Tags
Neighborhood map
What this means for you Summary
Snapshot
- This is a 3-bed/3.0-bath single-family listed at $260k.
Deal economics
- At list price, monthly cash flow is $-123 ($-1k/yr) — negative.
- To cash-flow at today's rent, offer at most $238k (8.4% below list).
- To meet the 1% rule (rent ≥ 1% of price), the offer needs to be $180k (30.8% below list).
- Recommended offer: $180k (30.8% below list) — sets the bar for 1% rule.
- Cap rate 5.7% vs local median 3.6% in Clayton — top-decile yield for the area; either an underpriced asset or a hidden risk that comps aren't pricing in. Stress-test before assuming the spread holds.
Location & tenants
- Location reads 66/100 on livability (#197 in GA) — a middle-class / working-renter tenant base. Strengths: cost of living A+, health & safety A+, housing B+; Watch: crime D, schools F, amenities F.
- Rabun County (rural): math 42% / reading 44% proficiency, ranked #37 of 174 in GA (top 21%) — families likely to look elsewhere, expect single-tenant / working-renter base with shorter leases.
- Market conditions: 256 active listings in the ZIP; 1 comparable units currently listed for rent nearby; 147 units permitted in Rabun County in 2024 (0 in 5+ unit buildings).
Forward outlook
- In year one you build about $4k of equity ($2k loan paydown + $2k appreciation (0.7% local appreciation)).
- Rabun County population projected at -14% by 2050 — secular population decline; favor cash flow + early exit over multi-decade hold.
- By year 9, paydown + projected appreciation supports a ~$34k cash-out refi (75% LTV) — recoverable capital for the next deal without selling this one.
Negotiation context
- It's been on market 88 days — a 6% lower offer ($244k) is reasonable based on typical stale-listing flexibility.
- 5 sale attempts since 14y ago; this cycle's ask has dropped $25k (9%) from the opening price — seller is motivated, your offer sets the floor, not the list.
- Current owner paid $118k; list at $260k implies a 120% gain — meaningful room to come down on a strong offer.
Questions for the listing agent
- What do current leases actually rent for vs. the listed asking? Can we see a recent rent roll and the last 12 months of T-12 income?
- It's been on market 88 days. Have you received any prior offers? Is the seller open to a 31% concession, seller financing, or rate buy-down credit?
- Built in 1973 — when were the roof, HVAC, electrical panel, plumbing, and water heater last replaced?
- Why hasn't it sold? Are there any deal-killer items the seller is aware of (foundation, flood, title, zoning, code violations)?
- Is there a deadline driving the sale (1031 exchange, divorce, estate, relocation)? That informs how much negotiation room exists.
- Schools are F-rated, which usually means shorter tenancies and higher turnover. Who's the typical renter profile here, and what's been the actual vacancy rate?
- Crime grade is D in this area — have there been break-ins, vandalism, or insurance claims at this property in the last 3 years? What carrier currently insures it and at what premium?
- The area grade is low — what's the realistic commute time and amenity access for the typical tenant pool here? Any planned neighborhood developments (good or bad) we should know about?
- What's the average days-on-market for RENTAL listings here right now (not sales)? A rising rental-DOM trend means longer vacancies and softer asking-rent achievability than the comps imply.
- What's the recent tenant-quality profile in this submarket — average credit score on applications, eviction rate, late-payment / NSF rate, and stable-employment percentage? A property-management company in the area should have these aggregated.
- How much new for-sale + rental construction is in the pipeline within 1–3 miles? Heavy new supply typically softens prices + rents 12–24 months out; constrained supply supports both.
Investment metrics
- 1% rule
- 0.69% ✗
- Cap rate
- 5.72%
- Cash-on-cash
- -2.03%
- DSCR
- 0.91
- GRM
- 12.0
CMA / ARV
- ARV (on-the-fly)
- $293,724
- Comps found
- 12
Show comp detail 12 sales within ~0.75 mi
| Address | Dist | Beds/Ba | Sqft | Sold | Price | $/sf | Match |
|---|---|---|---|---|---|---|---|
| 164 Colorado Ln | 0.38mi | 3/2.0 | 1,500 (+2%) | 12mo | $370,000 | $247 | 65 |
| 247 Hillside Dr | 0.08mi | 2/1.0 (-1) | 1,408 (-5%) | 14mo | $197,500 | $140 | 64 |
| 60 Mitchell St | 0.51mi | 3/2.0 | 1,440 (-2%) | 6mo | $240,000 | $167 | 63 |
| 345 Leaning Chimney Dr | 0.34mi | 3/2.0 | 1,581 (+7%) | 11mo | $440,000 | $278 | 60 |
| 167 Travelers Ln | 0.68mi | 3/2.0 | 1,440 (-2%) | 4mo | $299,000 | $208 | 57 |
| 106 Dunlap St | 0.51mi | 2/3.0 (-1) | 1,407 (-5%) | 9mo | $140,000 | $100 | 56 |
| 1627 Old 441 S | 0.40mi | 3/2.0 | 1,352 (-8%) | 14mo | $230,000 | $170 | 51 |
| 104 Travelers Ln | 0.65mi | 3/2.0 | 1,536 (+4%) | 12mo | $157,500 | $103 | 49 |
| 51 Travelers | 0.73mi | 3/2.0 | 1,500 (+2%) | 21mo | $298,350 | $199 | 42 |
| 152 Toole St | 0.64mi | 3/2.0 | 1,296 (-12%) | 15mo | $135,000 | $104 | 34 |
| 172 Toole St | 0.61mi | 3/2.0 | 1,293 (-12%) | 17mo | $327,000 | $253 | 33 |
| 633 Highway 441 | 0.73mi | 3/2.0 | 1,600 (+8%) | 20mo | $410,000 | $256 | 31 |
Match score weights: distance 35% · size 25% · config 20% · recency 20%. Top-matched comps best support the ARV.
Projected returns pro-forma
0.68% appreciation · 3.0% rent growth · sell at horizon
- IRR
- -2.0%
- Equity multiple
- 0.90×
- Total profit
- $-7,179
- Equity at exit
- $84,424
- IRR
- 3.2%
- Equity multiple
- 1.37×
- Total profit
- $27,012
- Equity at exit
- $108,912
Cash invested: $72,800 (down + closing). Projections, not guarantees.
Landlord ↔ Tenant lean methodology
- Overall (STATE)
- 90 Strongly Landlord-Friendly
- State Georgia
- 90 Strongly Landlord-Friendly · R+3
- County
- — inherits STATE
- City
- — inherits STATE
ZIP-level market 30525
- Home prices YoY
- 0.2%
- Active inventory
- 256
- Price-to-rent
- 12.0×
Monthly cashflow live
- Estimated rent
- $1,800 medium interval (Pro) →
- Mortgage (P&I)
- −$1,363
- Tax from tax record
- −$73 /mo · $879/yr
- Insurance
- −$108
- HOA
- −$0
- Vacancy / Maint / Mgmt
- −$378
- Net cashflow
- $-123
Break-even live
UW: 25.0% down · 7.5% · 30yr · 1.5% tax · 5.0% vac · 8.0% maint · 8.0% mgmt
Financing live
Cash to close
- Down payment
- $65,000
- Closing costs
- $7,800
- Reserves months
- —
- Total cash needed
- —
Loan-product check · same deal, 3 products live
Conventional
25% down · 7.5% · 30yr
- Down + closing
- —
- Monthly P&I
- —
- Monthly cashflow
- —
- DSCR
- —
- Eligible?
- —
Personal DTI + credit; lowest rate.
DSCR
20% down · 8.5% · 30yr
- Down + closing
- —
- Monthly P&I
- —
- Monthly cashflow
- —
- DSCR
- —
- Eligible?
- —
No personal income docs; deal must DSCR.
Hard money
10% down · 12.0% · 12mo
- Down + closing
- —
- Monthly P&I
- —
- Monthly cashflow
- —
- DSCR
- —
- Eligible?
- —
Short-term bridge; refi at stabilization.
Rent comps 1 comps
| Address | Beds | Baths | Sqft | Rent | $/sqft | DOM | Units | Dist |
|---|---|---|---|---|---|---|---|---|
| 37 Bynum St Clayton, GA | 1.0–2.0 | 1.0–2.0 | 890 | $1,800 | $2.02 | 3d | 6 | 1.09mi |
Listing history 16 events
-
2026-04-28status Under Contract
-
2026-03-30price $260,000
-
2026-01-30$285,000 New
-
2026-01-28historical
-
2025-12-11price $295,000
-
2025-10-10price $299,900
-
2025-07-29status Back On Market
-
2025-07-28historical
-
2025-07-22price $309,000
-
2025-06-04price $314,000
-
2025-01-24$319,000 New
-
2016-10-17soldstatus $118,000
-
2016-10-14soldstatus $118,000 388-char remark
Show marketing remark (388 chars)
Completely renovated 3BR/2BA home with new hardwood floors, new granite in kitchen & baths located convenient to Clayton & walking distance to Rabun County Golf Course. This home is situated on two lots with an adjoining lot included (Lot 8,9 & 10). Partial basement with new bath & extra living area. Ready to move right in. Also has dual heat system -gas & electric.
-
2016-03-14$119,900 388-char remark
Show marketing remark (388 chars)
Completely renovated 3BR/2BA home with new hardwood floors, new granite in kitchen & baths located convenient to Clayton & walking distance to Rabun County Golf Course. This home is situated on two lots with an adjoining lot included (Lot 8,9 & 10). Partial basement with new bath & extra living area. Ready to move right in. Also has dual heat system -gas & electric.
-
2013-10-31historical
-
2012-11-20$128,500
ⓘ Source: listings_history table (triggers on properties + properties_extension) + one-shot
backfill from property_details.listing_events for pre-trigger history.
Tax reassessment forecast GA · Resets to sale price
- Current annual tax
- $879 · $73/mo
- Projected year-2 tax
- $2,392 · $199/mo
- Expected delta
- +$1,513/yr (+$126/mo · 172.1%)
ⓘ Screening estimate from a state-policy table — verify with the county assessor before closing.
Climate risk First Street
- Flood 1/10 Low FEMA zone X (unshaded) · 0% chance over 30 yrs
- Wildfire 3/10 Moderate
- Heat 4/10 Moderate 7 d/yr ≥99°F today · 19 d/yr by 30 yrs out
- Wind 2/10 Low
- Air quality 4/10 Moderate 6 unhealthy d/yr today · 6 by 30 yrs out
Nearby sold comps map
Loading sold comps map…
Walkable amenities ~0.75 mi
Loading nearby amenities…
Taxation est. · year 1
- Rental income
- $21,600
- − Mortgage interest
- −$14,564
- − Property taxes
- −$879
- − Insurance
- −$1,300
- − Repairs & maintenance
- −$1,728
- − Management
- −$1,728
- − Depreciation
- −$7,564
- Taxable loss
- −$6,163
- Est. tax savings @ 24.0%
- +$1,479
- After-tax cash flow
- $2/yr
For passive investors: Depreciation is non-cash, so a rental often shows a tax loss while cash-flowing — sheltering income. Rental losses are passive: they offset passive income freely, and up to $25,000/yr can offset ordinary (W-2) income if you actively participate and your MAGI is under $100k (phasing out to $0 by $150k); unused losses carry forward. On sale, claimed depreciation is recaptured at up to 25%, and gains may owe capital-gains tax (a 1031 exchange can defer both). Figures are a year-1 estimate at your 24.0% rate — not tax advice; consult a CPA.
Schools (NCES district)
- District
- Rabun County
- NCES district ID
- 1304320
- Math proficiency
- 42% ▼ -17.00%
- Reading proficiency
- 44% ▼ -4.00%
- Median HH income
- $35,980
- Composite
- 35.64/100
- National rank
- #4882
- State rank
- #37 of 174 in GA
Livability — Clayton
- Score
- 66/100
- State rank
- #197
- US rank
- #12208
Category grades
Schools grade is shown separately in the Schools card above.
Census & demographics
- Population (ZIP)
- 7,265
Population outlook (Rabun County) Hauer SSP2
- Today (2025)
- 16,227 people
- By 2030
- 16,000 · -1.4%
- By 2040
- 15,213 · -6.2%
- By 2050
- 13,974 · -13.9%
- By 2075
- 10,717 · -34.0%
- By 2100
- 7,824 · -51.8%
Race, ethnicity, and origin ACS 2023
- Neighborhood character
- Predominantly White (88%)
- Race & ethnicity
- White 88% Hispanic / Latino 8% Two or more races 8%
- Hispanic origin (detail)
- Mexican 7%
- Common ancestry
- Serbian 4% Slovak 3% Romanian 2%
- Foreign-born
- 5% · Canada
- Languages at home
- 91% English-only · Spanish 8% Other Indo-European 1%
Political lean MEDSL · Rabun
- 2024 margin
- Solid R (+56.9) · D 21.3% · R 78.2%
- 2008→2024 swing
- -11.0pp toward R · 2008: -45.9pp · 2024: -56.9pp
- All cycles
- 2024: R+56.9 2020: R+57.4 2016: R+60.9 2012: R+56.4 2008: R+45.9
Not yet ingested
- Civics
- —
Market trends
- HPI YoY
- ▲ 0.68%
- Current HPI
- 310.5456
- Rent YoY
- —
- Metro
- —
- State GDP YoY
- ▲ 2.66%
- F500 in state
- 28
Industry mix (Fortune 500 HQ in GA)
| Industry | F500 HQs | Revenue |
|---|---|---|
| Paper / Packaging | 2 | $29B |
|
||
| Retail | 1 | $160B |
|
||
| Transportation / Logistics | 1 | $91B |
|
||
| Airlines | 1 | $62B |
|
||
| Consumer Goods | 1 | $47B |
|
||
| Utilities | 1 | $25B |
|
||
Price history
+102.3% since first listed16 events — show timeline
- 2026-04-28 Pending — GAMLS
- 2026-03-30 Price Changed $260,000 GAMLS
- 2026-01-30 Listed $285,000 GAMLS
- 2026-01-28 Listing Removed — GAMLS
- 2025-12-11 Price Changed $295,000 GAMLS
- 2025-10-10 Price Changed $299,900 GAMLS
- 2025-07-29 Relisted — GAMLS
- 2025-07-28 Listing Removed — GAMLS
- 2025-07-22 Price Changed $309,000 GAMLS
- 2025-06-04 Price Changed $314,000 GAMLS
- 2025-01-24 Listed $319,000 GAMLS
- 2016-10-17 Sold (Public Records) $118,000 Public Records
- 2016-10-14 Sold (MLS) $118,000 GAMLS
- 2016-03-14 Listed $119,900 GAMLS
- 2013-10-31 Listing Removed — GAMLS
- 2012-11-20 Listed $128,500 GAMLS
Property tax history
+3.5%/yrLatest (2025): $879 · +22.5% YoY. Source: county tax records.
Cash-flow waterfall
monthlySold comps — $/sqft
last 12 mo · ≤1 miLoading sold comps…