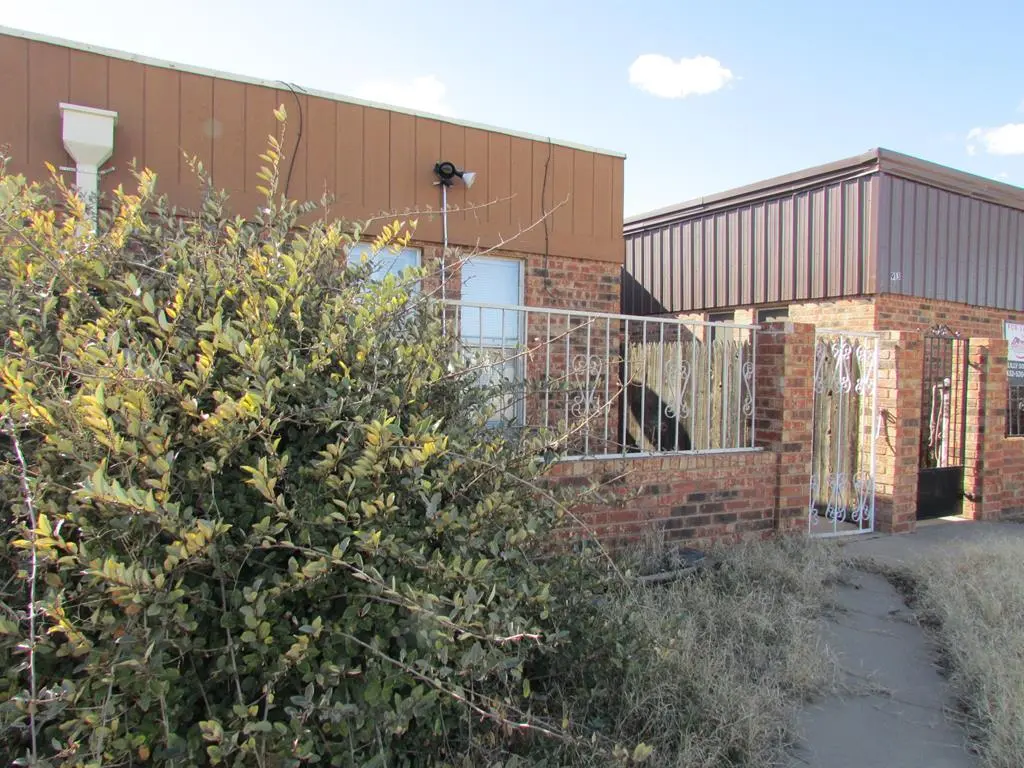
911 N Kelly Ave · Odessa, TX
Flood risk 6/10 · Moderate
- FEMA flood zone
- AE
- Chance of flooding over 30 yrs
- 0.71%
- Est. flood insurance / yr
- $1,737 – $8,500
Fire risk 7/10 · Major
- Est. fire insurance / yr
- $1,222 – $2,270
Heat risk 6/10 · Moderate
- Hot days now (above 102°F)
- 7 days/yr
- Hot days in 30 yrs
- 21 days/yr
Wind risk 2/10 · Minimal
- Chance of severe wind over 30 yrs
- 2.0%
Air-quality risk 1/10 · Minimal
- Unhealthy air days now
- 0 days/yr
- Unhealthy air days in 30 yrs
- 0 days/yr
Risk factors via First Street. Map © Google.
Why this score? — see what drove the C+ grade
The composite is a weighted blend of 9 inputs, each scored 0–100. Each bar is that input's sub-score; the figure is the points it added to the 100-point composite (weight × sub-score).
- Cash flow +30.0/30.0
- 1% rule +10.0/10.0
- DSCR +10.0/10.0
- Livability +3.8/5.0
- Rent growth +2.5/5.0
- Condition / age +2.5/5.0
- Schools +2.2/10.0
- ARV discount +1.7/15.0
- Appreciation +0.0/10.0
$109,000
🖨 Deal sheet 📄 Offer letter ✓ Due diligence
Key facts
- 2,962 sq ft lot
- 2 parking spots
- Built 1979
Neighborhood map
What this means for you Summary
Snapshot
- This is a 2-bed/2.0-bath townhouse listed at $109k.
Deal economics
- At list price, monthly cash flow is $240 ($3k/yr) — positive.
- The deal already cash-flows at list — no discount required.
- Meets the 1% rule at list price ($2k rent vs $109k).
- Recommended offer: $99k (9.0% below list) — sets the bar for market timing.
Location & tenants
- Location reads 75/100 on livability (#132 in TX, #3,928 nationally) — a middle-class / working-renter tenant base. Strengths: cost of living A+, housing A+, health & safety A+; Watch: commute D+, amenities D, schools F.
- Ector County ISD (urban): math 22% / reading 27% proficiency, ranked #707 of 826 in TX (top 86%) — low school quality limits family demand, transient renter base, plan for 1-2y turnover.
- Market conditions: 122 active listings in the ZIP; 16 comparable units currently listed for rent nearby; rentals at typical pace (median 21d on market — plan ~3-4 weeks tenant-placement turnaround); 1,004 units permitted in Ector County in 2024 (0 in 5+ unit buildings).
- This rent runs 38% of the median local income ($57k/yr) — at the standard rent-burdened threshold; future hikes will face affordability resistance.
Forward outlook
- Local home prices are declining (-3.0%/yr); year-one equity from $754 of loan paydown is wiped out by about $3k of value loss. Plan a longer hold.
- Ector County population projected at +78% by 2050 — long-run rental-demand tailwind backs the buy-and-hold thesis.
Negotiation context
- It's been on market 100 days — a 9% lower offer ($99k) is reasonable based on typical stale-listing flexibility.
Risks & watch-outs
- Watch-outs: flood insurance adds $427/mo.
- Climate carrying-cost: in FEMA flood zone AE (mandatory federal flood insurance); major wildfire risk; extreme-heat days projected 7→21/yr by 2055 (HVAC capex compounding) — expect insurance premiums to compound above CPI over the hold.
Questions for the listing agent
- It's been on market 100 days. Have you received any prior offers? Is the seller open to a 9% concession, seller financing, or rate buy-down credit?
- Built in 1979 — when were the roof, HVAC, electrical panel, plumbing, and water heater last replaced?
- What's the actual annual flood-insurance premium (NFIP or private), and is the property in a SFHA with mandatory coverage?
- Why hasn't it sold? Are there any deal-killer items the seller is aware of (foundation, flood, title, zoning, code violations)?
- Is there a deadline driving the sale (1031 exchange, divorce, estate, relocation)? That informs how much negotiation room exists.
- Schools are F-rated, which usually means shorter tenancies and higher turnover. Who's the typical renter profile here, and what's been the actual vacancy rate?
- What's the average days-on-market for RENTAL listings here right now (not sales)? A rising rental-DOM trend means longer vacancies and softer asking-rent achievability than the comps imply.
- What's the recent tenant-quality profile in this submarket — average credit score on applications, eviction rate, late-payment / NSF rate, and stable-employment percentage? A property-management company in the area should have these aggregated.
- How much new for-sale + rental construction is in the pipeline within 1–3 miles? Heavy new supply typically softens prices + rents 12–24 months out; constrained supply supports both.
Investment metrics
- 1% rule
- 1.64% ✓
- Cap rate
- 13.63%
- Cash-on-cash
- 26.22%
- DSCR
- 2.17
- GRM
- 5.1
CMA / ARV
- ARV (median comp)
- $96,613
- List price
- $109,000
- Delta
- 12.82%
- Verdict
- OVERPRICED
- Comps
- 3 within 1.0 mi
Projected returns pro-forma
-3.0% appreciation · 3.0% rent growth · sell at horizon
- IRR
- -1.8%
- Equity multiple
- 0.93×
- Total profit
- $-2,076
- Equity at exit
- $16,252
- IRR
- 8.1%
- Equity multiple
- 1.62×
- Total profit
- $19,048
- Equity at exit
- $9,424
Cash invested: $30,520 (down + closing). Projections, not guarantees.
Landlord ↔ Tenant lean methodology
- Overall (STATE)
- 87 Strongly Landlord-Friendly
- State Texas
- 87 Strongly Landlord-Friendly · R+5
- County
- — inherits STATE
- City
- — inherits STATE
ZIP-level market 79763
- Active inventory
- 122
- Price-to-rent
- 5.1×
Monthly cashflow live
- Estimated rent
- $1,786 high interval (Pro) →
- Mortgage (P&I)
- −$572
- Tax from tax record
- −$127 /mo · $1,521/yr
- Insurance
- −$45
- Flood insurance flood zone
- −$427 /mo · $5,118/yr
- HOA
- −$0
- Vacancy / Maint / Mgmt
- −$375
- Net cashflow
- $240
Break-even live
UW: 25.0% down · 7.5% · 30yr · 1.5% tax · 5.0% vac · 8.0% maint · 8.0% mgmt
Financing live
Cash to close
- Down payment
- $27,250
- Closing costs
- $3,270
- Reserves months
- —
- Total cash needed
- —
Loan-product check · same deal, 3 products live
Conventional
25% down · 7.5% · 30yr
- Down + closing
- —
- Monthly P&I
- —
- Monthly cashflow
- —
- DSCR
- —
- Eligible?
- —
Personal DTI + credit; lowest rate.
DSCR
20% down · 8.5% · 30yr
- Down + closing
- —
- Monthly P&I
- —
- Monthly cashflow
- —
- DSCR
- —
- Eligible?
- —
No personal income docs; deal must DSCR.
Hard money
10% down · 12.0% · 12mo
- Down + closing
- —
- Monthly P&I
- —
- Monthly cashflow
- —
- DSCR
- —
- Eligible?
- —
Short-term bridge; refi at stabilization.
Rent comps 16 comps
| Address | Beds | Baths | Sqft | Rent | $/sqft | DOM | Units | Dist |
|---|---|---|---|---|---|---|---|---|
| 715 N Kelly Ave Odessa, TX | 2.0 | 1.0 | 1170 | $2,000 | $1.71 | 21d | 1 | 0.14mi |
| 401 Lasseter Ave Odessa, TX | 1.0 | 1.0 | 900 | $950 | $1.06 | 21d | 1 | 0.40mi |
| 200 Santa Rita Dr Odessa, TX | 3.0 | 2.0 | 1438 | $2,400 | $1.67 | 43d | 1 | 0.59mi |
| 1101 W 19th St Unit 1 Odessa, TX | 1.0 | 1.0 | 700 | $1,000 | $1.43 | 43d | 1 | 0.77mi |
| 1318 Harless Ave Odessa, TX | 2.0 | 1.5 | 1200 | $1,600 | $1.33 | 21d | 1 | 0.81mi |
| 1322 Harless Ave Unit 1 Odessa, TX | 2.0 | 1.5 | 1200 | $1,700 | $1.42 | 43d | 1 | 0.81mi |
| 2439 W 15th St Odessa, TX | 3.0 | 2.0 | 1175 | $1,500 | $1.28 | 13d | 1 | 0.85mi |
| 1322 N Lincoln Ave Odessa, TX | 3.0 | 1.0 | 1218 | $2,200 | $1.81 | 43d | 1 | 0.92mi |
| 1322 N Lincoln Ave Odessa, TX | 3.0 | 1.0 | 1218 | $2,100 | $1.72 | 21d | 1 | 0.92mi |
| 1604 N Sam Houston Ave Odessa, TX | 2.0 | 1.0 | 1142 | $2,000 | $1.75 | 43d | 1 | 0.94mi |
| 2 Star Cir Odessa, TX | 3.0 | 2.0 | 1377 | $2,200 | $1.60 | 13d | 1 | 1.06mi |
| 1501 N Texas Ave Unit A Odessa, TX | 2.0 | 1.0 | 925 | $1,450 | $1.57 | 13d | 1 | 1.12mi |
| 1315 N Jackson Ave Odessa, TX | 3.0 | 2.0 | 1216 | $1,500 | $1.23 | 13d | 1 | 1.16mi |
| 1220 Adams Ave Unit 3 Odessa, TX | 3.0 | 1.0 | 895 | $1,450 | $1.62 | 43d | 1 | 1.48mi |
| 1015 Milburn Ave Unit A2CBUILDING A Odessa, TX | 3.0 | 1.0 | 895 | $1,450 | $1.62 | 21d | 1 | 1.49mi |
| 1015 Milburn Ave Unit A1DBuilding A Odessa, TX | 3.0 | 1.0 | 895 | $1,500 | $1.68 | 13d | 1 | 1.49mi |
Listing history 16 events
-
2026-06-19days on market $109,000 Active 100 DOM
-
2026-06-18days on market $109,000 Active 99 DOM
-
2026-06-17days on market $109,000 Active 98 DOM
-
2026-06-16days on market $109,000 Active 97 DOM
-
2026-06-15days on market $109,000 Active 96 DOM
-
2026-06-14days on market $109,000 Active 94 DOM
-
2026-06-13days on market $109,000 Active 93 DOM
-
2026-06-10days on market $109,000 Active 91 DOM
-
2026-06-09days on market $109,000 Active 90 DOM
-
2026-06-08days on market $109,000 Active 89 DOM
-
2026-06-07days on market $109,000 Active 88 DOM
-
2026-06-03days on market $109,000 Active 83 DOM
-
2026-06-01days on market $109,000 Active 82 DOM
-
2026-05-31days on market $109,000 Active 81 DOM
-
2026-05-30days on market $109,000 Active 80 DOM
-
2026-03-11$109,000 Active
ⓘ Source: listings_history table (triggers on properties + properties_extension) + one-shot
backfill from property_details.listing_events for pre-trigger history.
Tax reassessment forecast TX · Resets to sale price
- Current annual tax
- $1,521 · $127/mo
- Projected year-2 tax
- $1,995 · $166/mo
- Expected delta
- +$474/yr (+$39/mo · 31.1%)
ⓘ Screening estimate from a state-policy table — verify with the county assessor before closing.
Climate risk First Street
- Flood 6/10 Major FEMA zone AE · 71% chance over 30 yrs
- Wildfire 7/10 Severe
- Heat 6/10 Major 7 d/yr ≥102°F today · 21 d/yr by 30 yrs out
- Wind 2/10 Low 2% chance of damaging wind over 30 yrs
- Air quality 1/10 Low 0 unhealthy d/yr today · 0 by 30 yrs out
Nearby sold comps map
Loading sold comps map…
Walkable amenities ~0.75 mi
Loading nearby amenities…
Taxation est. · year 1
- Rental income
- $21,427
- − Mortgage interest
- −$6,106
- − Property taxes
- −$1,521
- − Insurance
- −$5,664
- − Repairs & maintenance
- −$1,714
- − Management
- −$1,714
- − Depreciation
- −$3,171
- Taxable income
- $1,537
- Est. tax owed @ 24.0%
- −$369
- After-tax cash flow
- $2,514/yr
For passive investors: Depreciation is non-cash, so a rental often shows a tax loss while cash-flowing — sheltering income. Rental losses are passive: they offset passive income freely, and up to $25,000/yr can offset ordinary (W-2) income if you actively participate and your MAGI is under $100k (phasing out to $0 by $150k); unused losses carry forward. On sale, claimed depreciation is recaptured at up to 25%, and gains may owe capital-gains tax (a 1031 exchange can defer both). Figures are a year-1 estimate at your 24.0% rate — not tax advice; consult a CPA.
Schools (NCES district)
- District
- Ector County ISD
- NCES district ID
- 4818000
- Math proficiency
- 22% ▼ -9.00%
- Reading proficiency
- 27% ▼ -4.00%
- Median HH income
- $52,740
- Composite
- 21.89/100
- National rank
- #8233
- State rank
- #707 of 826 in TX
Livability — Odessa
- Score
- 75/100
- State rank
- #132
- US rank
- #3928
Category grades
Schools grade is shown separately in the Schools card above.
Census & demographics
- Census place
- Odessa, TX
- County
- Ector County · 131,169 people
- City population
- 131,169
- Metro
- Odessa, TX
- Population (ZIP)
- 35,174
- Household income
- $56,877
- Rent vs Own
- Severe rent burden
- 842.0
Population outlook (Ector County) Hauer SSP2
- Today (2025)
- 212,765 people
- By 2030
- 241,962 · +13.7%
- By 2040
- 306,582 · +44.1%
- By 2050
- 379,755 · +78.5%
- By 2075
- 568,991 · +167.4%
- By 2100
- 709,829 · +233.6%
Race, ethnicity, and origin ACS 2023
- Neighborhood character
- Predominantly Hispanic (76%)
- Race & ethnicity
- Hispanic / Latino 76% Two or more races 24% White 19% Black 2%
- Hispanic origin (detail)
- Mexican 72%
- Common ancestry
- Lithuanian 1% Slovak 1%
- Foreign-born
- 22% · Canada
- Languages at home
- 39% English-only · Spanish 60%
Political lean MEDSL · Ector
- 2024 margin
- Solid R (+52.9) · D 23.2% · R 76.1%
- 2008→2024 swing
- -4.9pp toward R · 2008: -48.0pp · 2024: -52.9pp
- All cycles
- 2024: R+52.9 2020: R+47.8 2016: R+40.6 2012: R+48.9 2008: R+48.0
Not yet ingested
- Civics
- —
Market trends
- HPI YoY
- ▼ -213.81%
- Current HPI
- 254.9773
- Rent YoY
- —
- Metro
- Odessa, TX
- State GDP YoY
- ▲ 3.95%
- F500 in state
- 110
Industry mix (Fortune 500 HQ in TX)
| Industry | F500 HQs | Revenue |
|---|---|---|
| Energy | 16 | $1,198B |
|
||
| Technology | 5 | $198B |
|
||
| Engineering / Construction | 4 | $72B |
|
||
| Energy Services | 3 | $60B |
|
||
| Utilities | 3 | $41B |
|
||
| Healthcare | 2 | $330B |
|
||
Price history
1 event — show timeline
- 2026-03-11 Listed $109,000 ODMLS
Property tax history
+1.9%/yrLatest (2025): $1,521 · +13.5% YoY. Source: county tax records.
Cash-flow waterfall
monthlySold comps — $/sqft
last 12 mo · ≤1 miLoading sold comps…