None · North Lauderdale, FL
Flood risk 1/10 · Minimal
- FEMA flood zone
- X (shaded)
- Chance of flooding over 30 yrs
- 0.0%
- Est. flood insurance / yr
- $507 – $1,088
Fire risk 1/10 · Minimal
- Est. fire insurance / yr
- $947 – $1,759
Heat risk 9/10 · Severe
- Hot days now (above 106°F)
- 7 days/yr
- Hot days in 30 yrs
- 25 days/yr
Wind risk 10/10 · Severe
- Chance of severe wind over 30 yrs
- 99.0%
Air-quality risk 3/10 · Minor
- Unhealthy air days now
- 3 days/yr
- Unhealthy air days in 30 yrs
- 3 days/yr
Risk factors via First Street. Map © Google.
Why this score? — see what drove the C grade
The composite is a weighted blend of 9 inputs, each scored 0–100. Each bar is that input's sub-score; the figure is the points it added to the 100-point composite (weight × sub-score).
- Cash flow +22.3/30.0
- 1% rule +8.7/10.0
- ARV discount +7.5/15.0
- DSCR +7.1/10.0
- Schools +4.1/10.0
- Livability +3.8/5.0
- Condition / age +2.5/5.0
- Rent growth +2.3/5.0
- Appreciation +0.0/10.0
$199,000
🖨 Deal sheet 📄 Offer letter ✓ Due diligence
Listing remarks
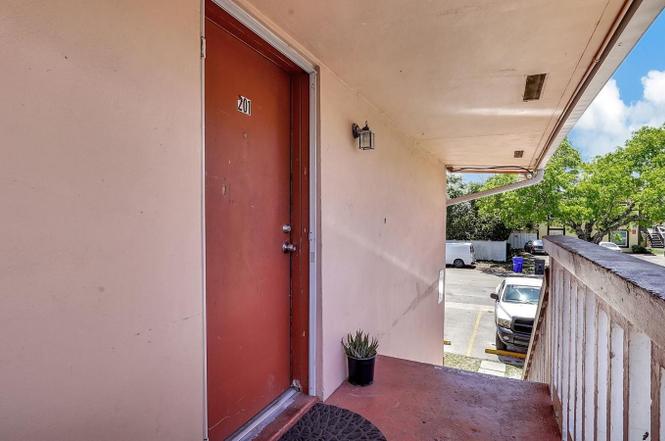
Well-maintained 3BR/2BA condo offering great value and generous living space. Ideal for first-time buyers or investors! Features include an updated kitchen, in-unit laundry and ample storage. Primary suite with en-suite bath and walk-in closet. Assigned parking, Convenient access to public transit, freeways, and local shopping. Tenant occupied, MUST HAVE 24- HOUR NOTICE-message listing agent day and time you want to show and allow time for response. Buyer to verify all HOA information and square footage. Seller is motivated - bring all reasonable offers!
Key facts
- In-unit laundry
- Updated kitchen
- Assigned parking
Tags
Property features AI
Finance
- HOA & community: Monthly HOA of $450 (includes grounds maintenance); Association amenities: Other; Pets allowed with limits
Exterior
- Security: Other security features
- Utilities: Has heating; Has cooling
- Home design: Condominium; Resale property; Faces west; 2 total stories
- Construction: Block/CBS construction
- Exterior features: Not waterfront
Interior
- Kitchen: Disposal; Dishwasher; Refrigerator
- Bedrooms: 3 bedrooms on the main level
- Flooring: Tile flooring
- Bathrooms: 2 full bathrooms on the main level
- Heating & cooling: Central heating; Central air conditioning
- Interior features: Walk-in closets
Neighborhood map
What this means for you Summary
Snapshot
- This is a 3-bed/2.0-bath condo listed at $199k.
Deal economics
- At list price, monthly cash flow is $328 ($4k/yr) — positive.
- The deal already cash-flows at list — no discount required.
- Meets the 1% rule at list price ($3k rent vs $199k).
- Recommended offer: $181k (9.0% below list) — sets the bar for market timing.
- Cap rate 8.3% vs local median 4.3% in North Lauderdale — top-decile yield for the area; either an underpriced asset or a hidden risk that comps aren't pricing in. Stress-test before assuming the spread holds.
Location & tenants
- Location reads 76/100 on livability (#230 in FL, #3,635 nationally) — a middle-class / working-renter tenant base. Strengths: housing A+, health & safety A+, cost of living A; Watch: commute C-, employment D, amenities F.
- Broward (suburban): math 42% / reading 53% proficiency, ranked #46 of 73 in FL (top 63%) — families likely to look elsewhere, expect single-tenant / working-renter base with shorter leases.
- Market conditions: Rents soft (-0.7%/yr); 298 active listings in the ZIP; 40 comparable units currently listed for rent nearby; rentals at typical pace (median 24d on market — plan ~3-4 weeks tenant-placement turnaround); 2,111 units permitted in Broward County in 2024 (1,265 in 5+ unit buildings).
- At $2,726/mo this rent would consume 51% of the median local household income ($64k/yr) (locally 3073% of renters already pay >50% of income on rent) — very limited rent-growth headroom before tenants either downsize or default.
Forward outlook
- Local home prices are declining (-3.0%/yr); year-one equity from $1k of loan paydown is wiped out by about $6k of value loss. Plan a longer hold.
- Broward County population projected at +34% by 2050 — long-run rental-demand tailwind backs the buy-and-hold thesis.
Negotiation context
- It's been on market 99 days — a 9% lower offer ($181k) is reasonable based on typical stale-listing flexibility.
Risks & watch-outs
- Climate carrying-cost: severe wind risk, 99% chance of damaging wind over 30y; extreme-heat days projected 7→25/yr by 2055 (HVAC capex compounding) — expect insurance premiums to compound above CPI over the hold.
Questions for the listing agent
- It's been on market 99 days. Have you received any prior offers? Is the seller open to a 9% concession, seller financing, or rate buy-down credit?
- Built in 1971 — when were the roof, HVAC, electrical panel, plumbing, and water heater last replaced?
- What does the HOA fee cover, when was the last increase, and are there any pending special assessments or reserve-fund shortfalls?
- Any open or pending special assessments — roof, HVAC, plumbing, elevator, façade? What's the per-unit balance and payoff schedule, and is the seller paying it off at close or rolling it to the buyer?
- Why hasn't it sold? Are there any deal-killer items the seller is aware of (foundation, flood, title, zoning, code violations)?
- Is there a deadline driving the sale (1031 exchange, divorce, estate, relocation)? That informs how much negotiation room exists.
- What's the average days-on-market for RENTAL listings here right now (not sales)? A rising rental-DOM trend means longer vacancies and softer asking-rent achievability than the comps imply.
- What's the recent tenant-quality profile in this submarket — average credit score on applications, eviction rate, late-payment / NSF rate, and stable-employment percentage? A property-management company in the area should have these aggregated.
- How much new apartment / multifamily construction is in the pipeline within 1–3 miles? Heavy new supply (>2% of stock underway) typically softens rents 12–24 months out; light construction supports rent growth.
Investment metrics
- 1% rule
- 1.37% ✓
- Cap rate
- 8.27%
- Cash-on-cash
- 7.07%
- DSCR
- 1.31
- GRM
- 6.1
CMA / ARV
No comps found within radius.
Projected returns pro-forma
-3.0% appreciation · 0.0% rent growth · sell at horizon
- IRR
- -9.7%
- Equity multiple
- 0.66×
- Total profit
- $-19,019
- Equity at exit
- $29,672
- IRR
- -6.5%
- Equity multiple
- 0.65×
- Total profit
- $-19,232
- Equity at exit
- $17,206
Cash invested: $55,720 (down + closing). Projections, not guarantees.
Landlord ↔ Tenant lean methodology
- Overall (STATE)
- 87 Strongly Landlord-Friendly
- State Florida
- 87 Strongly Landlord-Friendly · R+3
- County
- — inherits STATE
- City
- — inherits STATE
ZIP-level market 33068
- Rents YoY
- -0.7%
- Active inventory
- 298
- Price-to-rent
- 6.1×
Monthly cashflow live
- Estimated rent
- $2,726 high interval (Pro) →
- Mortgage (P&I)
- −$1,044
- Tax est. 1.5%
- −$249 /mo · $2,985/yr
- Insurance
- −$83
- HOA
- −$450
- Vacancy / Maint / Mgmt
- −$572
- Net cashflow
- $328
Break-even live
UW: 25.0% down · 7.5% · 30yr · 1.5% tax · 5.0% vac · 8.0% maint · 8.0% mgmt
Financing live
Cash to close
- Down payment
- $49,750
- Closing costs
- $5,970
- Reserves months
- —
- Total cash needed
- —
Loan-product check · same deal, 3 products live
Conventional
25% down · 7.5% · 30yr
- Down + closing
- —
- Monthly P&I
- —
- Monthly cashflow
- —
- DSCR
- —
- Eligible?
- —
Personal DTI + credit; lowest rate.
DSCR
20% down · 8.5% · 30yr
- Down + closing
- —
- Monthly P&I
- —
- Monthly cashflow
- —
- DSCR
- —
- Eligible?
- —
No personal income docs; deal must DSCR.
Hard money
10% down · 12.0% · 12mo
- Down + closing
- —
- Monthly P&I
- —
- Monthly cashflow
- —
- DSCR
- —
- Eligible?
- —
Short-term bridge; refi at stabilization.
Rent comps 40 comps
| Address | Beds | Baths | Sqft | Rent | $/sqft | DOM | Units | Dist |
|---|---|---|---|---|---|---|---|---|
| 1213 SW 74th Ave North Lauderdale, FL | 4.0 | 2.0 | 1150 | $4,100 | $3.57 | 24d | 1 | 0.16mi |
| 7431 Tam Oshanter Blvd Unit 7431 North Lauderdale, FL | 2.0 | 1.5 | 816 | $2,350 | $2.88 | 5d | 1 | 0.17mi |
| 7431 Tam Oshanter Blvd Unit 7431 North Lauderdale, FL | 2.0 | 1.5 | 816 | $2,100 | $2.57 | 16d | 1 | 0.17mi |
| 1001 SW 74th Ave Unit 201a North Lauderdale, FL | 3.0 | 2.0 | 1150 | $2,650 | $2.30 | 5d | 1 | 0.18mi |
| 7400 Kimberly Blvd Unit 202A North Lauderdale, FL | 3.0 | 2.0 | 1150 | $2,800 | $2.43 | 7d | 1 | 0.23mi |
| 7480 SW 10th Ct #1 North Lauderdale, FL | 3.0 | 2.0 | 1200 | $3,249 | $2.71 | 24d | 1 | 0.24mi |
| 881 SW 74th Ter Unit 102C North Lauderdale, FL | 3.0 | 2.0 | 1150 | $2,200 | $1.91 | 24d | 1 | 0.33mi |
| 861 SW 74th Ter Unit 102D North Lauderdale, FL | 3.0 | 2.0 | 1150 | $2,100 | $1.83 | 24d | 1 | 0.34mi |
| 7336 SW 8th Ct #6 North Lauderdale, FL | 2.0 | 2.0 | 1056 | $2,100 | $1.99 | 24d | 1 | 0.36mi |
| 6533 Harbour Rd North Lauderdale, FL | 4.0 | 2.0 | 1180 | $3,850 | $3.26 | 24d | 1 | 0.42mi |
| 6551 Boulevard of Champions #6551 North Lauderdale, FL | 4.0 | 2.5 | 1472 | $2,600 | $1.77 | 24d | 1 | 0.45mi |
| 6551 Boulevard of Champions #6551 North Lauderdale, FL | 4.0 | 2.5 | 1472 | $2,600 | $1.77 | 7d | 1 | 0.45mi |
| 7603 Kimberly Blvd North Lauderdale, FL | 3.0 | 2.0 | 1145 | $2,875 | $2.51 | 24d | 1 | 0.48mi |
| 1400 Avon Ln North Lauderdale, FL | 1.0–3.0 | 1.0–2.0 | 1070 | $2,876 | $2.69 | 1d | 58 | 0.53mi |
| 6897 SW 7th St Margate, FL | 2.0 | 1.0 | 827 | $1,895 | $2.29 | 16d | 1 | 0.55mi |
| 7701 SW 10th Ct Unit 1A North Lauderdale, FL | 3.0 | 1.0 | 1060 | $2,350 | $2.22 | 13d | 1 | 0.55mi |
| 6891 SW 7th St Margate, FL | 2.0 | 1.0 | 827 | $1,995 | $2.41 | 21d | 1 | 0.56mi |
| 1038 W Jasmine Ln North Lauderdale, FL | 3.0 | 2.0 | 1470 | $3,000 | $2.04 | 4d | 1 | 0.56mi |
| 1034 W Jasmine Ln North Lauderdale, FL | 3.0 | 2.0 | 1470 | $2,850 | $1.94 | 24d | 1 | 0.58mi |
| 6872 SW 15th St Pompano Beach, FL | 2.0 | 1.0 | 919 | $2,400 | $2.61 | 13d | 1 | 0.58mi |
| 7664 Kimberly Blvd Unit 1-3 North Lauderdale, FL | 2.0 | 1.0 | 792 | $1,850 | $2.34 | 5d | 1 | 0.58mi |
| 7721 SW 10th Ct Unit B North Lauderdale, FL | 3.0 | 1.0 | 1050 | $1,950 | $1.86 | 24d | 1 | 0.59mi |
| 7731 SW 10th Ct Unit 4 North Lauderdale, FL | 3.0 | 1.0 | 1200 | $2,500 | $2.08 | 16d | 1 | 0.60mi |
| 631 Kathy Ct Margate, FL | 2.0 | 2.0 | 875 | $1,995 | $2.28 | 17d | 1 | 0.61mi |
| 1177 Sussex Dr North Lauderdale, FL | 2.0 | 1.0 | 1236 | $2,370 | $1.92 | 24d | 1 | 0.62mi |
| 1358 Silverado North Lauderdale, FL | 4.0 | 2.5 | 1380 | $3,475 | $2.52 | 21d | 1 | 0.64mi |
| 1740 SW 70th Way North Lauderdale, FL | 2.0 | 1.0 | 775 | $2,000 | $2.58 | 11d | 1 | 0.67mi |
| 6391 SW 8th St North Lauderdale, FL | 3.0 | 2.0 | 1162 | $3,300 | $2.84 | 24d | 1 | 0.68mi |
| 1368 Seaview North Lauderdale, FL | 4.0 | 3.0 | 1492 | $3,400 | $2.28 | 24d | 1 | 0.68mi |
| 7174 Sportsmans Dr North Lauderdale, FL | 2.0 | 2.0 | 1186 | $2,400 | $2.02 | 24d | 1 | 0.69mi |
| 568 Kathy Ct Margate, FL | 2.0 | 2.0 | 875 | $1,995 | $2.28 | 24d | 1 | 0.70mi |
| 563 Kathy Ct Margate, FL | 2.0 | 2.0 | 875 | $2,035 | $2.33 | 24d | 1 | 0.70mi |
| 7830 SW 10th Ct Unit A North Lauderdale, FL | 3.0 | 2.0 | 960 | $2,750 | $2.86 | 24d | 1 | 0.71mi |
| 551 Kathy Ct Margate, FL | 2.0 | 1.0–2.0 | 851 | $1,945 | $2.29 | 3d | 2 | 0.71mi |
| 1850 Adventure Pl North Lauderdale, FL | 3.0 | 2.0 | 1336 | $2,750 | $2.06 | 24d | 1 | 0.71mi |
| 915 E Maple St North Lauderdale, FL | 3.0 | 2.0 | 1470 | $3,350 | $2.28 | 13d | 1 | 0.72mi |
| 6511 SW 15th Ct Pompano Beach, FL | 4.0 | 2.0 | 1190 | $3,250 | $2.73 | 24d | 1 | 0.74mi |
| 224 San Remo Blvd Unit 224 North Lauderdale, FL | 3.0 | 2.5 | 1289 | $2,900 | $2.25 | 24d | 1 | 0.75mi |
| 6963 SW 19th St Pompano Beach, FL | 2.0 | 1.0 | 1054 | $1,700 | $1.61 | 24d | 1 | 0.75mi |
| 6870 SW 18th Ct #6870 Pompano Beach, FL | 4.0 | 2.0 | 1346 | $3,700 | $2.75 | 24d | 1 | 0.75mi |
HOA detail condo
- Monthly dues
- $450 · $5,400/yr
- Likely covers
- parking
- Assessments
- None detected in remarks — confirm with the listing agent.
Listing history 13 events
-
2026-06-18days on market $199,000 Active 99 DOM
-
2026-06-17days on market $199,000 Active 98 DOM
-
2026-06-16days on market $199,000 Active 97 DOM
-
2026-06-15days on market $199,000 Active 96 DOM
-
2026-06-13days on market $199,000 Active 94 DOM
-
2026-06-09days on market $199,000 Active 90 DOM
-
2026-06-07days on market $199,000 Active 88 DOM
-
2026-06-04days on market $199,000 Active 85 DOM
-
2026-06-03days on market $199,000 Active 84 DOM
-
2026-06-02days on market $199,000 Active 83 DOM
-
2026-06-01days on market $199,000 Active 82 DOM
-
2026-05-31days on market $199,000 Active 81 DOM
-
2025-07-24$199,000 Active
ⓘ Source: listings_history table (triggers on properties + properties_extension) + one-shot
backfill from property_details.listing_events for pre-trigger history.
Climate risk First Street
- Flood 1/10 Low FEMA zone X (shaded) · 0% chance over 30 yrs
- Wildfire 1/10 Low
- Heat 9/10 Extreme 7 d/yr ≥106°F today · 25 d/yr by 30 yrs out
- Wind 10/10 Extreme 99% chance of damaging wind over 30 yrs
- Air quality 3/10 Moderate 3 unhealthy d/yr today · 3 by 30 yrs out
Nearby sold comps map
Loading sold comps map…
Walkable amenities ~0.75 mi
Loading nearby amenities…
Taxation est. · year 1
- Rental income
- $32,709
- − Mortgage interest
- −$11,147
- − Property taxes
- −$2,985
- − Insurance
- −$995
- − Repairs & maintenance
- −$2,617
- − Management
- −$2,617
- − HOA
- −$5,400
- − Depreciation
- −$5,789
- Taxable income
- $1,160
- Est. tax owed @ 24.0%
- −$278
- After-tax cash flow
- $3,659/yr
For passive investors: Depreciation is non-cash, so a rental often shows a tax loss while cash-flowing — sheltering income. Rental losses are passive: they offset passive income freely, and up to $25,000/yr can offset ordinary (W-2) income if you actively participate and your MAGI is under $100k (phasing out to $0 by $150k); unused losses carry forward. On sale, claimed depreciation is recaptured at up to 25%, and gains may owe capital-gains tax (a 1031 exchange can defer both). Figures are a year-1 estimate at your 24.0% rate — not tax advice; consult a CPA.
Schools (NCES district)
- District
- Broward
- NCES district ID
- 1200180
- Math proficiency
- 42% ▼ -18.00%
- Reading proficiency
- 53% ▼ -5.00%
- Median HH income
- $52,139
- Composite
- 40.88/100
- National rank
- #3621
- State rank
- #46 of 73 in FL
Livability — North Lauderdale
- Score
- 76/100
- State rank
- #230
- US rank
- #3635
Category grades
Schools grade is shown separately in the Schools card above.
Census & demographics
- Census place
- North Lauderdale, FL
- County
- Broward County · 1,963,430 people
- City population
- 54,439
- Metro
- Miami-Fort Lauderdale-Pompano Beach, FL
- Population (ZIP)
- 54,439
- Household income
- $64,051
- Rent vs Own
- Severe rent burden
- 3073.0
Population outlook (Broward County) Hauer SSP2
- Today (2025)
- 2,207,033 people
- By 2030
- 2,360,704 · +7.0%
- By 2040
- 2,661,208 · +20.6%
- By 2050
- 2,946,698 · +33.5%
- By 2075
- 3,602,273 · +63.2%
- By 2100
- 3,970,984 · +79.9%
Race, ethnicity, and origin ACS 2023
- Neighborhood character
- Diverse neighborhood (Simpson 0.61)
- Race & ethnicity
- Black 58% Hispanic / Latino 21% Two or more races 13% White 11% Asian 4%
- Hispanic origin (detail)
- Mexican 3% Puerto Rican 4% Cuban 1% Dominican 3%
- Common ancestry
- Hispanic 17% Estonian 1% Lithuanian 1%
- Foreign-born
- 47% · Canada, Jamaica, Vietnam
- Languages at home
- 59% English-only · Spanish 19% French/Haitian/Cajun 15% Other Indo-European 2%
Political lean MEDSL · Broward
- 2024 margin
- D (+17.0) · D 58.0% · R 41.0%
- 2008→2024 swing
- -17.8pp toward R · 2008: 34.7pp · 2024: 17.0pp
- All cycles
- 2024: D+17.0 2020: D+29.8 2016: D+35.0 2012: D+34.9 2008: D+34.7
Not yet ingested
- Civics
- —
Market trends
- HPI YoY
- ▼ -317.60%
- Current HPI
- 426.2972
- Rent YoY
- ▼ -0.74%
- Metro
- Miami-Fort Lauderdale-Pompano Beach, FL
- State GDP YoY
- ▲ 3.28%
- F500 in state
- 36
Industry mix (Fortune 500 HQ in FL)
| Industry | F500 HQs | Revenue |
|---|---|---|
| Industrial Technology | 2 | $29B |
|
||
| Insurance | 2 | $17B |
|
||
| Retail | 1 | $60B |
|
||
| Technology Distribution | 1 | $58B |
|
||
| Homebuilding | 1 | $35B |
|
||
| Technology Manufacturing | 1 | $35B |
|
||
Price history
1 event — show timeline
- 2025-07-24 Listed $199,000 Beaches MLS
Cash-flow waterfall
monthlySold comps — $/sqft
last 12 mo · ≤1 miLoading sold comps…