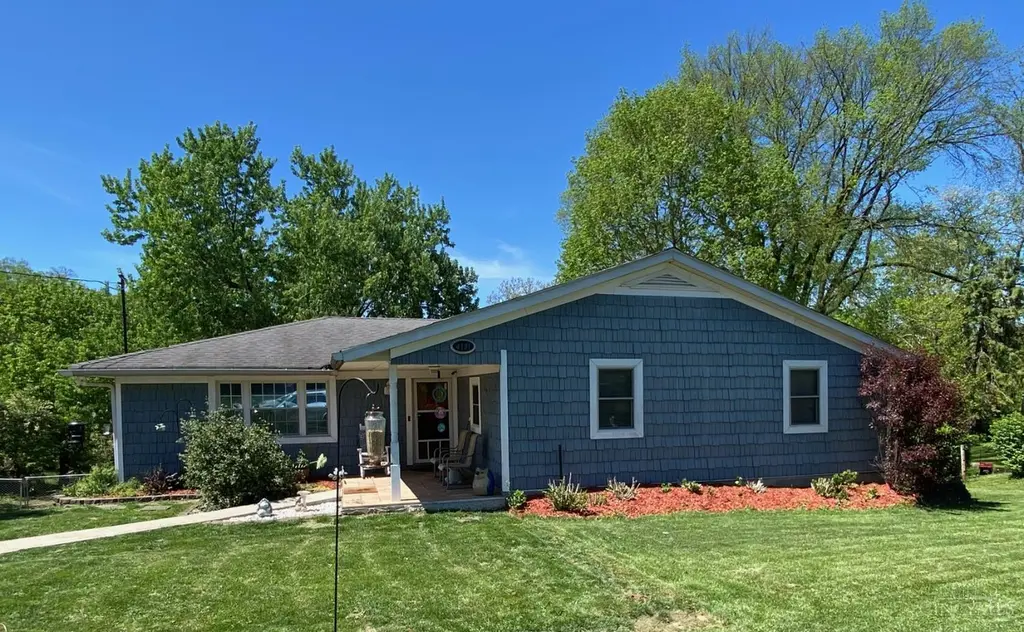
4181 Locust Ridge Dr · Miami Heights, OH
Flood risk 1/10 · Minimal
- FEMA flood zone
- X (unshaded)
- Chance of flooding over 30 yrs
- 0.0%
- Est. flood insurance / yr
- $473 – $860
Fire risk 1/10 · Minimal
- Est. fire insurance / yr
- $713 – $1,323
Heat risk 4/10 · Minor
- Hot days now (above 102°F)
- 7 days/yr
- Hot days in 30 yrs
- 19 days/yr
Wind risk 2/10 · Minimal
- Chance of severe wind over 30 yrs
- 1.0%
Air-quality risk 3/10 · Minor
- Unhealthy air days now
- 2 days/yr
- Unhealthy air days in 30 yrs
- 4 days/yr
Risk factors via First Street. Map © Google.
Why this score? — see what drove the C+ grade
The composite is a weighted blend of 9 inputs, each scored 0–100. Each bar is that input's sub-score; the figure is the points it added to the 100-point composite (weight × sub-score).
- Cash flow +25.0/30.0
- ARV discount +11.5/15.0
- DSCR +8.2/10.0
- 1% rule +6.2/10.0
- Schools +5.3/10.0
- Livability +3.2/5.0
- Rent growth +2.5/5.0
- Condition / age +2.5/5.0
- Appreciation +0.0/10.0
$400,000
🖨 Deal sheet (PDF) 📄 Offer letter ✓ Due diligence
Listing remarks MLS
4.114 acres of vacant land is your fingertips! Here is your chance to own an amazing property full of potential to build your dream home or parcel the lot for two to three neighbors to join! Property frontage is located on Locustridge Dr. Full Parcel extends from Locustridge to Sophias Way.
Key facts
- Attached half bath
- Double oven
- 0.46 acre lot
Tags
Property features AI
Finance
- Other: Zoned residential
- HOA & community: No HOA
Exterior
- Parking: 2 garage spaces (built-in, rear); 2 carport spaces (attached); Concrete driveway
- Utilities: Water at street; Septic tank sewer; Natural gas service
- Home design: Ranch-style single family home; One level; Poured foundation
- Construction: Shingle roof; Shingle siding and vinyl siding; Vinyl windows
- Exterior features: Cul-de-sac lot; Deck; Porch; Wooded lot; One fireplace (stove); Shed on property
Interior
- Kitchen: Pantry; Quartz countertops; Tile flooring; Wood cabinets
- Bedrooms: 3 bedrooms total; Primary bedroom (13 x 15) on level 1; Bedroom 2 (12 x 15) on level 1; Bedroom 3 (12 x 13) on level 1
- Flooring: Tile floor in kitchen; Laminate floor in dining room
- Bathrooms: Two full bathrooms (both on level 1); One half bathroom (on level 1); Primary bathroom includes a shower
- Heating & cooling: Forced air gas heating; Central air conditioning; Gas water heating
- Interior features: 11 total rooms; Finished basement with a fireplace/stove
- Laundry & utility: Laundry room (7 x 13) located on level 2
Neighborhood map
What this means for you Summary
Snapshot
- This is a 3-bed/1.5-bath single-family listed at $400k.
Deal economics
- At list price, monthly cash flow is $873 ($10k/yr) — positive.
- The deal already cash-flows at list — no discount required.
- Meets the 1% rule at list price ($4k rent vs $400k).
- Recommended offer: $388k (3.0% below list) — sets the bar for market timing.
- Cap rate 8.9% vs local median 3.5% in Miami Heights — top-decile yield for the area; either an underpriced asset or a hidden risk that comps aren't pricing in. Stress-test before assuming the spread holds.
Location & tenants
- Location reads 65/100 on livability (#752 in OH) — a middle-class / working-renter tenant base. Strengths: crime A+, employment A+, housing A+; Watch: amenities F, commute F, health & safety F.
- Three Rivers Local (rural): math 58% / reading 61% proficiency, ranked #256 of 656 in OH (top 39%) — acceptable for families but not a draw, mixed tenant base, ~2y average lease.
- Zoned schools: Three Rivers Elementary (math 65% / reading 52%, grade B-, #708 of 1,584 statewide, top 45%, 793 students, 35% FRL); Taylor Middle School (math 54% / reading 65%, grade B, #271 of 654 statewide, top 43%, 665 students, 40% FRL); Taylor High School (math 24% / reading 67%, grade D-, #463 of 781 statewide, top 59%, 644 students, 32% FRL) — zoned schools at 36% FRL track the district average.
- Market conditions: 68 active listings in the ZIP; 1 comparable units currently listed for rent nearby; solid renter incomes; 801 units permitted in Hamilton County in 2024 (190 in 5+ unit buildings).
- At $4,500/mo this rent would consume 64% of the median local household income ($85k/yr) — very limited rent-growth headroom before tenants either downsize or default.
Forward outlook
- Local home prices are declining (-3.0%/yr); year-one equity from $3k of loan paydown is wiped out by about $12k of value loss. Plan a longer hold.
Negotiation context
- It's been on market 60 days — a 3% lower offer ($388k) is reasonable based on typical stale-listing flexibility.
- 2 sale attempts; this cycle's ask has dropped $50k (11%) from the opening price — seller is motivated, your offer sets the floor, not the list.
- Current owner paid $190k; list at $400k implies a 111% gain — meaningful room to come down on a strong offer.
Questions for the listing agent
- It's been on market 60 days. Have you received any prior offers? Is the seller open to a 3% concession, seller financing, or rate buy-down credit?
- Built in 1966 — when were the roof, HVAC, electrical panel, plumbing, and water heater last replaced?
- Is there a deadline driving the sale (1031 exchange, divorce, estate, relocation)? That informs how much negotiation room exists.
- Schools are D-rated, which usually means shorter tenancies and higher turnover. Who's the typical renter profile here, and what's been the actual vacancy rate?
- What's the average days-on-market for RENTAL listings here right now (not sales)? A rising rental-DOM trend means longer vacancies and softer asking-rent achievability than the comps imply.
- What's the recent tenant-quality profile in this submarket — average credit score on applications, eviction rate, late-payment / NSF rate, and stable-employment percentage? A property-management company in the area should have these aggregated.
- How much new for-sale + rental construction is in the pipeline within 1–3 miles? Heavy new supply typically softens prices + rents 12–24 months out; constrained supply supports both.
Investment metrics
- 1% rule
- 1.12% ✓
- Cap rate
- 8.91%
- Cash-on-cash
- 9.35%
- DSCR
- 1.42
- GRM
- 7.4
CMA / ARV
- ARV (median comp)
- $438,752
- List price
- $400,000
- Delta
- -8.83%
- Verdict
- FAIR
- Comps
- 20 within 1.0 mi
Show comp detail 7 sales within ~0.75 mi
| Address | Dist | Beds/Ba | Sqft | Sold | Price | $/sf | Match |
|---|---|---|---|---|---|---|---|
| 4220 St Cloud Way | 0.47mi | 4/3.0 (+1) | 2,838 (+5%) | 1mo | $565,000 | $199 | 57 |
| 3891 Haley Ln | 0.67mi | 4/2.5 (+1) | 2,832 (+5%) | 3mo | $506,000 | $179 | 48 |
| 4740 Zion Rd | 0.50mi | 4/3.0 (+1) | 2,497 (-7%) | 8mo | $442,500 | $177 | 47 |
| 8198 Jordan Valley Ct | 0.53mi | 4/2.5 (+1) | 2,614 (-3%) | 18mo | $425,000 | $163 | 47 |
| 3830 Nottingham Ct | 0.68mi | 3/2.5 | 2,922 (+8%) | 7mo | $560,000 | $192 | 44 |
| 3829 Nottingham Ct | 0.67mi | 3/2.5 | 3,024 (+12%) | 16mo | $530,000 | $175 | 31 |
| 4234 St Cloud Way | 0.48mi | 3/2.5 | 3,088 (+15%) | 24mo | $565,000 | $183 | 29 |
Match score weights: distance 35% · size 25% · config 20% · recency 20%. Top-matched comps best support the ARV.
Projected returns pro-forma
-3.0% appreciation · 3.0% rent growth · sell at horizon
- IRR
- -2.2%
- Equity multiple
- 0.92×
- Total profit
- $-9,192
- Equity at exit
- $59,641
- IRR
- 7.5%
- Equity multiple
- 1.57×
- Total profit
- $63,670
- Equity at exit
- $34,585
Cash invested: $112,000 (down + closing). Projections, not guarantees.
Landlord ↔ Tenant lean methodology
- Overall (STATE)
- 73 Landlord-Friendly
- State Ohio
- 73 Landlord-Friendly · R+6
- County
- — inherits STATE
- City
- — inherits STATE
ZIP-level market 45002
- Home prices YoY
- -28.9%
- Active inventory
- 68
- Price-to-rent
- 7.4×
Monthly cashflow live
- Estimated rent
- $4,500 medium interval (Pro) →
- Mortgage (P&I)
- −$2,098
- Tax from tax record
- −$418 /mo · $5,011/yr
- Insurance
- −$167
- HOA
- −$0
- Vacancy / Maint / Mgmt
- −$945
- Net cashflow
- $873
Break-even live
Sensitivity live
| Price | -10% $1,100 | -5% $986 | +0% $873 | +5% $760 | +10% $647 |
|---|---|---|---|---|---|
| Rent | -10% $518 | -5% $695 | +0% $873 | +5% $1,051 | +10% $1,229 |
| Rate | -1.0pp $1,075 | -0.5pp $975 | base $873 | +0.5pp $769 | +1.0pp $664 |
UW: 25.0% down · 7.5% · 30yr · 1.5% tax · 5.0% vac · 8.0% maint · 8.0% mgmt
Financing live
Cash to close
- Down payment
- $100,000
- Closing costs
- $12,000
- Reserves months
- —
- Total cash needed
- —
Loan-product check · same deal, 3 products live
Conventional
25% down · 7.5% · 30yr
- Down + closing
- —
- Monthly P&I
- —
- Monthly cashflow
- —
- DSCR
- —
- Eligible?
- —
Personal DTI + credit; lowest rate.
DSCR
20% down · 8.5% · 30yr
- Down + closing
- —
- Monthly P&I
- —
- Monthly cashflow
- —
- DSCR
- —
- Eligible?
- —
No personal income docs; deal must DSCR.
Hard money
10% down · 12.0% · 12mo
- Down + closing
- —
- Monthly P&I
- —
- Monthly cashflow
- —
- DSCR
- —
- Eligible?
- —
Short-term bridge; refi at stabilization.
Rent comps 1 comps
| Address | Beds | Baths | Sqft | Rent | $/sqft | DOM | Units | Dist |
|---|---|---|---|---|---|---|---|---|
| 8705 Quietwood Ln Cleves, OH | 4.0 | 2.5 | 3708 | $4,500 | $1.21 | 45d | 1 | 1.27mi |
Listing history 22 events
-
2026-06-21days on market $400,000 Active 60 DOM
-
2026-06-21days on market $400,000 Active 59 DOM
-
2026-06-18days on market $400,000 Active 57 DOM
-
2026-06-17days on market $400,000 Active 56 DOM
-
2026-06-17price $400,000 Active 55 DOM
-
2026-06-16days on market $455,000 Active 55 DOM
-
2026-06-15days on market $455,000 Active 54 DOM
-
2026-06-13days on market $455,000 Active 52 DOM
-
2026-06-12days on market $455,000 Active 51 DOM
-
2026-06-09days on market $455,000 Active 48 DOM
-
2026-06-08days on market $455,000 Active 47 DOM
-
2026-06-08days on market $455,000 Active 46 DOM
-
2026-06-04days on market $455,000 Active 42 DOM
-
2026-06-02days on market $455,000 Active 41 DOM
-
2026-06-01days on market $455,000 Active 40 DOM
-
2026-05-31days on market $455,000 Active 39 DOM
-
2026-04-23price $455,000 910-char remark
-
2026-04-22$450,000 Active 910-char remark
-
2026-02-13historical 294-char remark
Show marketing remark (294 chars)
4.114 acres of vacant land is your fingertips! Here is your chance to own an amazing property full of potential to build your dream home or parcel the lot for two to three neighbors to join! Property frontage is located on Locustridge Dr. Full Parcel extends from Locustridge to Sophias Way.
-
2025-07-29$180,000 Active 294-char remark
Show marketing remark (294 chars)
4.114 acres of vacant land is your fingertips! Here is your chance to own an amazing property full of potential to build your dream home or parcel the lot for two to three neighbors to join! Property frontage is located on Locustridge Dr. Full Parcel extends from Locustridge to Sophias Way.
-
2004-04-23soldstatus $189,500
-
1986-09-03soldstatus $75,000
ⓘ Source: listings_history table (triggers on properties + properties_extension) + one-shot
backfill from property_details.listing_events for pre-trigger history.
Tax reassessment forecast OH · Partial reset (capped growth)
- Current annual tax
- $5,011 · $418/mo
- Projected year-2 tax
- $5,626 · $469/mo
- Expected delta
- +$614/yr (+$51/mo · 12.3%)
ⓘ Screening estimate from a state-policy table — verify with the county assessor before closing.
Climate risk First Street
- Flood 1/10 Low FEMA zone X (unshaded) · 0% chance over 30 yrs
- Wildfire 1/10 Low
- Heat 4/10 Moderate 7 d/yr ≥102°F today · 19 d/yr by 30 yrs out
- Wind 2/10 Low 100% chance of damaging wind over 30 yrs
- Air quality 3/10 Moderate 2 unhealthy d/yr today · 4 by 30 yrs out
Nearby sold comps map
Loading sold comps map…
Walkable amenities ~0.75 mi
Loading nearby amenities…
Taxation est. · year 1
- Rental income
- $54,000
- − Mortgage interest
- −$22,406
- − Property taxes
- −$5,011
- − Insurance
- −$2,000
- − Repairs & maintenance
- −$4,320
- − Management
- −$4,320
- − Depreciation
- −$11,636
- Taxable income
- $4,306
- Est. tax owed @ 24.0%
- −$1,034
- After-tax cash flow
- $9,444/yr
For passive investors: Depreciation is non-cash, so a rental often shows a tax loss while cash-flowing — sheltering income. Rental losses are passive: they offset passive income freely, and up to $25,000/yr can offset ordinary (W-2) income if you actively participate and your MAGI is under $100k (phasing out to $0 by $150k); unused losses carry forward. On sale, claimed depreciation is recaptured at up to 25%, and gains may owe capital-gains tax (a 1031 exchange can defer both). Figures are a year-1 estimate at your 24.0% rate — not tax advice; consult a CPA.
Schools (NCES district)
- District
- Three Rivers Local
- NCES district ID
- 3904739
- Math proficiency
- 58% ▼ -9.00%
- Reading proficiency
- 61% ▼ -10.00%
- Median HH income
- $72,973
- Composite
- 52.85/100
- National rank
- #1533
- State rank
- #256 of 656 in OH
Livability — Miami Heights
- Score
- 65/100
- State rank
- #752
- US rank
- #13562
Category grades
Schools grade is shown separately in the Schools card above.
Census & demographics
- Census place
- Miami Heights, OH
- County
- Hamilton · 838,887 people
- Metro
- Cincinnati, OH-KY-IN
- Population (ZIP)
- 14,647
- Household income
- $84,597
- Rent vs Own
- Severe rent burden
- 12.0
Population outlook (Hamilton County) Hauer SSP2
- Today (2025)
- 826,054 people
- By 2030
- 830,947 · +0.6%
- By 2040
- 832,319 · +0.8%
- By 2050
- 822,428 · -0.4%
- By 2075
- 788,688 · -4.5%
- By 2100
- 710,674 · -14.0%
Race, ethnicity, and origin ACS 2023
- Neighborhood character
- Predominantly White (93%)
- Race & ethnicity
- White 93% Two or more races 6% Hispanic / Latino 2%
- Common ancestry
- Romanian 2% Slovak 2% Italian 2%
- Foreign-born
- 1%
- Languages at home
- 98% English-only · Spanish 1%
Political lean MEDSL · Hamilton
- 2024 margin
- D (+14.9) · D 57.0% · R 42.1%
- 2008→2024 swing
- +7.9pp toward D · 2008: 7.0pp · 2024: 14.9pp
- All cycles
- 2024: D+14.9 2020: D+15.9 2016: D+9.5 2012: D+4.9 2008: D+7.0
Not yet ingested
- Civics
- —
Market trends
- HPI YoY
- ▼ -85.62%
- Current HPI
- 210.9397
- Rent YoY
- —
- Metro
- —
- State GDP YoY
- ▲ 1.98%
- F500 in state
- 48
Industry mix (Fortune 500 HQ in OH)
| Industry | F500 HQs | Revenue |
|---|---|---|
| Insurance | 3 | $145B |
|
||
| Industrial Machinery | 3 | $49B |
|
||
| Financial Services | 3 | $24B |
|
||
| Consumer Goods | 2 | $93B |
|
||
| Aerospace / Defense | 2 | $47B |
|
||
| Utilities | 2 | $33B |
|
||
Price history
+433.3% since first listed7 events — show timeline
- 2026-06-17 Price Changed $400,000 Cincy MLS
- 2026-04-23 Price Changed $455,000 Cincy MLS
- 2026-04-22 Listed $450,000 Cincy MLS
- 2026-02-13 Listing Removed — Cincy MLS
- 2025-07-29 Listed $180,000 Cincy MLS
- 2004-04-23 Sold (Public Records) $189,500 Public Records
- 1986-09-03 Sold (Public Records) $75,000 Public Records
Property tax history
+4.0%/yrLatest (2025): $5,011 · +12.6% YoY. Source: county tax records.
Cash-flow waterfall
monthlySold comps — $/sqft
last 12 mo · ≤1 miLoading sold comps…