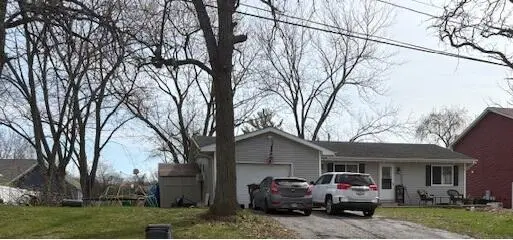
15819 East Dr · Lake Dalecarlia, IN
Flood risk 1/10 · Minimal
- FEMA flood zone
- X (unshaded)
- Chance of flooding over 30 yrs
- 0.0%
- Est. flood insurance / yr
- $473 – $860
Fire risk 1/10 · Minimal
- Est. fire insurance / yr
- $717 – $1,331
Heat risk 2/10 · Minimal
- Hot days now (above 101°F)
- 7 days/yr
- Hot days in 30 yrs
- 16 days/yr
Wind risk 2/10 · Minimal
- Chance of severe wind over 30 yrs
- 1.0%
Air-quality risk 2/10 · Minimal
- Unhealthy air days now
- 1 days/yr
- Unhealthy air days in 30 yrs
- 2 days/yr
Risk factors via First Street. Map © Google.
Why this score? — see what drove the B- grade
The composite is a weighted blend of 9 inputs, each scored 0–100. Each bar is that input's sub-score; the figure is the points it added to the 100-point composite (weight × sub-score).
- Cash flow +25.3/30.0
- ARV discount +15.0/15.0
- DSCR +8.3/10.0
- 1% rule +6.2/10.0
- Schools +4.5/10.0
- Livability +3.5/5.0
- Rent growth +2.5/5.0
- Condition / age +2.5/5.0
- Appreciation +0.0/10.0
$147,700
🖨 Deal sheet (PDF) 📄 Offer letter ✓ Due diligence
Listing remarks MLS
Quaint, Remodeled inside and out, 3 Bedroom, Basement, Garage and Wooded Lake View. Newer Roof, Siding, Windows, Kitchen Doors and Flooring & Bath. Large Eat-In Kitchen. All Appliances including washer and dryer remain. Newer C/A and water heater. Association allows boat slip for owner. Beautiful lot. Home warranty included. Low, Low taxes.
Key facts
- 0.3 acre lot
- Garage
- Built 1971
Neighborhood map
What this means for you Summary
Snapshot
- This is a 2-bed/1.0-bath single-family listed at $148k.
Deal economics
- At list price, monthly cash flow is $336 ($4k/yr) — positive.
- The deal already cash-flows at list — no discount required.
- Meets the 1% rule at list price ($2k rent vs $148k).
Location & tenants
- Location reads 70/100 on livability (#161 in IN) — a middle-class / working-renter tenant base. Strengths: crime A+, employment A+, housing A+; Watch: amenities F, commute F, health & safety D-.
- Tri-Creek School Corporation (town): math 46% / reading 56% proficiency, ranked #39 of 301 in IN (top 13%) — acceptable for families but not a draw, mixed tenant base, ~2y average lease.
- Zoned schools: Lake Prairie Elementary School (math 67% / reading 52%, grade B-, #128 of 994 statewide, top 15%, 416 students, 26% FRL); Lowell Middle School (math 36% / reading 54%, grade D, #81 of 330 statewide, top 25%, 742 students, 33% FRL); Lowell Senior High School (math 31% / reading 75%, grade C-, #99 of 369 statewide, top 27%, 1,033 students, 29% FRL).
- Market conditions: 351 active listings in the ZIP; 1,642 units permitted in Lake County in 2024 (14 in 5+ unit buildings).
Forward outlook
- Local home prices are declining (-3.0%/yr); year-one equity from $1k of loan paydown is wiped out by about $4k of value loss. Plan a longer hold.
- Lake County population projected to shrink 7% by 2050 — rents likely to lag national; underwrite the cash flow, not the appreciation.
Negotiation context
- Only 14 days on market — expect competitive offers; lowballing is unlikely to land.
- 7 sale attempts since 22y ago; this cycle's ask is 14769900% above the opening price — seller raised mid-cycle; expect resistance to lowballs.
Questions for the listing agent
- Built in 1971 — when were the roof, HVAC, electrical panel, plumbing, and water heater last replaced?
- What does the HOA fee cover, when was the last increase, and are there any pending special assessments or reserve-fund shortfalls?
- Is there a deadline driving the sale (1031 exchange, divorce, estate, relocation)? That informs how much negotiation room exists.
- What's the average days-on-market for RENTAL listings here right now (not sales)? A rising rental-DOM trend means longer vacancies and softer asking-rent achievability than the comps imply.
- What's the recent tenant-quality profile in this submarket — average credit score on applications, eviction rate, late-payment / NSF rate, and stable-employment percentage? A property-management company in the area should have these aggregated.
- How much new for-sale + rental construction is in the pipeline within 1–3 miles? Heavy new supply typically softens prices + rents 12–24 months out; constrained supply supports both.
Investment metrics
- 1% rule
- 1.12% ✓
- Cap rate
- 9.03%
- Cash-on-cash
- 9.76%
- DSCR
- 1.43
- GRM
- 7.4
CMA / ARV
- ARV (on-the-fly)
- $207,252
- Comps found
- 5
Show comp detail 5 sales within ~0.75 mi
| Address | Dist | Beds/Ba | Sqft | Sold | Price | $/sf | Match |
|---|---|---|---|---|---|---|---|
| 5104 Burr Oak Ter | 0.11mi | 3/1.0 (+1) | 1,008 (-2%) | 14mo | $260,000 | $258 | 75 |
| 5518 W Main St | 0.39mi | 2/1.0 | 1,020 (-1%) | 24mo | $143,000 | $140 | 61 |
| 540 S Lakeview Dr | 0.43mi | 2/1.0 | 1,000 (-2%) | 19mo | $125,000 | $125 | 59 |
| 505 Lakeview Ct | 0.57mi | 2/1.0 | 1,000 (-2%) | 13mo | $285,000 | $285 | 58 |
| 5206 W Main St | 0.31mi | 3/1.0 (+1) | 1,166 (+14%) | 18mo | $235,000 | $202 | 43 |
Match score weights: distance 35% · size 25% · config 20% · recency 20%. Top-matched comps best support the ARV.
Projected returns pro-forma
-3.0% appreciation · 3.0% rent growth · sell at horizon
- IRR
- -1.6%
- Equity multiple
- 0.94×
- Total profit
- $-2,507
- Equity at exit
- $22,023
- IRR
- 8.1%
- Equity multiple
- 1.61×
- Total profit
- $25,397
- Equity at exit
- $12,770
Cash invested: $41,356 (down + closing). Projections, not guarantees.
Landlord ↔ Tenant lean methodology
- Overall (STATE)
- 90 Strongly Landlord-Friendly
- State Indiana
- 90 Strongly Landlord-Friendly · R+11
- County
- — inherits STATE
- City
- — inherits STATE
ZIP-level market 46356
- Home prices YoY
- -30.1%
- Active inventory
- 351
- Price-to-rent
- 7.4×
Monthly cashflow live
- Estimated rent
- $1,658 medium interval (Pro) →
- Mortgage (P&I)
- −$775
- Tax from tax record
- −$124 /mo · $1,493/yr
- Insurance
- −$62
- HOA
- −$13
- Vacancy / Maint / Mgmt
- −$348
- Net cashflow
- $336
Break-even live
Sensitivity live
| Price | -10% $420 | -5% $378 | +0% $336 | +5% $295 | +10% $253 |
|---|---|---|---|---|---|
| Rent | -10% $205 | -5% $271 | +0% $336 | +5% $402 | +10% $467 |
| Rate | -1.0pp $411 | -0.5pp $374 | base $336 | +0.5pp $298 | +1.0pp $259 |
UW: 25.0% down · 7.5% · 30yr · 1.5% tax · 5.0% vac · 8.0% maint · 8.0% mgmt
Financing live
Cash to close
- Down payment
- $36,925
- Closing costs
- $4,431
- Reserves months
- —
- Total cash needed
- —
Loan-product check · same deal, 3 products live
Conventional
25% down · 7.5% · 30yr
- Down + closing
- —
- Monthly P&I
- —
- Monthly cashflow
- —
- DSCR
- —
- Eligible?
- —
Personal DTI + credit; lowest rate.
DSCR
20% down · 8.5% · 30yr
- Down + closing
- —
- Monthly P&I
- —
- Monthly cashflow
- —
- DSCR
- —
- Eligible?
- —
No personal income docs; deal must DSCR.
Hard money
10% down · 12.0% · 12mo
- Down + closing
- —
- Monthly P&I
- —
- Monthly cashflow
- —
- DSCR
- —
- Eligible?
- —
Short-term bridge; refi at stabilization.
HOA detail
- Monthly dues
- $13 · $156/yr
- Likely covers
- water
Listing history 13 events
-
2026-04-28status Pending
-
2026-04-28price $147,700
-
2026-04-14$1 Active
-
2016-06-27soldstatus $140,000 348-char remark
Show marketing remark (348 chars)
Quaint, Remodeled inside and out, 3 Bedroom, Basement, Garage and Wooded Lake View. Newer Roof, Siding, Windows, Kitchen Doors and Flooring & Bath. Large Eat-In Kitchen. All Appliances including washer and dryer remain. Newer C/A and water heater. Association allows boat slip for owner. Beautiful lot. Home warranty included. Low, Low taxes.
-
2016-04-28$139,900 348-char remark
Show marketing remark (348 chars)
Quaint, Remodeled inside and out, 3 Bedroom, Basement, Garage and Wooded Lake View. Newer Roof, Siding, Windows, Kitchen Doors and Flooring & Bath. Large Eat-In Kitchen. All Appliances including washer and dryer remain. Newer C/A and water heater. Association allows boat slip for owner. Beautiful lot. Home warranty included. Low, Low taxes.
-
2013-07-23historical
-
2012-11-05$155,000
-
2008-05-30$154,500
-
2007-02-19$74,900
-
2006-11-05historical
-
2006-05-04$133,000
-
2005-09-08historical
-
2004-09-07$144,900
ⓘ Source: listings_history table (triggers on properties + properties_extension) + one-shot
backfill from property_details.listing_events for pre-trigger history.
Tax reassessment forecast IN · Partial reset (capped growth)
- Current annual tax
- $1,493 · $124/mo
- Projected year-2 tax
- $1,493 · $124/mo
- Expected delta
- $0/yr ($0/mo · 0.0%)
ⓘ Screening estimate from a state-policy table — verify with the county assessor before closing.
Climate risk First Street
- Flood 1/10 Low FEMA zone X (unshaded) · 0% chance over 30 yrs
- Wildfire 1/10 Low
- Heat 2/10 Low 7 d/yr ≥101°F today · 16 d/yr by 30 yrs out
- Wind 2/10 Low 100% chance of damaging wind over 30 yrs
- Air quality 2/10 Low 1 unhealthy d/yr today · 2 by 30 yrs out
Nearby sold comps map
Loading sold comps map…
Walkable amenities ~0.75 mi
Loading nearby amenities…
Taxation est. · year 1
- Rental income
- $19,898
- − Mortgage interest
- −$8,273
- − Property taxes
- −$1,493
- − Insurance
- −$738
- − Repairs & maintenance
- −$1,592
- − Management
- −$1,592
- − HOA
- −$156
- − Depreciation
- −$4,297
- Taxable income
- $1,757
- Est. tax owed @ 24.0%
- −$422
- After-tax cash flow
- $3,616/yr
For passive investors: Depreciation is non-cash, so a rental often shows a tax loss while cash-flowing — sheltering income. Rental losses are passive: they offset passive income freely, and up to $25,000/yr can offset ordinary (W-2) income if you actively participate and your MAGI is under $100k (phasing out to $0 by $150k); unused losses carry forward. On sale, claimed depreciation is recaptured at up to 25%, and gains may owe capital-gains tax (a 1031 exchange can defer both). Figures are a year-1 estimate at your 24.0% rate — not tax advice; consult a CPA.
Schools (NCES district)
- District
- Tri-Creek School Corporation
- NCES district ID
- 1811460
- Math proficiency
- 46% ▼ -8.00%
- Reading proficiency
- 56% ▼ -5.00%
- Median HH income
- $64,614
- Composite
- 44.97/100
- National rank
- #2704
- State rank
- #39 of 301 in IN
Livability — Lake Dalecarlia
- Score
- 70/100
- State rank
- #161
- US rank
- #7821
Category grades
Schools grade is shown separately in the Schools card above.
Census & demographics
- Census place
- Lake Dalecarlia, IN
- Population (ZIP)
- 19,396
Population outlook (Lake County) Hauer SSP2
- Today (2025)
- 484,026 people
- By 2030
- 478,091 · -1.2%
- By 2040
- 462,974 · -4.3%
- By 2050
- 449,894 · -7.1%
- By 2075
- 436,169 · -9.9%
- By 2100
- 426,607 · -11.9%
Race, ethnicity, and origin ACS 2023
- Neighborhood character
- Predominantly White (88%)
- Race & ethnicity
- White 88% Hispanic / Latino 9% Two or more races 6%
- Hispanic origin (detail)
- Mexican 8%
- Common ancestry
- Romanian 16% Iranian 10% Lithuanian 2%
- Foreign-born
- 4% · Canada
- Languages at home
- 95% English-only · Spanish 4% Russian/Polish/Slavic 1%
Political lean MEDSL · Lake
- 2024 margin
- Lean D (+5.6) · D 52.1% · R 46.5% · Other 1.5%
- 2008→2024 swing
- -28.6pp toward R · 2008: 34.3pp · 2024: 5.6pp
- All cycles
- 2024: D+5.6 2020: D+15.1 2016: D+20.6 2012: D+31.0 2008: D+34.3
Not yet ingested
- Civics
- —
Market trends
- HPI YoY
- ▼ -110.73%
- Current HPI
- 256.6224
- Rent YoY
- —
- Metro
- —
- State GDP YoY
- ▲ 2.90%
- F500 in state
- 18
Industry mix (Fortune 500 HQ in IN)
| Industry | F500 HQs | Revenue |
|---|---|---|
| Industrial Machinery | 2 | $37B |
|
||
| Healthcare | 1 | $177B |
|
||
| Pharmaceuticals | 1 | $45B |
|
||
| Metals / Steel | 1 | $18B |
|
||
| Agriculture | 1 | $17B |
|
||
| Packaging | 1 | $12B |
|
||
Price history
+1.9% since first listed13 events — show timeline
- 2026-04-28 Pending — NIRA MLS as Distributed by MLS Grid
- 2026-04-28 Price Changed $147,700 NIRA MLS as Distributed by MLS Grid
- 2026-04-14 Listed $1 NIRA MLS as Distributed by MLS Grid
- 2016-06-27 Sold (MLS) $140,000 NIRA MLS as Distributed by MLS Grid
- 2016-04-28 Listed $139,900 NIRA MLS as Distributed by MLS Grid
- 2013-07-23 Listing Removed — NIRA MLS as Distributed by MLS Grid
- 2012-11-05 Listed $155,000 NIRA MLS as Distributed by MLS Grid
- 2008-05-30 Listed $154,500 NIRA MLS as Distributed by MLS Grid
- 2007-02-19 Listed $74,900 NIRA MLS as Distributed by MLS Grid
- 2006-11-05 Listing Removed — NIRA MLS as Distributed by MLS Grid
- 2006-05-04 Listed $133,000 NIRA MLS as Distributed by MLS Grid
- 2005-09-08 Listing Removed — NIRA MLS as Distributed by MLS Grid
- 2004-09-07 Listed $144,900 NIRA MLS as Distributed by MLS Grid
Property tax history
+2.5%/yrLatest (2024): $1,493 · +9.0% YoY. Source: county tax records.
Cash-flow waterfall
monthlySold comps — $/sqft
last 12 mo · ≤1 miLoading sold comps…