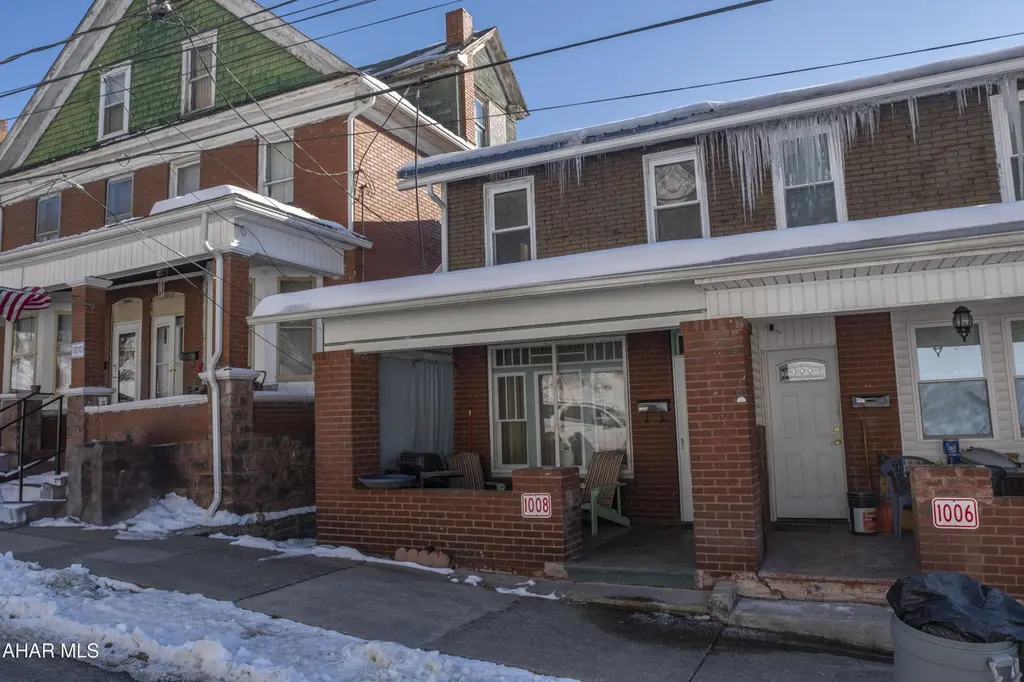
1008 Cameron Ave · Tyrone, PA
Flood risk 4/10 · Minor
- FEMA flood zone
- X (unshaded)
- Chance of flooding over 30 yrs
- 0.22%
- Est. flood insurance / yr
- $507 – $1,088
Fire risk 1/10 · Minimal
- Est. fire insurance / yr
- $511 – $949
Heat risk 4/10 · Minor
- Hot days now (above 96°F)
- 8 days/yr
- Hot days in 30 yrs
- 19 days/yr
Wind risk 2/10 · Minimal
- Chance of severe wind over 30 yrs
- —
Air-quality risk 2/10 · Minimal
- Unhealthy air days now
- 1 days/yr
- Unhealthy air days in 30 yrs
- 2 days/yr
Risk factors via First Street. Map © Google.
Why this score? — see what drove the B grade
The composite is a weighted blend of 9 inputs, each scored 0–100. Each bar is that input's sub-score; the figure is the points it added to the 100-point composite (weight × sub-score).
- Cash flow +30.0/30.0
- 1% rule +10.0/10.0
- DSCR +10.0/10.0
- ARV discount +7.5/15.0
- Appreciation +4.1/10.0
- Schools +3.9/10.0
- Livability +3.9/5.0
- Rent growth +2.5/5.0
- Condition / age +2.5/5.0
$62,000
🖨 Deal sheet 📄 Offer letter ✓ Due diligence
Listing remarks MLS
This half-double home offers a fantastic opportunity for both savvy investors looking to add to their portfolio and first-time buyers eager to build sweat equity. The layout is thoughtfully designed for convenience, featuring a sought-after main-floor bedroom paired with a full bathroom on the same level, making it ideal for those seeking single-floor living options. This home has a new roof as of May 2025, in addition to a newer furnace. While the home requires a few cosmetic upgrades and personal touches to truly shine, its solid bones and functional floor plan provide a perfect canvas for your vision.
Key facts
- Newer furnace
- Main-floor bedroom
- Full bathroom
Tags
Neighborhood map
What this means for you Summary
Snapshot
- This is a 3-bed/2.0-bath single-family listed at $62k.
Deal economics
- At list price, monthly cash flow is $297 ($4k/yr) — positive.
- The deal already cash-flows at list — no discount required.
- Meets the 1% rule at list price ($948 rent vs $62k).
- Recommended offer: $56k (9.0% below list) — sets the bar for market timing.
- Cap rate 12.0% vs local median 3.5% in Tyrone — top-decile yield for the area; either an underpriced asset or a hidden risk that comps aren't pricing in. Stress-test before assuming the spread holds.
Location & tenants
- Location reads 77/100 on livability (#319 in PA, #2,838 nationally) — a middle-class / working-renter tenant base. Strengths: cost of living A+, housing A+, health & safety A+; Watch: amenities D, commute F, employment F.
- Tyrone Area SD (town): math 35% / reading 57% proficiency, ranked #263 of 539 in PA (top 49%) — families likely to look elsewhere, expect single-tenant / working-renter base with shorter leases.
- Market conditions: 51 active listings in the ZIP; 99 units permitted in Blair County in 2024 (0 in 5+ unit buildings).
Forward outlook
- Local home prices are declining (-1.8%/yr); year-one equity from $429 of loan paydown is wiped out by about $1k of value loss. Plan a longer hold.
- Blair County population projected at -18% by 2050 — secular population decline; favor cash flow + early exit over multi-decade hold.
- At projected returns (-1.8% appreciation + 3.0% rent growth), your $17k cash investment doubles in ~5 years — after that, you're playing with house money.
Negotiation context
- It's been on market 104 days — a 9% lower offer ($56k) is reasonable based on typical stale-listing flexibility.
- 3 sale attempts since 15y ago with the ask held roughly flat each time — persistent listings suggest the price (not the market) is what's stuck; bring a comps-based counter.
- Current owner paid $9k; list at $62k implies a 589% gain — meaningful room to come down on a strong offer.
Risks & watch-outs
- Watch-outs: built in 1930 — expect roof / HVAC / electrical / plumbing capex.
Questions for the listing agent
- It's been on market 104 days. Have you received any prior offers? Is the seller open to a 9% concession, seller financing, or rate buy-down credit?
- Built in 1930 — when were the roof, HVAC, electrical panel, plumbing, and water heater last replaced?
- Why hasn't it sold? Are there any deal-killer items the seller is aware of (foundation, flood, title, zoning, code violations)?
- Is there a deadline driving the sale (1031 exchange, divorce, estate, relocation)? That informs how much negotiation room exists.
- Schools are A-rated — typically a magnet for longer-tenancy family renters. What's the average tenant stay here, and is there a school-zone premium baked into asking?
- What's the average days-on-market for RENTAL listings here right now (not sales)? A rising rental-DOM trend means longer vacancies and softer asking-rent achievability than the comps imply.
- What's the recent tenant-quality profile in this submarket — average credit score on applications, eviction rate, late-payment / NSF rate, and stable-employment percentage? A property-management company in the area should have these aggregated.
- How much new for-sale + rental construction is in the pipeline within 1–3 miles? Heavy new supply typically softens prices + rents 12–24 months out; constrained supply supports both.
Investment metrics
- 1% rule
- 1.53% ✓
- Cap rate
- 12.03%
- Cash-on-cash
- 20.50%
- DSCR
- 1.91
- GRM
- 5.4
CMA / ARV
- ARV (median comp)
- $140,922
- List price
- $62,000
- Delta
- -56.00%
- Verdict
- UNDERPRICED
- Comps
- 2 within 1.0 mi
Show comp detail 7 sales within ~0.75 mi
| Address | Dist | Beds/Ba | Sqft | Sold | Price | $/sf | Match |
|---|---|---|---|---|---|---|---|
| 112 W 12th | 0.17mi | 2/1.5 (-1) | 1,298 (+9%) | 1mo | $127,000 | $98 | 70 |
| 702 Engelman Dr | 0.37mi | 3/2.0 | 1,236 (+4%) | 10mo | $255,000 | $206 | 69 |
| 1313 Blair Ave | 0.38mi | 3/1.0 | 1,048 (-12%) | 2mo | $88,000 | $84 | 56 |
| 1404 Bald Eagle Ave | 0.49mi | 3/2.0 | 1,252 (+5%) | 22mo | $96,500 | $77 | 51 |
| 308 Waring St | 0.18mi | 3/1.5 | 1,338 (+12%) | 24mo | $136,000 | $102 | 50 |
| 1306 Blair Ave | 0.39mi | 3/1.0 | 1,345 (+13%) | 18mo | $80,000 | $59 | 42 |
| 1464 Blair Ave | 0.52mi | 2/1.0 (-1) | 1,048 (-12%) | 15mo | $43,900 | $42 | 34 |
Match score weights: distance 35% · size 25% · config 20% · recency 20%. Top-matched comps best support the ARV.
Projected returns pro-forma
-1.77% appreciation · 3.0% rent growth · sell at horizon
- IRR
- 16.1%
- Equity multiple
- 1.70×
- Total profit
- $12,115
- Equity at exit
- $12,696
- IRR
- 22.9%
- Equity multiple
- 3.18×
- Total profit
- $37,917
- Equity at exit
- $11,481
Cash invested: $17,360 (down + closing). Projections, not guarantees.
Landlord ↔ Tenant lean methodology
- Overall (STATE)
- 62 Landlord-Friendly
- State Pennsylvania
- 62 Landlord-Friendly · EVEN
- County
- — inherits STATE
- City
- — inherits STATE
ZIP-level market 16686
- Home prices YoY
- -0.7%
- Active inventory
- 51
- Price-to-rent
- 5.4×
Monthly cashflow live
- Estimated rent
- $948 medium interval (Pro) →
- Mortgage (P&I)
- −$325
- Tax from tax record
- −$102 /mo · $1,220/yr
- Insurance
- −$26
- HOA
- −$0
- Vacancy / Maint / Mgmt
- −$199
- Net cashflow
- $297
Break-even live
UW: 25.0% down · 7.5% · 30yr · 1.5% tax · 5.0% vac · 8.0% maint · 8.0% mgmt
Financing live
Cash to close
- Down payment
- $15,500
- Closing costs
- $1,860
- Reserves months
- —
- Total cash needed
- —
Loan-product check · same deal, 3 products live
Conventional
25% down · 7.5% · 30yr
- Down + closing
- —
- Monthly P&I
- —
- Monthly cashflow
- —
- DSCR
- —
- Eligible?
- —
Personal DTI + credit; lowest rate.
DSCR
20% down · 8.5% · 30yr
- Down + closing
- —
- Monthly P&I
- —
- Monthly cashflow
- —
- DSCR
- —
- Eligible?
- —
No personal income docs; deal must DSCR.
Hard money
10% down · 12.0% · 12mo
- Down + closing
- —
- Monthly P&I
- —
- Monthly cashflow
- —
- DSCR
- —
- Eligible?
- —
Short-term bridge; refi at stabilization.
Listing history 21 events
-
2026-06-19days on market $62,000 Active 104 DOM
-
2026-06-18days on market $62,000 Active 103 DOM
-
2026-06-17days on market $62,000 Active 102 DOM
-
2026-06-16days on market $62,000 Active 101 DOM
-
2026-06-15days on market $62,000 Active 100 DOM
-
2026-06-14days on market $62,000 Active 98 DOM
-
2026-06-13days on market $62,000 Active 97 DOM
-
2026-06-10days on market $62,000 Active 95 DOM
-
2026-06-09days on market $62,000 Active 94 DOM
-
2026-06-08days on market $62,000 Active 93 DOM
-
2026-06-07days on market $62,000 Active 92 DOM
-
2026-06-05days on market $62,000 Active 89 DOM
-
2026-06-02pricestatusdays on market $62,000 Active 87 DOM
-
2026-05-06status Pending 611-char remark
Show marketing remark (611 chars)
This half-double home offers a fantastic opportunity for both savvy investors looking to add to their portfolio and first-time buyers eager to build sweat equity. The layout is thoughtfully designed for convenience, featuring a sought-after main-floor bedroom paired with a full bathroom on the same level, making it ideal for those seeking single-floor living options. This home has a new roof as of May 2025, in addition to a newer furnace. While the home requires a few cosmetic upgrades and personal touches to truly shine, its solid bones and functional floor plan provide a perfect canvas for your vision.
-
2026-02-09$65,000 Active 611-char remark
Show marketing remark (611 chars)
This half-double home offers a fantastic opportunity for both savvy investors looking to add to their portfolio and first-time buyers eager to build sweat equity. The layout is thoughtfully designed for convenience, featuring a sought-after main-floor bedroom paired with a full bathroom on the same level, making it ideal for those seeking single-floor living options. This home has a new roof as of May 2025, in addition to a newer furnace. While the home requires a few cosmetic upgrades and personal touches to truly shine, its solid bones and functional floor plan provide a perfect canvas for your vision.
-
2026-01-30historical
-
2025-10-09price $67,000
-
2025-10-09price $67,000
-
2025-07-10$70,000 Active
-
2011-07-05$42,000
-
1999-09-01soldstatus $9,000
ⓘ Source: listings_history table (triggers on properties + properties_extension) + one-shot
backfill from property_details.listing_events for pre-trigger history.
Tax reassessment forecast PA · Partial reset (capped growth)
- Current annual tax
- $1,220 · $102/mo
- Projected year-2 tax
- $1,220 · $102/mo
- Expected delta
- $0/yr ($0/mo · 0.0%)
ⓘ Screening estimate from a state-policy table — verify with the county assessor before closing.
Climate risk First Street
- Flood 4/10 Moderate FEMA zone X (unshaded) · 22% chance over 30 yrs
- Wildfire 1/10 Low
- Heat 4/10 Moderate 8 d/yr ≥96°F today · 19 d/yr by 30 yrs out
- Wind 2/10 Low
- Air quality 2/10 Low 1 unhealthy d/yr today · 2 by 30 yrs out
Nearby sold comps map
Loading sold comps map…
Walkable amenities ~0.75 mi
Loading nearby amenities…
Taxation est. · year 1
- Rental income
- $11,381
- − Mortgage interest
- −$3,473
- − Property taxes
- −$1,220
- − Insurance
- −$310
- − Repairs & maintenance
- −$910
- − Management
- −$910
- − Depreciation
- −$1,804
- Taxable income
- $2,753
- Est. tax owed @ 24.0%
- −$661
- After-tax cash flow
- $2,898/yr
For passive investors: Depreciation is non-cash, so a rental often shows a tax loss while cash-flowing — sheltering income. Rental losses are passive: they offset passive income freely, and up to $25,000/yr can offset ordinary (W-2) income if you actively participate and your MAGI is under $100k (phasing out to $0 by $150k); unused losses carry forward. On sale, claimed depreciation is recaptured at up to 25%, and gains may owe capital-gains tax (a 1031 exchange can defer both). Figures are a year-1 estimate at your 24.0% rate — not tax advice; consult a CPA.
Schools (NCES district)
- District
- Tyrone Area SD
- NCES district ID
- 4224030
- Math proficiency
- 35% ▼ -10.00%
- Reading proficiency
- 57% ▼ -14.00%
- Median HH income
- $45,447
- Composite
- 38.94/100
- National rank
- #4089
- State rank
- #263 of 539 in PA
Livability — Tyrone
- Score
- 77/100
- State rank
- #319
- US rank
- #2838
Category grades
Schools grade is shown separately in the Schools card above.
Census & demographics
- Census place
- Tyrone, PA
- City population
- 13,000
- Population (ZIP)
- 13,000
Population outlook (Blair County) Hauer SSP2
- Today (2025)
- 121,571 people
- By 2030
- 117,966 · -3.0%
- By 2040
- 109,174 · -10.2%
- By 2050
- 99,542 · -18.1%
- By 2075
- 76,775 · -36.8%
- By 2100
- 54,326 · -55.3%
Race, ethnicity, and origin ACS 2023
- Neighborhood character
- Predominantly White (96%)
- Race & ethnicity
- White 96% Two or more races 2% Hispanic / Latino 2%
- Common ancestry
- Romanian 3% Slovak 2% Subsaharan African 1%
- Foreign-born
- 1%
- Languages at home
- 97% English-only · German/W. Germanic 2% Spanish 1%
Political lean MEDSL · Blair
- 2024 margin
- Solid R (+43.5) · D 27.9% · R 71.4%
- 2008→2024 swing
- -19.2pp toward R · 2008: -24.3pp · 2024: -43.5pp
- All cycles
- 2024: R+43.5 2020: R+43.5 2016: R+46.4 2012: R+33.5 2008: R+24.3
Not yet ingested
- Civics
- —
Market trends
- HPI YoY
- ▼ -1.77%
- Current HPI
- 254.3042
- Rent YoY
- —
- Metro
- —
- State GDP YoY
- ▲ 1.68%
- F500 in state
- 34
Industry mix (Fortune 500 HQ in PA)
| Industry | F500 HQs | Revenue |
|---|---|---|
| Healthcare | 2 | $309B |
|
||
| Insurance | 2 | $27B |
|
||
| Telecommunications / Media | 1 | $124B |
|
||
| Industrial Distribution | 1 | $22B |
|
||
| Financial Services | 1 | $20B |
|
||
| Chemicals / Materials | 1 | $18B |
|
||
Price history
+622.2% since first listed8 events — show timeline
- 2026-05-06 Pending — AHARMLS
- 2026-02-09 Listed $65,000 AHARMLS
- 2026-01-30 Listing Removed — BRIGHT MLS
- 2025-10-09 Price Changed $67,000 BRIGHT MLS
- 2025-10-09 Price Changed $67,000 AHARMLS
- 2025-07-10 Listed $70,000 BRIGHT MLS
- 2011-07-05 Listed $42,000 AHARMLS
- 1999-09-01 Sold (Public Records) $9,000 Public Records
Property tax history
+6.6%/yrLatest (2025): $1,220 · +7.1% YoY. Source: county tax records.
Cash-flow waterfall
monthlySold comps — $/sqft
last 12 mo · ≤1 miLoading sold comps…