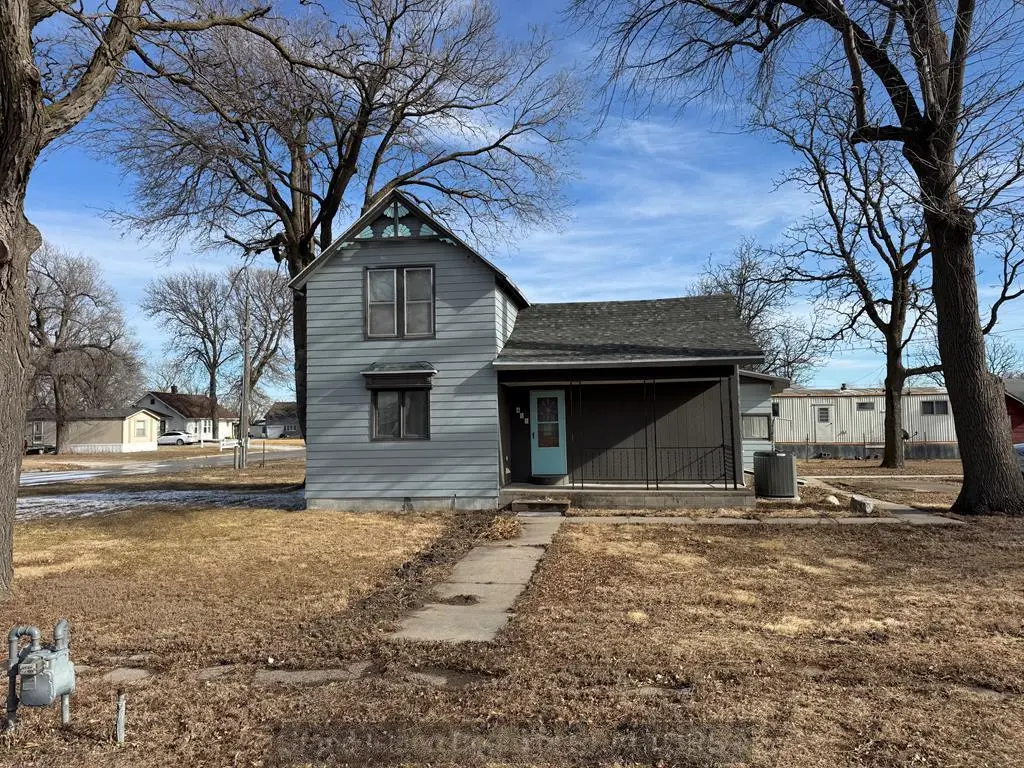
411 East St · Wood River, NE
Flood risk 1/10 · Minimal
- FEMA flood zone
- X (unshaded)
- Chance of flooding over 30 yrs
- 0.0%
- Est. flood insurance / yr
- $507 – $1,088
Fire risk 1/10 · Minimal
- Est. fire insurance / yr
- $1,161 – $2,155
Heat risk 3/10 · Minor
- Hot days now (above 101°F)
- 7 days/yr
- Hot days in 30 yrs
- 16 days/yr
Wind risk 2/10 · Minimal
- Chance of severe wind over 30 yrs
- —
Air-quality risk 2/10 · Minimal
- Unhealthy air days now
- 1 days/yr
- Unhealthy air days in 30 yrs
- 1 days/yr
Risk factors via First Street. Map © Google.
Why this score? — see what drove the D+ grade
The composite is a weighted blend of 9 inputs, each scored 0–100. Each bar is that input's sub-score; the figure is the points it added to the 100-point composite (weight × sub-score).
- Cash flow +13.6/30.0
- ARV discount +12.0/15.0
- Schools +4.5/10.0
- DSCR +4.1/10.0
- Livability +3.8/5.0
- 1% rule +3.0/10.0
- Rent growth +2.5/5.0
- Condition / age +2.5/5.0
- Appreciation +0.0/10.0
$209,000
🖨 Deal sheet (PDF) 📄 Offer letter ✓ Due diligence
Listing remarks MLS
Spacious 1.5-story home offering 4 bedrooms and 2 baths on a large lot with low taxes. Features a comfortable living room area, formal dining room, and a large kitchen with walk-in pantry. Three bedrooms are located on the main floor, with the primary bedroom privately situated upstairs. Partial fencing adds convenience and flexibility for outdoor use. Mechanical systems are housed in an outside cellar. Recent updates include a 3-year-old roof, 7-year-old HVAC system, and a new water heater. A great opportunity for comfortable living with room to grow, both inside and out. BUYERS AGENT WELCOME.
Key facts
- Partial fencing
- Large lot
- Outside cellar
Tags
Neighborhood map
What this means for you Summary
Snapshot
- This is a 4-bed/1.0-bath single-family listed at $209k.
Deal economics
- At list price, monthly cash flow is $11 ($135/yr) — positive.
- The deal already cash-flows at list — no discount required.
- To meet the 1% rule (rent ≥ 1% of price), the offer needs to be $168k (19.7% below list).
- Recommended offer: $168k (19.7% below list) — sets the bar for 1% rule.
Location & tenants
- Location reads 76/100 on livability (#80 in NE, #3,419 nationally) — a middle-class / working-renter tenant base. Strengths: crime A+, cost of living A+, housing A+; Watch: amenities F, commute F.
- Wood River Rural Schools (rural): math 54% / reading 51% proficiency, ranked #54 of 111 in NE (top 49%) — acceptable for families but not a draw, mixed tenant base, ~2y average lease.
- Zoned schools: Wood River Elementary School (math 52% / reading 52%, grade C-, #200 of 502 statewide, top 46%, 230 students, 47% FRL); Wood River Rural Middle School (math 52% / reading 37%, grade D, #65 of 128 statewide, top 53%, 126 students, 47% FRL); Wood River Rural High School (math 64% / reading 84%, grade B+, #10 of 261 statewide, top 4%, 154 students, 52% FRL).
- Market conditions: 19 active listings in the ZIP; 246 units permitted in Hall County in 2024 (98 in 5+ unit buildings).
Forward outlook
- Local home prices are declining (-3.0%/yr); year-one equity from $1k of loan paydown is wiped out by about $6k of value loss. Plan a longer hold.
- Hall County population projected at +27% by 2050 — long-run rental-demand tailwind backs the buy-and-hold thesis.
Negotiation context
- It's been on market 145 days — a 12% lower offer ($184k) is reasonable based on typical stale-listing flexibility.
- Current owner paid $129k; list at $209k implies a 62% gain — meaningful room to come down on a strong offer.
Risks & watch-outs
- Watch-outs: built in 1910 — expect roof / HVAC / electrical / plumbing capex.
Questions for the listing agent
- It's been on market 145 days. Have you received any prior offers? Is the seller open to a 20% concession, seller financing, or rate buy-down credit?
- Built in 1910 — when were the roof, HVAC, electrical panel, plumbing, and water heater last replaced?
- Why hasn't it sold? Are there any deal-killer items the seller is aware of (foundation, flood, title, zoning, code violations)?
- Is there a deadline driving the sale (1031 exchange, divorce, estate, relocation)? That informs how much negotiation room exists.
- The area grade is low — what's the realistic commute time and amenity access for the typical tenant pool here? Any planned neighborhood developments (good or bad) we should know about?
- What's the average days-on-market for RENTAL listings here right now (not sales)? A rising rental-DOM trend means longer vacancies and softer asking-rent achievability than the comps imply.
- What's the recent tenant-quality profile in this submarket — average credit score on applications, eviction rate, late-payment / NSF rate, and stable-employment percentage? A property-management company in the area should have these aggregated.
- How much new for-sale + rental construction is in the pipeline within 1–3 miles? Heavy new supply typically softens prices + rents 12–24 months out; constrained supply supports both.
Investment metrics
- 1% rule
- 0.80% ✗
- Cap rate
- 6.36%
- Cash-on-cash
- 0.23%
- DSCR
- 1.01
- GRM
- 10.4
CMA / ARV
- ARV (median comp)
- $232,149
- List price
- $209,000
- Delta
- -9.97%
- Verdict
- FAIR
- Comps
- 13 within 1.0 mi
Show comp detail 3 sales within ~0.75 mi
| Address | Dist | Beds/Ba | Sqft | Sold | Price | $/sf | Match |
|---|---|---|---|---|---|---|---|
| 312 W 12th St | 0.56mi | 4/1.0 | 1,596 (+4%) | 15mo | $229,000 | $143 | 55 |
| 1212 Walnut St | 0.53mi | 4/2.0 | 1,626 (+6%) | 15mo | $219,000 | $135 | 49 |
| 410 W 13th St | 0.66mi | 3/1.0 (-1) | 1,396 (-9%) | 21mo | $215,000 | $154 | 31 |
Match score weights: distance 35% · size 25% · config 20% · recency 20%. Top-matched comps best support the ARV.
Projected returns pro-forma
-3.0% appreciation · 3.0% rent growth · sell at horizon
- IRR
- -16.0%
- Equity multiple
- 0.43×
- Total profit
- $-33,208
- Equity at exit
- $31,163
- IRR
- -7.6%
- Equity multiple
- 0.52×
- Total profit
- $-28,220
- Equity at exit
- $18,071
Cash invested: $58,520 (down + closing). Projections, not guarantees.
Landlord ↔ Tenant lean methodology
- Overall (STATE)
- 83 Strongly Landlord-Friendly
- State Nebraska
- 83 Strongly Landlord-Friendly · R+13
- County
- — inherits STATE
- City
- — inherits STATE
ZIP-level market 68883
- Home prices YoY
- -17.2%
- Active inventory
- 19
- Price-to-rent
- 10.4×
Monthly cashflow live
- Estimated rent
- $1,678 medium interval (Pro) →
- Mortgage (P&I)
- −$1,096
- Tax from tax record
- −$131 /mo · $1,571/yr
- Insurance
- −$87
- HOA
- −$0
- Vacancy / Maint / Mgmt
- −$352
- Net cashflow
- $11
Break-even live
Sensitivity live
| Price | -10% $130 | -5% $70 | +0% $11 | +5% $-48 | +10% $-107 |
|---|---|---|---|---|---|
| Rent | -10% $-121 | -5% $-55 | +0% $11 | +5% $77 | +10% $144 |
| Rate | -1.0pp $116 | -0.5pp $64 | base $11 | +0.5pp $-43 | +1.0pp $-98 |
UW: 25.0% down · 7.5% · 30yr · 1.5% tax · 5.0% vac · 8.0% maint · 8.0% mgmt
Financing live
Cash to close
- Down payment
- $52,250
- Closing costs
- $6,270
- Reserves months
- —
- Total cash needed
- —
Loan-product check · same deal, 3 products live
Conventional
25% down · 7.5% · 30yr
- Down + closing
- —
- Monthly P&I
- —
- Monthly cashflow
- —
- DSCR
- —
- Eligible?
- —
Personal DTI + credit; lowest rate.
DSCR
20% down · 8.5% · 30yr
- Down + closing
- —
- Monthly P&I
- —
- Monthly cashflow
- —
- DSCR
- —
- Eligible?
- —
No personal income docs; deal must DSCR.
Hard money
10% down · 12.0% · 12mo
- Down + closing
- —
- Monthly P&I
- —
- Monthly cashflow
- —
- DSCR
- —
- Eligible?
- —
Short-term bridge; refi at stabilization.
Listing history 19 events
-
2026-06-22days on market $209,000 Active 145 DOM
-
2026-06-21days on market $209,000 Active 144 DOM
-
2026-06-19days on market $209,000 Active 142 DOM
-
2026-06-18days on market $209,000 Active 141 DOM
-
2026-06-17days on market $209,000 Active 140 DOM
-
2026-06-16days on market $209,000 Active 139 DOM
-
2026-06-15days on market $209,000 Active 138 DOM
-
2026-06-14days on market $209,000 Active 136 DOM
-
2026-06-12days on market $209,000 Active 135 DOM
-
2026-06-09days on market $209,000 Active 132 DOM
-
2026-06-08days on market $209,000 Active 131 DOM
-
2026-06-07days on market $209,000 Active 130 DOM
-
2026-06-05days on market $209,000 Active 127 DOM
-
2026-06-02days on market $209,000 Active 125 DOM
-
2026-06-01days on market $209,000 Active 124 DOM
-
2026-05-31days on market $209,000 Active 123 DOM
-
2026-05-30days on market $209,000 Active 122 DOM
-
2026-01-27$209,000 Active 601-char remark
Show marketing remark (601 chars)
Spacious 1.5-story home offering 4 bedrooms and 2 baths on a large lot with low taxes. Features a comfortable living room area, formal dining room, and a large kitchen with walk-in pantry. Three bedrooms are located on the main floor, with the primary bedroom privately situated upstairs. Partial fencing adds convenience and flexibility for outdoor use. Mechanical systems are housed in an outside cellar. Recent updates include a 3-year-old roof, 7-year-old HVAC system, and a new water heater. A great opportunity for comfortable living with room to grow, both inside and out. BUYERS AGENT WELCOME.
-
2025-08-27soldstatus $128,889
ⓘ Source: listings_history table (triggers on properties + properties_extension) + one-shot
backfill from property_details.listing_events for pre-trigger history.
Tax reassessment forecast NE · Resets to sale price
- Current annual tax
- $1,571 · $131/mo
- Projected year-2 tax
- $3,616 · $301/mo
- Expected delta
- +$2,044/yr (+$170/mo · 130.1%)
ⓘ Screening estimate from a state-policy table — verify with the county assessor before closing.
Climate risk First Street
- Flood 1/10 Low FEMA zone X (unshaded) · 0% chance over 30 yrs
- Wildfire 1/10 Low
- Heat 3/10 Moderate 7 d/yr ≥101°F today · 16 d/yr by 30 yrs out
- Wind 2/10 Low
- Air quality 2/10 Low 1 unhealthy d/yr today · 1 by 30 yrs out
Nearby sold comps map
Loading sold comps map…
Walkable amenities ~0.75 mi
Loading nearby amenities…
Taxation est. · year 1
- Rental income
- $20,130
- − Mortgage interest
- −$11,707
- − Property taxes
- −$1,571
- − Insurance
- −$1,045
- − Repairs & maintenance
- −$1,610
- − Management
- −$1,610
- − Depreciation
- −$6,080
- Taxable loss
- −$3,494
- Est. tax savings @ 24.0%
- +$839
- After-tax cash flow
- $973/yr
For passive investors: Depreciation is non-cash, so a rental often shows a tax loss while cash-flowing — sheltering income. Rental losses are passive: they offset passive income freely, and up to $25,000/yr can offset ordinary (W-2) income if you actively participate and your MAGI is under $100k (phasing out to $0 by $150k); unused losses carry forward. On sale, claimed depreciation is recaptured at up to 25%, and gains may owe capital-gains tax (a 1031 exchange can defer both). Figures are a year-1 estimate at your 24.0% rate — not tax advice; consult a CPA.
Schools (NCES district)
- District
- Wood River Rural Schools
- NCES district ID
- 3178940
- Math proficiency
- 54% ▼ -6.00%
- Reading proficiency
- 51% ▲ 1.00%
- Median HH income
- $53,943
- Composite
- 45.26/100
- National rank
- #2658
- State rank
- #54 of 111 in NE
Livability — Wood River
- Score
- 76/100
- State rank
- #80
- US rank
- #3419
Category grades
Schools grade is shown separately in the Schools card above.
Census & demographics
- Census place
- Wood River, NE
- Population (ZIP)
- 2,486
Population outlook (Hall County) Hauer SSP2
- Today (2025)
- 68,137 people
- By 2030
- 71,543 · +5.0%
- By 2040
- 78,843 · +15.7%
- By 2050
- 86,765 · +27.3%
- By 2075
- 111,764 · +64.0%
- By 2100
- 137,991 · +102.5%
Race, ethnicity, and origin ACS 2023
- Neighborhood character
- Predominantly White (82%)
- Race & ethnicity
- White 82% Hispanic / Latino 16% Two or more races 6%
- Hispanic origin (detail)
- Mexican 14%
- Common ancestry
- Romanian 4% Slovak 2% Iranian 2%
- Foreign-born
- 4% · Canada
- Languages at home
- 91% English-only · Spanish 9%
Political lean MEDSL · Hall
- 2024 margin
- Solid R (+37.8) · D 30.5% · R 68.3% · Other 1.2%
- 2008→2024 swing
- -13.7pp toward R · 2008: -24.1pp · 2024: -37.8pp
- All cycles
- 2024: R+37.8 2020: R+34.8 2016: R+37.5 2012: R+27.6 2008: R+24.1
Not yet ingested
- Civics
- —
Market trends
- HPI YoY
- ▼ -44.40%
- Current HPI
- 213.4538
- Rent YoY
- —
- Metro
- —
- State GDP YoY
- ▲ 0.68%
- F500 in state
- 2
Industry mix (Fortune 500 HQ in NE)
| Industry | F500 HQs | Revenue |
|---|---|---|
| Conglomerate | 1 | $371B |
|
||
Price history
+62.2% since first listed2 events — show timeline
- 2026-01-27 Listed $209,000 GIBOR
- 2025-08-27 Sold (Public Records) $128,889 Public Records
Property tax history
+0.9%/yrLatest (2025): $1,571 · -10.6% YoY. Source: county tax records.
Cash-flow waterfall
monthlySold comps — $/sqft
last 12 mo · ≤1 miLoading sold comps…