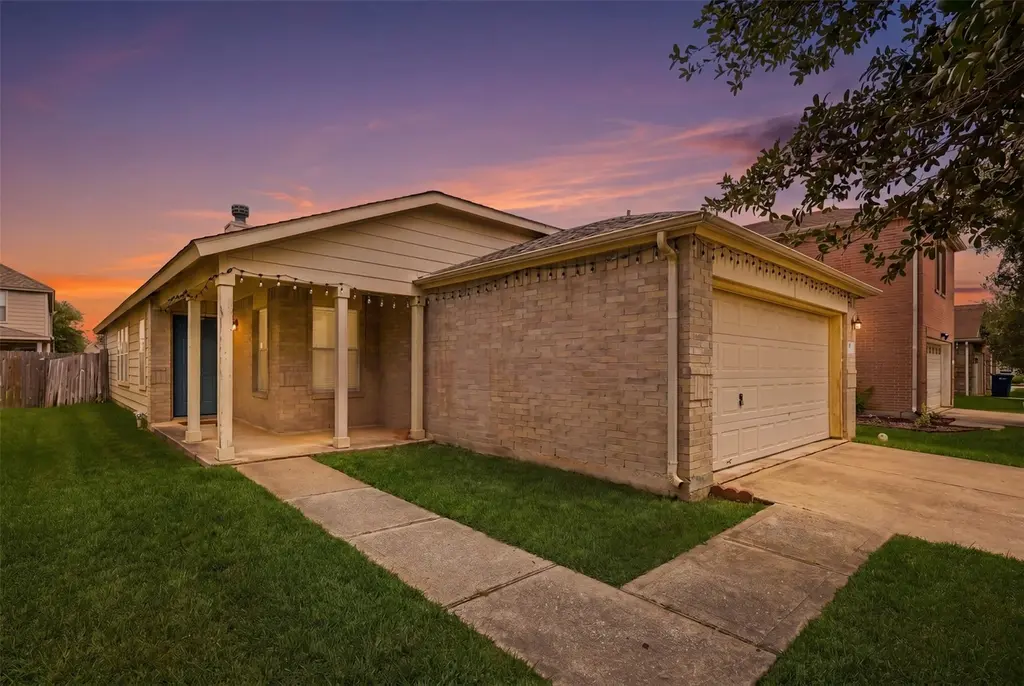
3010 Swift Brook Glen Way · Houston, TX
Flood risk 1/10 · Minimal
- FEMA flood zone
- X (unshaded)
- Chance of flooding over 30 yrs
- 0.0%
- Est. flood insurance / yr
- $507 – $1,088
Fire risk 4/10 · Minor
- Est. fire insurance / yr
- $1,222 – $2,270
Heat risk 9/10 · Severe
- Hot days now (above 110°F)
- 7 days/yr
- Hot days in 30 yrs
- 25 days/yr
Wind risk 8/10 · Major
- Chance of severe wind over 30 yrs
- 99.0%
Air-quality risk 3/10 · Minor
- Unhealthy air days now
- 3 days/yr
- Unhealthy air days in 30 yrs
- 3 days/yr
Risk factors via First Street. Map © Google.
Why this score? — see what drove the D- grade
The composite is a weighted blend of 9 inputs, each scored 0–100. Each bar is that input's sub-score; the figure is the points it added to the 100-point composite (weight × sub-score).
- ARV discount +9.6/15.0
- Cash flow +9.4/30.0
- 1% rule +4.1/10.0
- Schools +4.1/10.0
- Livability +3.7/5.0
- Rent growth +3.0/5.0
- DSCR +2.6/10.0
- Condition / age +2.5/5.0
- Appreciation +0.0/10.0
$227,900
🖨 Deal sheet 📄 Offer letter ✓ Due diligence
Listing remarks MLS
HUD Home.CASE #493-815012. SOLD AS-IS. PRICE REDUCED! Home features a fireplace in a spacious Family room, the community features a Lake entry with Fountains and great amenities. Residents enjoy volleyball and basketball courts & walking trails. SQUARE FOOTAGE INFORMATION IS FROM THE FHA APPRAISAL AND IS DEEMED RELIABLE BUT NOT GUARANTEED
Key facts
- 2 garage spots
- Built 2006
- Listed 44 days
Property features AI
Finance
- HOA & community: Association: Spectrum; Annual association fee; Playground, park, tennis courts; Curbs and gutters in community
Exterior
- Parking: Attached 2-car garage
- Utilities: Public water; Public sewer
- Home design: Residential property; One-story; Slab foundation; Composition roof
- Construction: Brick and cement siding construction; Built in 2006
- Exterior features: Fenced private yard; Back yard fencing; Cleared lot; Subdivision; Concrete road surface
Interior
- Kitchen: Dishwasher; Electric oven; Gas cooktop; Garbage disposal; Microwave
- Bedrooms: Primary bedroom (First level); Bedroom (First level); Bedroom (First level)
- Flooring: Carpet; Tile
- Bathrooms: 2 full bathrooms
- Heating & cooling: Central heating (Gas); Central air (Electric)
- Interior features: Breakfast bar; Solid surface counters; Walk-in pantry; Ceiling fan(s); Kitchen/dining combo; Wood-burning fireplace (1)
- Laundry & utility: Washer hookup; Electric dryer hookup; Utility room (First level)
Neighborhood map
What this means for you Summary
Snapshot
- This is a 3-bed/2.0-bath single-family listed at $228k.
Deal economics
- At list price, monthly cash flow is $-162 ($-2k/yr) — negative.
- To cash-flow at today's rent, offer at most $199k (12.6% below list).
- To meet the 1% rule (rent ≥ 1% of price), the offer needs to be $208k (8.8% below list).
- Recommended offer: $199k (12.6% below list) — sets the bar for cash-flow.
- Cap rate 5.4% vs local median 3.2% in Houston — top-decile yield for the area; either an underpriced asset or a hidden risk that comps aren't pricing in. Stress-test before assuming the spread holds.
Location & tenants
- Location reads 74/100 on livability (#184 in TX, #4,771 nationally) — a middle-class / working-renter tenant base. Strengths: amenities A+, cost of living A+, housing A+; Watch: crime F.
- Klein ISD (suburban): math 41% / reading 48% proficiency, ranked #213 of 826 in TX (top 26%) — families likely to look elsewhere, expect single-tenant / working-renter base with shorter leases.
- Zoned schools: Hildebrandt Int (math 35% / reading 42%, grade F, #704 of 1,662 statewide, top 43%, 1,046 students, 53% FRL); Klein Collins H S (math 40% / reading 55%, grade D, #583 of 1,632 statewide, top 36%, 3,422 students, 45% FRL).
- Market conditions: Rents rising (+1.9%/yr); 383 active listings in the ZIP; 17 comparable units currently listed for rent nearby; rentals leasing fast (median 8d on market — plan ~1-2 weeks tenant-placement turnaround); high-income renter base; 29,883 units permitted in Harris County in 2024 (8,621 in 5+ unit buildings).
- This rent is only 18% of the median local income ($141k/yr) — well below the 30% rent-burden line; pricing power to push rent on renewal without tenant pushback.
Forward outlook
- Local home prices are declining (-3.0%/yr); year-one equity from $2k of loan paydown is wiped out by about $7k of value loss. Plan a longer hold.
- Harris County population projected at +47% by 2050 — long-run rental-demand tailwind backs the buy-and-hold thesis.
Negotiation context
- It's been on market 45 days — a 3% lower offer ($221k) is reasonable based on typical stale-listing flexibility.
- 3 sale attempts since 18y ago with the ask held roughly flat each time — persistent listings suggest the price (not the market) is what's stuck; bring a comps-based counter.
Risks & watch-outs
- Climate carrying-cost: severe wind risk, 99% chance of damaging wind over 30y; extreme-heat days projected 7→25/yr by 2055 (HVAC capex compounding) — expect insurance premiums to compound above CPI over the hold.
Questions for the listing agent
- What do current leases actually rent for vs. the listed asking? Can we see a recent rent roll and the last 12 months of T-12 income?
- It's been on market 45 days. Have you received any prior offers? Is the seller open to a 13% concession, seller financing, or rate buy-down credit?
- What does the HOA fee cover, when was the last increase, and are there any pending special assessments or reserve-fund shortfalls?
- Is there a deadline driving the sale (1031 exchange, divorce, estate, relocation)? That informs how much negotiation room exists.
- Schools are D-rated, which usually means shorter tenancies and higher turnover. Who's the typical renter profile here, and what's been the actual vacancy rate?
- Crime grade is F in this area — have there been break-ins, vandalism, or insurance claims at this property in the last 3 years? What carrier currently insures it and at what premium?
- The area grade is low — what's the realistic commute time and amenity access for the typical tenant pool here? Any planned neighborhood developments (good or bad) we should know about?
- What's the average days-on-market for RENTAL listings here right now (not sales)? A rising rental-DOM trend means longer vacancies and softer asking-rent achievability than the comps imply.
- What's the recent tenant-quality profile in this submarket — average credit score on applications, eviction rate, late-payment / NSF rate, and stable-employment percentage? A property-management company in the area should have these aggregated.
- How much new for-sale + rental construction is in the pipeline within 1–3 miles? Heavy new supply typically softens prices + rents 12–24 months out; constrained supply supports both.
Investment metrics
- 1% rule
- 0.91% ✗
- Cap rate
- 5.44%
- Cash-on-cash
- -3.05%
- DSCR
- 0.86
- GRM
- 9.1
CMA / ARV
- ARV (median comp)
- $239,234
- List price
- $227,900
- Delta
- -4.74%
- Verdict
- FAIR
- Comps
- 20 within 1.0 mi
Show comp detail 12 sales within ~0.75 mi
| Address | Dist | Beds/Ba | Sqft | Sold | Price | $/sf | Match |
|---|---|---|---|---|---|---|---|
| 2906 Tall Tree Ridge Way | 0.09mi | 3/2.0 | 1,432 (-10%) | 7mo | $220,000 | $154 | 73 |
| 21719 Long Castle Dr | 0.36mi | 3/2.0 | 1,701 (+6%) | 1mo | $290,000 | $170 | 72 |
| 3115 Peachstone Pl | 0.10mi | 3/2.0 | 1,404 (-12%) | 5mo | $232,000 | $165 | 71 |
| 3519 Acorn Way Ln | 0.41mi | 4/2.0 (+1) | 1,576 (-2%) | 4mo | $255,000 | $162 | 70 |
| 21807 Glenbranch Dr | 0.36mi | 3/2.0 | 1,702 (+6%) | 7mo | $265,000 | $156 | 67 |
| 2918 Beacon Grove St | 0.21mi | 3/2.0 | 1,406 (-12%) | 7mo | $219,999 | $156 | 64 |
| 2326 Fern Lacy Dr | 0.60mi | 3/2.0 | 1,491 (-7%) | 0mo | $265,000 | $178 | 60 |
| 22303 Acorn Chase Dr | 0.63mi | 4/2.0 (+1) | 1,560 (-2%) | 7mo | $204,999 | $131 | 56 |
| 3702 Acorn Way Ln | 0.58mi | 3/2.0 | 1,435 (-10%) | 6mo | $249,000 | $174 | 51 |
| 22306 Acorn Valley Dr | 0.65mi | 4/2.0 (+1) | 1,476 (-8%) | 3mo | $245,000 | $166 | 49 |
| 3326 Hartfield Ln | 0.66mi | 3/2.0 | 1,452 (-9%) | 6mo | $230,000 | $158 | 49 |
| 21330 Greenham Dr | 0.72mi | 4/2.0 (+1) | 1,782 (+11%) | 2mo | $309,900 | $174 | 41 |
Match score weights: distance 35% · size 25% · config 20% · recency 20%. Top-matched comps best support the ARV.
Projected returns pro-forma
-3.0% appreciation · 1.94% rent growth · sell at horizon
- IRR
- -22.7%
- Equity multiple
- 0.23×
- Total profit
- $-49,290
- Equity at exit
- $33,981
- IRR
- -20.1%
- Equity multiple
- -0.01×
- Total profit
- $-64,346
- Equity at exit
- $19,705
Cash invested: $63,812 (down + closing). Projections, not guarantees.
Landlord ↔ Tenant lean methodology
- Overall (STATE)
- 87 Strongly Landlord-Friendly
- State Texas
- 87 Strongly Landlord-Friendly · R+5
- County
- — inherits STATE
- City
- — inherits STATE
ZIP-level market 77389
- Rents YoY
- 1.9%
- Active inventory
- 383
- Price-to-rent
- 9.1×
Monthly cashflow live
- Estimated rent
- $2,079 high interval (Pro) →
- Mortgage (P&I)
- −$1,195
- Tax from tax record
- −$469 /mo · $5,626/yr
- Insurance
- −$95
- HOA
- −$46
- Vacancy / Maint / Mgmt
- −$437
- Net cashflow
- $-162
Break-even live
UW: 25.0% down · 7.5% · 30yr · 1.5% tax · 5.0% vac · 8.0% maint · 8.0% mgmt
Financing live
Cash to close
- Down payment
- $56,975
- Closing costs
- $6,837
- Reserves months
- —
- Total cash needed
- —
Loan-product check · same deal, 3 products live
Conventional
25% down · 7.5% · 30yr
- Down + closing
- —
- Monthly P&I
- —
- Monthly cashflow
- —
- DSCR
- —
- Eligible?
- —
Personal DTI + credit; lowest rate.
DSCR
20% down · 8.5% · 30yr
- Down + closing
- —
- Monthly P&I
- —
- Monthly cashflow
- —
- DSCR
- —
- Eligible?
- —
No personal income docs; deal must DSCR.
Hard money
10% down · 12.0% · 12mo
- Down + closing
- —
- Monthly P&I
- —
- Monthly cashflow
- —
- DSCR
- —
- Eligible?
- —
Short-term bridge; refi at stabilization.
Rent comps 17 comps
| Address | Beds | Baths | Sqft | Rent | $/sqft | DOM | Units | Dist |
|---|---|---|---|---|---|---|---|---|
| 3402 Almondwood Dr Spring, TX | 3.0 | 2.0 | 1414 | $1,795 | $1.27 | 12d | 1 | 0.30mi |
| 3607 Nutwood Ln Spring, TX | 3.0 | 3.0 | 1299 | $2,399 | $1.85 | 43d | 1 | 0.54mi |
| 21771 Mossy Field Ln Spring, TX | 3.0 | 3.0 | 1631 | $2,150 | $1.32 | 43d | 1 | 0.91mi |
| 21400 Big Spring Valley Ave Spring, TX | 1.0–3.0 | 1.0–2.5 | 1074 | $2,370 | $2.21 | 2d | 67 | 0.94mi |
| 4018 Falvel Shadow Creek Dr Spring, TX | 4.0 | 2.0 | 1458 | $1,960 | $1.34 | 11d | 1 | 1.04mi |
| 4209 Spring Stuebner Rd Unit 4242 Spring, TX | 3.0 | 2.0 | 1584 | $2,210 | $1.40 | 11d | 1 | 1.11mi |
| 4209 Spring Stuebner Rd Unit 4246 Spring, TX | 2.0 | 2.0 | 1277 | $1,990 | $1.56 | 11d | 1 | 1.11mi |
| 4209 Spring Stuebner Rd Unit 3228 Spring, TX | 3.0 | 2.0 | 1584 | $2,178 | $1.38 | 3d | 1 | 1.11mi |
| 4209 Spring Stuebner Rd Unit 424 Spring, TX | 2.0 | 2.0 | 1277 | $1,966 | $1.54 | 7d | 1 | 1.11mi |
| 4209 Spring Stuebner Rd Unit 2228 Spring, TX | 2.0 | 2.0 | 1277 | $1,958 | $1.53 | 3d | 1 | 1.11mi |
| 2953 FM 2920 Rd Spring, TX | 1.0–3.0 | 1.0–2.0 | 996 | $2,280 | $2.29 | 2d | 23 | 1.12mi |
| 2555 Farm to Market 2920 Spring, TX | 1.0–2.0 | 1.0–2.0 | 935 | $1,941 | $2.07 | 2d | 12 | 1.14mi |
| 3899 Farm to Market 2920 Unit 2920 Spring, TX | 2.0 | 2.0 | 1149 | $1,796 | $1.56 | 12d | 1 | 1.28mi |
| 3869 Farm to Market 2920 Unit 2920 Spring, TX | 2.0 | 2.0 | 1056 | $1,774 | $1.68 | 24d | 1 | 1.29mi |
| 3880 Farm to Market 2920 Spring, TX | 1.0–3.0 | 1.0–2.0 | 1037 | $2,536 | $2.45 | 2d | 29 | 1.32mi |
| 2539 Spring Cypress Rd Spring, TX | 1.0–3.0 | 1.0–3.0 | 1086 | $2,214 | $2.04 | 2d | 20 | 1.42mi |
| 4114 Farm to Market 2920 Spring, TX | 1.0–2.0 | 1.0–2.0 | 964 | $2,146 | $2.22 | 2d | 24 | 1.49mi |
HOA detail
- Monthly dues
- $46 · $552/yr
Listing history 20 events
-
2026-06-18days on market $227,900 Active 45 DOM
-
2026-06-17days on market $227,900 Active 44 DOM
-
2026-06-16days on market $227,900 Active 43 DOM
-
2026-06-15days on market $227,900 Active 42 DOM
-
2026-06-13days on market $227,900 Active 40 DOM
-
2026-06-09days on market $227,900 Active 36 DOM
-
2026-06-08days on market $227,900 Active 35 DOM
-
2026-06-07days on market $227,900 Active 34 DOM
-
2026-06-04days on market $227,900 Active 31 DOM
-
2026-06-03days on market $227,900 Active 30 DOM
-
2026-06-02days on market $227,900 Active 29 DOM
-
2026-06-01days on market $227,900 Active 28 DOM
-
2026-05-31days on market $227,900 Active 27 DOM
-
2026-05-05$227,900 Active 578-char remark
-
2026-05-03historical $227,900 578-char remark
-
2009-07-31soldstatus 347-char remark
Show marketing remark (347 chars)
HUD Home.CASE #493-815012. SOLD AS-IS. PRICE REDUCED! Home features a fireplace in a spacious Family room, the community features a Lake entry with Fountains and great amenities. Residents enjoy volleyball and basketball courts & walking trails. SQUARE FOOTAGE INFORMATION IS FROM THE FHA APPRAISAL AND IS DEEMED RELIABLE BUT NOT GUARANTEED
-
2009-05-18historical 347-char remark
Show marketing remark (347 chars)
HUD Home.CASE #493-815012. SOLD AS-IS. PRICE REDUCED! Home features a fireplace in a spacious Family room, the community features a Lake entry with Fountains and great amenities. Residents enjoy volleyball and basketball courts & walking trails. SQUARE FOOTAGE INFORMATION IS FROM THE FHA APPRAISAL AND IS DEEMED RELIABLE BUT NOT GUARANTEED
-
2009-04-07$83,700 347-char remark
Show marketing remark (347 chars)
HUD Home.CASE #493-815012. SOLD AS-IS. PRICE REDUCED! Home features a fireplace in a spacious Family room, the community features a Lake entry with Fountains and great amenities. Residents enjoy volleyball and basketball courts & walking trails. SQUARE FOOTAGE INFORMATION IS FROM THE FHA APPRAISAL AND IS DEEMED RELIABLE BUT NOT GUARANTEED
-
2009-04-05historical
-
2008-08-12$80,000
ⓘ Source: listings_history table (triggers on properties + properties_extension) + one-shot
backfill from property_details.listing_events for pre-trigger history.
Tax reassessment forecast TX · Resets to sale price
- Current annual tax
- $5,626 · $469/mo
- Projected year-2 tax
- $5,626 · $469/mo
- Expected delta
- $0/yr ($0/mo · 0.0%)
ⓘ Screening estimate from a state-policy table — verify with the county assessor before closing.
Climate risk First Street
- Flood 1/10 Low FEMA zone X (unshaded) · 0% chance over 30 yrs
- Wildfire 4/10 Moderate
- Heat 9/10 Extreme 7 d/yr ≥110°F today · 25 d/yr by 30 yrs out
- Wind 8/10 Severe 99% chance of damaging wind over 30 yrs
- Air quality 3/10 Moderate 3 unhealthy d/yr today · 3 by 30 yrs out
Nearby sold comps map
Loading sold comps map…
Walkable amenities ~0.75 mi
Loading nearby amenities…
Taxation est. · year 1
- Rental income
- $24,951
- − Mortgage interest
- −$12,766
- − Property taxes
- −$5,626
- − Insurance
- −$1,140
- − Repairs & maintenance
- −$1,996
- − Management
- −$1,996
- − HOA
- −$552
- − Depreciation
- −$6,630
- Taxable loss
- −$5,754
- Est. tax savings @ 24.0%
- +$1,381
- After-tax cash flow
- $-567/yr
For passive investors: Depreciation is non-cash, so a rental often shows a tax loss while cash-flowing — sheltering income. Rental losses are passive: they offset passive income freely, and up to $25,000/yr can offset ordinary (W-2) income if you actively participate and your MAGI is under $100k (phasing out to $0 by $150k); unused losses carry forward. On sale, claimed depreciation is recaptured at up to 25%, and gains may owe capital-gains tax (a 1031 exchange can defer both). Figures are a year-1 estimate at your 24.0% rate — not tax advice; consult a CPA.
Schools (NCES district)
- District
- Klein ISD
- NCES district ID
- 4825740
- Math proficiency
- 41% ▼ -12.00%
- Reading proficiency
- 48% ▼ -3.00%
- Median HH income
- $78,288
- Composite
- 40.91/100
- National rank
- #3615
- State rank
- #213 of 826 in TX
Livability — Houston
- Score
- 74/100
- State rank
- #184
- US rank
- #4771
Category grades
Schools grade is shown separately in the Schools card above.
Census & demographics
- County
- Harris County · 4,702,590 people
- City population
- 3,226,434
- Metro
- Houston-The Woodlands-Sugar Land, TX
- Population (ZIP)
- 45,701
- Household income
- $140,683
- Rent vs Own
- Severe rent burden
- 1191.0
Population outlook (Harris County) Hauer SSP2
- Today (2025)
- 5,571,493 people
- By 2030
- 6,089,821 · +9.3%
- By 2040
- 7,142,806 · +28.2%
- By 2050
- 8,185,864 · +46.9%
- By 2075
- 10,574,329 · +89.8%
- By 2100
- 12,109,958 · +117.4%
Race, ethnicity, and origin ACS 2023
- Neighborhood character
- Diverse neighborhood (Simpson 0.62)
- Race & ethnicity
- White 53% Hispanic / Latino 30% Two or more races 15% Black 7% Asian 6%
- Hispanic origin (detail)
- Mexican 19%
- Common ancestry
- Lithuanian 3% Romanian 2% Italian 2%
- Foreign-born
- 22% · Canada, Jamaica, China
- Languages at home
- 69% English-only · Spanish 21% Other Indo-European 4% Russian/Polish/Slavic 1%
Political lean MEDSL · Harris
- 2024 margin
- Lean D (+5.5) · D 52.0% · R 46.4% · Other 1.6%
- 2008→2024 swing
- +3.9pp toward D · 2008: 1.6pp · 2024: 5.5pp
- All cycles
- 2024: D+5.5 2020: D+13.3 2016: D+12.4 2012: D+0.1 2008: D+1.6
Not yet ingested
- Civics
- —
Market trends
- HPI YoY
- ▼ -159.54%
- Current HPI
- 236.5688
- Rent YoY
- ▲ 1.94%
- Metro
- Houston-The Woodlands-Sugar Land, TX
- State GDP YoY
- ▲ 3.95%
- F500 in state
- 110
Industry mix (Fortune 500 HQ in TX)
| Industry | F500 HQs | Revenue |
|---|---|---|
| Energy | 16 | $1,198B |
|
||
| Technology | 5 | $198B |
|
||
| Engineering / Construction | 4 | $72B |
|
||
| Energy Services | 3 | $60B |
|
||
| Utilities | 3 | $41B |
|
||
| Healthcare | 2 | $330B |
|
||
Price history
+184.9% since first listed7 events — show timeline
- 2026-05-05 Listed $227,900 HARMLS
- 2026-05-03 Coming Soon $227,900 HARMLS
- 2009-07-31 Sold (MLS) — HARMLS
- 2009-05-18 Listing Removed — HARMLS
- 2009-04-07 Listed $83,700 HARMLS
- 2009-04-05 Listing Removed — HARMLS
- 2008-08-12 Listed $80,000 HARMLS
Property tax history
+6.3%/yrLatest (2025): $5,626 · +4.6% YoY. Source: county tax records.
Cash-flow waterfall
monthlySold comps — $/sqft
last 12 mo · ≤1 miLoading sold comps…