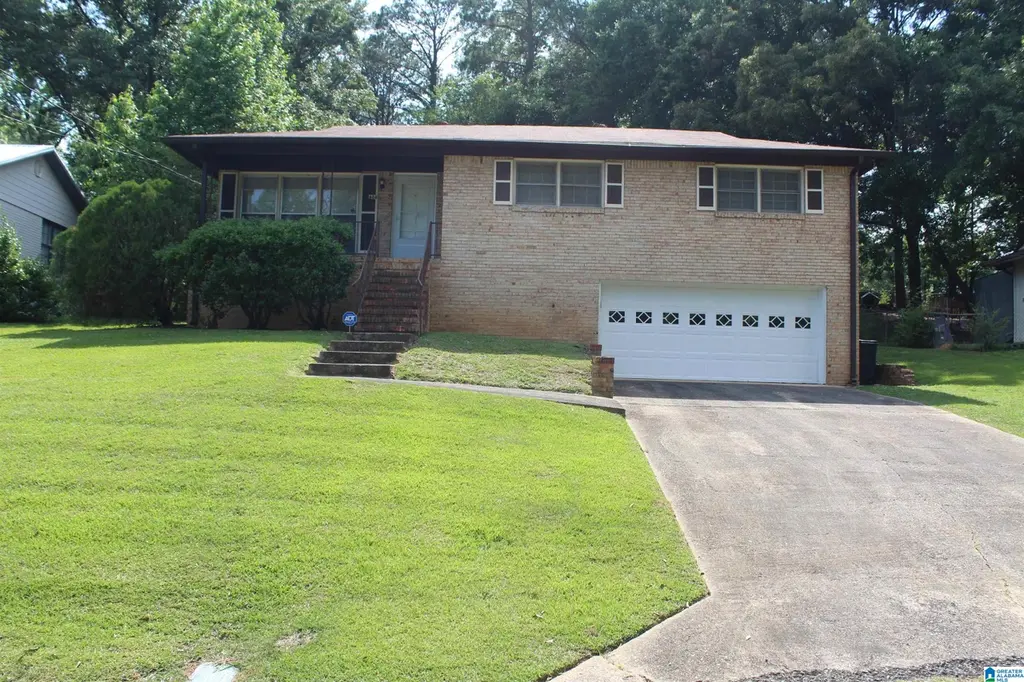
604 Denniston Ln · Adamsville, AL
Flood risk 1/10 · Minimal
- FEMA flood zone
- X (unshaded)
- Chance of flooding over 30 yrs
- 0.0%
- Est. flood insurance / yr
- $473 – $860
Fire risk 4/10 · Minor
- Est. fire insurance / yr
- $916 – $1,700
Heat risk 6/10 · Moderate
- Hot days now (above 107°F)
- 7 days/yr
- Hot days in 30 yrs
- 19 days/yr
Wind risk 6/10 · Moderate
- Chance of severe wind over 30 yrs
- 27.0%
Air-quality risk 3/10 · Minor
- Unhealthy air days now
- 3 days/yr
- Unhealthy air days in 30 yrs
- 5 days/yr
Risk factors via First Street. Map © Google.
Why this score? — see what drove the D+ grade
The composite is a weighted blend of 9 inputs, each scored 0–100. Each bar is that input's sub-score; the figure is the points it added to the 100-point composite (weight × sub-score).
- Cash flow +17.2/30.0
- ARV discount +9.7/15.0
- DSCR +5.3/10.0
- 1% rule +3.4/10.0
- Livability +2.6/5.0
- Rent growth +2.5/5.0
- Condition / age +2.5/5.0
- Schools +1.8/10.0
- Appreciation +0.1/10.0
$160,000
🖨 Deal sheet (PDF) 📄 Offer letter ✓ Due diligence
Listing remarks
This Adamsville home is waiting for you. You immediately notice the big windows from the street. Stepping through the front door, you are instantly greeted with crisp, clean, and pristine white walls. The brand new appliances and eat-in kitchen welcome you for intimate settings with family and friends. Double-closets await in the en suite and a stand-up shower complete the main bath.
Key facts
- Big windows
- Stand-up shower
- Brand new appliances
Tags
Property features AI
Exterior
- Parking: Front garage entry; Two total garage spaces (garage noted at basement level); Driveway parking; On-street parking
- Security: Security system
- Utilities: Public water; Connected sewer; Electric water heater; Internet service available
- Home design: 4-side brick construction with shingle roof; Basement foundation; Existing (previously built) home
- Construction: 4-side brick exterior; Shingle roof; Basement foundation
- Exterior features: Fenced yard; City view
Interior
- Kitchen: Refrigerator; Electric stove
- Bedrooms: Master bedroom on main level; Additional bedroom on main level
- Flooring: Hardwood laminate flooring
- Bathrooms: Two full bathrooms; Separate shower in at least one bathroom; Dressing room
- Heating & cooling: Central heating; Central electric cooling
- Interior features: Smooth ceilings; Security system; Solid surface kitchen countertops; Partial basement with both finished and unfinished areas; Daylight basement with poured concrete walls; Pull-down attic; Tri-level/split status: not split level or split foyer (single main level layout indicated)
- Laundry & utility: Laundry in basement; Washer hookup; Electric dryer hookup
Neighborhood map
What this means for you Summary
Snapshot
- This is a 3-bed/2.0-bath single-family listed at $160k.
Deal economics
- At list price, monthly cash flow is $113 ($1k/yr) — positive.
- The deal already cash-flows at list — no discount required.
- To meet the 1% rule (rent ≥ 1% of price), the offer needs to be $134k (16.0% below list).
- Recommended offer: $134k (16.0% below list) — sets the bar for 1% rule.
Location & tenants
- Location reads 51/100 on livability (#522 in AL) — a working-class tenant base; expect higher turnover. Strengths: cost of living A+, housing A+; Watch: crime F, amenities F, commute F.
- Jefferson County (suburban): math 9% / reading 32% proficiency, ranked #104 of 129 in AL (top 81%) — low school quality limits family demand, transient renter base, plan for 1-2y turnover.
- Zoned schools: Minor Community School (math 2% / reading 17%, grade F, #568 of 627 statewide, top 94%, 409 students, 84% FRL); Minor High School (math 4% / reading 8%, grade F, #275 of 305 statewide, top 90%, 915 students, 84% FRL) — zoned schools average 84% FRL vs 49% district-wide (35 pts higher); higher-poverty schools than district average — tighter screening recommended.
- Zoned-school proficiency averages 8% at this address vs 20% district-wide (-13 pts) — the specific schools serving this property underperform the Jefferson County average; the district grade overstates school quality for this exact location.
- Market conditions: 59 active listings in the ZIP; 8 comparable units currently listed for rent nearby; rentals at typical pace (median 20d on market — plan ~3-4 weeks tenant-placement turnaround); 2,114 units permitted in Jefferson County in 2024 (556 in 5+ unit buildings).
Forward outlook
- Local home prices are declining (-3.0%/yr); year-one equity from $1k of loan paydown is wiped out by about $5k of value loss. Plan a longer hold.
- Jefferson County population projected to shrink 4% by 2050 — rents likely to lag national; underwrite the cash flow, not the appreciation.
Negotiation context
- It's been on market 23 days — a 2% lower offer ($158k) is reasonable based on typical stale-listing flexibility.
- Current owner paid $74k; list at $160k implies a 118% gain — meaningful room to come down on a strong offer.
Risks & watch-outs
- Climate carrying-cost: major wind risk, 27% chance of damaging wind over 30y; extreme-heat days projected 7→19/yr by 2055 (HVAC capex compounding) — expect insurance premiums to compound above CPI over the hold.
Questions for the listing agent
- Built in 1979 — when were the roof, HVAC, electrical panel, plumbing, and water heater last replaced?
- Is there a deadline driving the sale (1031 exchange, divorce, estate, relocation)? That informs how much negotiation room exists.
- Schools are F-rated, which usually means shorter tenancies and higher turnover. Who's the typical renter profile here, and what's been the actual vacancy rate?
- Crime grade is F in this area — have there been break-ins, vandalism, or insurance claims at this property in the last 3 years? What carrier currently insures it and at what premium?
- The area grade is low — what's the realistic commute time and amenity access for the typical tenant pool here? Any planned neighborhood developments (good or bad) we should know about?
- What's the average days-on-market for RENTAL listings here right now (not sales)? A rising rental-DOM trend means longer vacancies and softer asking-rent achievability than the comps imply.
- What's the recent tenant-quality profile in this submarket — average credit score on applications, eviction rate, late-payment / NSF rate, and stable-employment percentage? A property-management company in the area should have these aggregated.
- How much new for-sale + rental construction is in the pipeline within 1–3 miles? Heavy new supply typically softens prices + rents 12–24 months out; constrained supply supports both.
Investment metrics
- 1% rule
- 0.84% ✗
- Cap rate
- 7.14%
- Cash-on-cash
- 3.03%
- DSCR
- 1.13
- GRM
- 9.9
CMA / ARV
- ARV (on-the-fly)
- $168,036
- Comps found
- 10
Show comp detail 10 sales within ~0.75 mi
| Address | Dist | Beds/Ba | Sqft | Sold | Price | $/sf | Match |
|---|---|---|---|---|---|---|---|
| 3901 Debby Dr | 0.39mi | 4/2.0 (+1) | 1,219 (-3%) | 1mo | $199,000 | $163 | 72 |
| 714 Denniston Ln | 0.19mi | 3/2.0 | 1,359 (+8%) | 10mo | $155,000 | $114 | 69 |
| 429 Westwood Ave | 0.40mi | 3/2.0 | 1,302 (+4%) | 14mo | $155,000 | $119 | 63 |
| 3300 Wentwood Cir | 0.41mi | 3/2.0 | 1,265 (+1%) | 20mo | $194,900 | $154 | 63 |
| 4108 Flowers St | 0.44mi | 3/2.0 | 1,293 (+3%) | 15mo | $185,000 | $143 | 62 |
| 304 Harris Ave | 0.62mi | 3/2.0 | 1,224 (-2%) | 9mo | $176,000 | $144 | 60 |
| 632 Basswood Dr | 0.08mi | 3/1.5 | 1,075 (-14%) | 22mo | $129,900 | $121 | 52 |
| 404 Westwood Ave | 0.47mi | 3/1.0 | 1,184 (-6%) | 22mo | $119,000 | $101 | 47 |
| 4104 Hazelwood Rd | 0.51mi | 3/1.0 | 1,161 (-7%) | 22mo | $116,500 | $100 | 42 |
| 3237 Poplar Ln | 0.58mi | 3/2.0 | 1,434 (+14%) | 14mo | $192,000 | $134 | 38 |
Match score weights: distance 35% · size 25% · config 20% · recency 20%. Top-matched comps best support the ARV.
Projected returns pro-forma
-3.0% appreciation · 3.0% rent growth · sell at horizon
- IRR
- -11.6%
- Equity multiple
- 0.58×
- Total profit
- $-18,789
- Equity at exit
- $23,857
- IRR
- -2.4%
- Equity multiple
- 0.84×
- Total profit
- $-7,381
- Equity at exit
- $13,834
Cash invested: $44,800 (down + closing). Projections, not guarantees.
Landlord ↔ Tenant lean methodology
- Overall (STATE)
- 90 Strongly Landlord-Friendly
- State Alabama
- 90 Strongly Landlord-Friendly · R+15
- County
- — inherits STATE
- City
- — inherits STATE
ZIP-level market 35005
- Home prices YoY
- -3.9%
- Active inventory
- 59
- Price-to-rent
- 9.9×
Monthly cashflow live
- Estimated rent
- $1,344 high interval (Pro) →
- Mortgage (P&I)
- −$839
- Tax from tax record
- −$43 /mo · $514/yr
- Insurance
- −$67
- HOA
- −$0
- Vacancy / Maint / Mgmt
- −$282
- Net cashflow
- $113
Break-even live
Sensitivity live
| Price | -10% $204 | -5% $159 | +0% $113 | +5% $68 | +10% $23 |
|---|---|---|---|---|---|
| Rent | -10% $7 | -5% $60 | +0% $113 | +5% $166 | +10% $219 |
| Rate | -1.0pp $194 | -0.5pp $154 | base $113 | +0.5pp $72 | +1.0pp $30 |
UW: 25.0% down · 7.5% · 30yr · 1.5% tax · 5.0% vac · 8.0% maint · 8.0% mgmt
Financing live
Cash to close
- Down payment
- $40,000
- Closing costs
- $4,800
- Reserves months
- —
- Total cash needed
- —
Loan-product check · same deal, 3 products live
Conventional
25% down · 7.5% · 30yr
- Down + closing
- —
- Monthly P&I
- —
- Monthly cashflow
- —
- DSCR
- —
- Eligible?
- —
Personal DTI + credit; lowest rate.
DSCR
20% down · 8.5% · 30yr
- Down + closing
- —
- Monthly P&I
- —
- Monthly cashflow
- —
- DSCR
- —
- Eligible?
- —
No personal income docs; deal must DSCR.
Hard money
10% down · 12.0% · 12mo
- Down + closing
- —
- Monthly P&I
- —
- Monthly cashflow
- —
- DSCR
- —
- Eligible?
- —
Short-term bridge; refi at stabilization.
Rent comps 8 comps
| Address | Beds | Baths | Sqft | Rent | $/sqft | DOM | Units | Dist |
|---|---|---|---|---|---|---|---|---|
| 4204 Denniston Cir Adamsville, AL | 3.0 | 2.0 | 1282 | $1,580 | $1.23 | 24d | 1 | 0.15mi |
| 3 Russell Dr Adamsville, AL | 3.0 | 2.0 | 1028 | $875 | $0.85 | 20d | 1 | 0.77mi |
| 4213 Kendall Ave Adamsville, AL | 4.0 | 2.0 | 1250 | $1,225 | $0.98 | 4d | 1 | 0.93mi |
| 4329 Maple Cir Adamsville, AL | 3.0 | 2.0 | 1236 | $1,225 | $0.99 | 24d | 1 | 0.95mi |
| 3716 Main St Adamsville, AL | 2.0 | 1.0 | 1058 | $896 | $0.85 | 17d | 1 | 0.95mi |
| 4508 Maple Cir Adamsville, AL | 3.0 | 1.0 | 975 | $1,095 | $1.12 | 4d | 1 | 0.99mi |
| 4400 Old Jasper Hwy Adamsville, AL | 4.0 | 2.0 | 1200 | $1,350 | $1.12 | 4d | 1 | 1.08mi |
| 216 Mountain St Adamsville, AL | 3.0 | 2.0 | 1027 | $999 | $0.97 | 44d | 1 | 1.17mi |
Listing history 12 events
-
2026-06-13statusdays on market $160,000 Pending 23 DOM
-
2026-06-10days on market $160,000 Active 21 DOM
-
2026-06-09days on market $160,000 Active 20 DOM
-
2026-06-08days on market $160,000 Active 19 DOM
-
2026-06-07days on market $160,000 Active 18 DOM
-
2026-06-03days on market $160,000 Active 14 DOM
-
2026-06-02days on market $160,000 Active 13 DOM
-
2026-06-01days on market $160,000 Active 12 DOM
-
2026-05-31days on market $160,000 Active 11 DOM
-
2026-05-20$160,000 Active
-
1996-06-20soldstatus $73,500
-
1977-11-01soldstatus $39,900
ⓘ Source: listings_history table (triggers on properties + properties_extension) + one-shot
backfill from property_details.listing_events for pre-trigger history.
Tax reassessment forecast AL · Resets to sale price
- Current annual tax
- $514 · $43/mo
- Projected year-2 tax
- $656 · $55/mo
- Expected delta
- +$142/yr (+$12/mo · 27.6%)
ⓘ Screening estimate from a state-policy table — verify with the county assessor before closing.
Climate risk First Street
- Flood 1/10 Low FEMA zone X (unshaded) · 0% chance over 30 yrs
- Wildfire 4/10 Moderate
- Heat 6/10 Major 7 d/yr ≥107°F today · 19 d/yr by 30 yrs out
- Wind 6/10 Major 27% chance of damaging wind over 30 yrs
- Air quality 3/10 Moderate 3 unhealthy d/yr today · 5 by 30 yrs out
Nearby sold comps map
Loading sold comps map…
Walkable amenities ~0.75 mi
Loading nearby amenities…
Taxation est. · year 1
- Rental income
- $16,129
- − Mortgage interest
- −$8,962
- − Property taxes
- −$514
- − Insurance
- −$800
- − Repairs & maintenance
- −$1,290
- − Management
- −$1,290
- − Depreciation
- −$4,655
- Taxable loss
- −$1,383
- Est. tax savings @ 24.0%
- +$332
- After-tax cash flow
- $1,691/yr
For passive investors: Depreciation is non-cash, so a rental often shows a tax loss while cash-flowing — sheltering income. Rental losses are passive: they offset passive income freely, and up to $25,000/yr can offset ordinary (W-2) income if you actively participate and your MAGI is under $100k (phasing out to $0 by $150k); unused losses carry forward. On sale, claimed depreciation is recaptured at up to 25%, and gains may owe capital-gains tax (a 1031 exchange can defer both). Figures are a year-1 estimate at your 24.0% rate — not tax advice; consult a CPA.
Schools (NCES district)
- District
- Jefferson County
- NCES district ID
- 0101920
- Math proficiency
- 9% ▼ -24.00%
- Reading proficiency
- 32% ▼ -5.00%
- Median HH income
- $51,712
- Composite
- 18.4/100
- National rank
- #8937
- State rank
- #104 of 129 in AL
Livability — Adamsville
- Score
- 51/100
- State rank
- #522
- US rank
- #25480
Category grades
Schools grade is shown separately in the Schools card above.
Census & demographics
- Census place
- Adamsville, AL
- City population
- 10,982
- Population (ZIP)
- 8,143
Population outlook (Jefferson County) Hauer SSP2
- Today (2025)
- 669,185 people
- By 2030
- 669,694 · +0.1%
- By 2040
- 661,388 · -1.2%
- By 2050
- 643,086 · -3.9%
- By 2075
- 577,267 · -13.7%
- By 2100
- 474,758 · -29.1%
Race, ethnicity, and origin ACS 2023
- Neighborhood character
- Majority Black (60%)
- Race & ethnicity
- Black 60% White 38% Asian 2%
- Common ancestry
- Serbian 2% Lithuanian 1%
- Foreign-born
- 1%
- Languages at home
- 98% English-only · Other Indo-European 1% Spanish 1%
Political lean MEDSL · Jefferson
- 2024 margin
- D (+10.4) · D 54.6% · R 44.2% · Other 1.2%
- 2008→2024 swing
- +5.4pp toward D · 2008: 5.1pp · 2024: 10.4pp
- All cycles
- 2024: D+10.4 2020: D+13.2 2016: D+7.2 2012: D+6.0 2008: D+5.1
Not yet ingested
- Civics
- —
Market trends
- HPI YoY
- ▼ -9.72%
- Current HPI
- 237.5788
- Rent YoY
- —
- Metro
- —
- State GDP YoY
- ▲ 2.94%
- F500 in state
- 4
Industry mix (Fortune 500 HQ in AL)
| Industry | F500 HQs | Revenue |
|---|---|---|
| Financial Services | 1 | $8B |
|
||
| Healthcare | 1 | $5B |
|
||
Price history
+301.0% since first listed3 events — show timeline
- 2026-05-20 Listed $160,000 Greater Alabama MLS
- 1996-06-20 Sold (Public Records) $73,500 Public Records
- 1977-11-01 Sold (Public Records) $39,900 Public Records
Property tax history
+0.0%/yrLatest (2025): $514 · +0.0% YoY. Source: county tax records.
Cash-flow waterfall
monthlySold comps — $/sqft
last 12 mo · ≤1 miLoading sold comps…