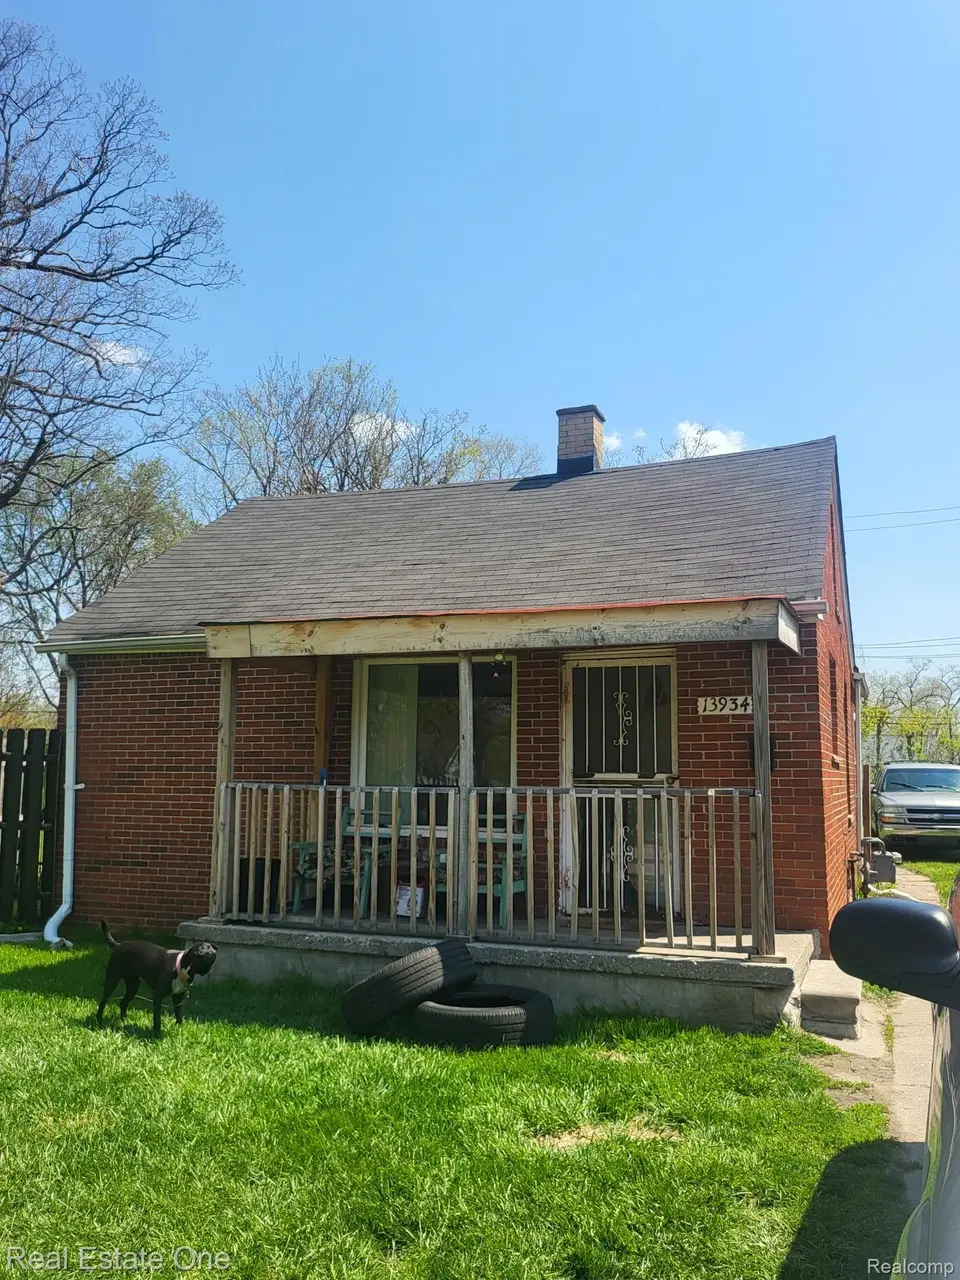
13934 Rockdale St · Detroit, MI
Flood risk 1/10 · Minimal
- FEMA flood zone
- X (unshaded)
- Chance of flooding over 30 yrs
- 0.0%
- Est. flood insurance / yr
- $507 – $1,088
Fire risk 1/10 · Minimal
- Est. fire insurance / yr
- $784 – $1,456
Heat risk 3/10 · Minor
- Hot days now (above 99°F)
- 7 days/yr
- Hot days in 30 yrs
- 15 days/yr
Wind risk 2/10 · Minimal
- Chance of severe wind over 30 yrs
- —
Air-quality risk 3/10 · Minor
- Unhealthy air days now
- 2 days/yr
- Unhealthy air days in 30 yrs
- 3 days/yr
Risk factors via First Street. Map © Google.
Why this score? — see what drove the C grade
The composite is a weighted blend of 9 inputs, each scored 0–100. Each bar is that input's sub-score; the figure is the points it added to the 100-point composite (weight × sub-score).
- Cash flow +30.0/30.0
- 1% rule +10.0/10.0
- DSCR +10.0/10.0
- Livability +3.7/5.0
- Rent growth +2.5/5.0
- Condition / age +2.5/5.0
- Schools +1.3/10.0
- ARV discount +0.0/15.0
- Appreciation +0.0/10.0
$47,000
🖨 Deal sheet (PDF) 📄 Offer letter ✓ Due diligence
Listing remarks MLS
Unique opportunity in Detroit's established Brightmoor area! This tenant-occupied brick ranch is being sold together with adjacent property at 13926 Rockdale, offering exceptional flexibility for investors or owner-occupants alike. Live in one home while generating rental income from the other, expand your investment portfolio, or create a multi-property opportunity with side-by-side ownership. Conveniently located near Rouge Park Golf Course, major freeways, shopping, and just minutes from Downtown Detroit, this property offers strong long-term potential in an area seeing continued growth and investment. Features include 2 bedrooms, 1 bath, and a functional layout with great everyday livability. Tenant occupied. 24-hour notice required for all showings. Weekend showing requests must be submitted by Friday morning to allow time for tenant coordination. Later requests will be accommodated on a best-effort basis. BATVAI.
Key facts
- Brightmoor area
- Tenant occupied
- Major freeways
Tags
Property features AI
Exterior
- Parking: No garage
- Utilities: Public water; Public sewer
- Home design: Single-family residence; One-story home; Ground-level entry
- Construction: Brick construction
- Exterior features: Paved road access; Asphalt roof
Interior
- Bathrooms: 1 full bathroom
- Heating & cooling: Forced air heating (natural gas); No cooling
- Interior features: Gas water heater; Crawl space basement; Total of 5 rooms
Neighborhood map
What this means for you Summary
Snapshot
- This is a 2-bed/1.0-bath single-family listed at $47k.
Deal economics
- At list price, monthly cash flow is $479 ($6k/yr) — positive.
- The deal already cash-flows at list — no discount required.
- Meets the 1% rule at list price ($989 rent vs $47k).
- Recommended offer: $46k (1.5% below list) — sets the bar for market timing.
- Cap rate 18.5% vs local median 10.0% in Detroit — top-decile yield for the area; either an underpriced asset or a hidden risk that comps aren't pricing in. Stress-test before assuming the spread holds.
Location & tenants
- Location reads 73/100 on livability (#218 in MI) — a middle-class / working-renter tenant base. Strengths: amenities A+, commute A+, cost of living A+; Watch: schools F, crime F, employment F.
- Detroit Public Schools Community District (urban): math 10% / reading 24% proficiency, ranked #499 of 540 in MI (top 92%) — low school quality limits family demand, transient renter base, plan for 1-2y turnover; 90% free/reduced lunch — lower-income household profile, screen leases tightly.
- Market conditions: 161 active listings in the ZIP; 40 comparable units currently listed for rent nearby; rentals lingering (median 46d on market — plan ~5-8 weeks vacancy on turnover, expect pricing pressure); 95% of comp listings sitting > 30 days — soft ceiling on asking rent; lower-income renter base — watch delinquency; 2,639 units permitted in Wayne County in 2024 (1,216 in 5+ unit buildings).
Forward outlook
- Local home prices are declining (-3.0%/yr); year-one equity from $325 of loan paydown is wiped out by about $1k of value loss. Plan a longer hold.
- Wayne County population projected at -17% by 2050 — secular population decline; favor cash flow + early exit over multi-decade hold.
- At projected returns (-3.0% appreciation + 3.0% rent growth), your $13k cash investment doubles in ~3 years — after that, you're playing with house money.
Negotiation context
- It's been on market 26 days — a 2% lower offer ($46k) is reasonable based on typical stale-listing flexibility.
- 14 sale attempts since 20y ago with the ask held roughly flat each time — persistent listings suggest the price (not the market) is what's stuck; bring a comps-based counter.
- Current owner paid $5k; list at $47k implies a 840% gain — meaningful room to come down on a strong offer.
Risks & watch-outs
- Watch-outs: built in 1924 — expect roof / HVAC / electrical / plumbing capex.
Questions for the listing agent
- Built in 1924 — when were the roof, HVAC, electrical panel, plumbing, and water heater last replaced?
- Is there a deadline driving the sale (1031 exchange, divorce, estate, relocation)? That informs how much negotiation room exists.
- Schools are F-rated, which usually means shorter tenancies and higher turnover. Who's the typical renter profile here, and what's been the actual vacancy rate?
- Crime grade is F in this area — have there been break-ins, vandalism, or insurance claims at this property in the last 3 years? What carrier currently insures it and at what premium?
- What's the average days-on-market for RENTAL listings here right now (not sales)? A rising rental-DOM trend means longer vacancies and softer asking-rent achievability than the comps imply.
- What's the recent tenant-quality profile in this submarket — average credit score on applications, eviction rate, late-payment / NSF rate, and stable-employment percentage? A property-management company in the area should have these aggregated.
- How much new for-sale + rental construction is in the pipeline within 1–3 miles? Heavy new supply typically softens prices + rents 12–24 months out; constrained supply supports both.
Investment metrics
- 1% rule
- 2.10% ✓
- Cap rate
- 18.53%
- Cash-on-cash
- 43.69%
- DSCR
- 2.94
- GRM
- 4.0
CMA / ARV
- ARV (on-the-fly)
- $33,600
- Comps found
- 7
Show comp detail 7 sales within ~0.75 mi
| Address | Dist | Beds/Ba | Sqft | Sold | Price | $/sf | Match |
|---|---|---|---|---|---|---|---|
| 14437 Dacosta St | 0.45mi | 2/1.0 | 707 (+5%) | 2mo | $66,995 | $95 | 69 |
| 14024 Lamphere St | 0.21mi | 2/1.0 | 736 (+10%) | 16mo | $37,000 | $50 | 60 |
| 14889 Dacosta St | 0.73mi | 2/1.0 | 665 (-1%) | 8mo | $24,999 | $38 | 58 |
| 11747 W Outer Dr | 0.57mi | 2/1.0 | 736 (+10%) | 7mo | $70,000 | $95 | 51 |
| 14371 Dacosta St | 0.39mi | 3/1.0 (+1) | 755 (+12%) | 7mo | $4,200 | $6 | 50 |
| 12937 Trinity St | 0.53mi | 2/1.0 | 729 (+8%) | 14mo | $15,500 | $21 | 50 |
| 12955 Grayfield St | 0.63mi | 2/1.0 | 731 (+9%) | 21mo | $78,000 | $107 | 39 |
Match score weights: distance 35% · size 25% · config 20% · recency 20%. Top-matched comps best support the ARV.
Projected returns pro-forma
-3.0% appreciation · 3.0% rent growth · sell at horizon
- IRR
- 40.6%
- Equity multiple
- 2.74×
- Total profit
- $22,900
- Equity at exit
- $7,008
- IRR
- 46.9%
- Equity multiple
- 5.50×
- Total profit
- $59,238
- Equity at exit
- $4,064
Cash invested: $13,160 (down + closing). Projections, not guarantees.
Landlord ↔ Tenant lean methodology
- Overall (STATE)
- 62 Landlord-Friendly
- State Michigan
- 62 Landlord-Friendly · EVEN
- County
- — inherits STATE
- City
- — inherits STATE
ZIP-level market 48223
- Active inventory
- 161
- Price-to-rent
- 4.0×
Monthly cashflow live
- Estimated rent
- $989 high interval (Pro) →
- Mortgage (P&I)
- −$246
- Tax from tax record
- −$36 /mo · $429/yr
- Insurance
- −$20
- HOA
- −$0
- Vacancy / Maint / Mgmt
- −$208
- Net cashflow
- $479
Break-even live
Sensitivity live
| Price | -10% $506 | -5% $492 | +0% $479 | +5% $466 | +10% $453 |
|---|---|---|---|---|---|
| Rent | -10% $401 | -5% $440 | +0% $479 | +5% $518 | +10% $557 |
| Rate | -1.0pp $503 | -0.5pp $491 | base $479 | +0.5pp $467 | +1.0pp $455 |
UW: 25.0% down · 7.5% · 30yr · 1.5% tax · 5.0% vac · 8.0% maint · 8.0% mgmt
Financing live
Cash to close
- Down payment
- $11,750
- Closing costs
- $1,410
- Reserves months
- —
- Total cash needed
- —
Loan-product check · same deal, 3 products live
Conventional
25% down · 7.5% · 30yr
- Down + closing
- —
- Monthly P&I
- —
- Monthly cashflow
- —
- DSCR
- —
- Eligible?
- —
Personal DTI + credit; lowest rate.
DSCR
20% down · 8.5% · 30yr
- Down + closing
- —
- Monthly P&I
- —
- Monthly cashflow
- —
- DSCR
- —
- Eligible?
- —
No personal income docs; deal must DSCR.
Hard money
10% down · 12.0% · 12mo
- Down + closing
- —
- Monthly P&I
- —
- Monthly cashflow
- —
- DSCR
- —
- Eligible?
- —
Short-term bridge; refi at stabilization.
Rent comps 40 comps
| Address | Beds | Baths | Sqft | Rent | $/sqft | DOM | Units | Dist |
|---|---|---|---|---|---|---|---|---|
| 12880 Dolson St Detroit, MI | 1.0–2.0 | 1.0 | 750 | $1,200 | $1.60 | 45d | 6 | 0.26mi |
| 12850 Dolphin St Detroit, MI | 1.0–2.0 | 1.0 | 746 | $999 | $1.34 | 6d | 4 | 0.26mi |
| 12867 Westbrook St Detroit, MI | 2.0 | 1.0 | 736 | $1,050 | $1.43 | 45d | 1 | 0.43mi |
| 23620 Schoolcraft Rd Detroit, MI | 1.0 | 1.0 | 750 | $985 | $1.31 | 45d | 1 | 0.74mi |
| 23608 Schoolcraft Rd Detroit, MI | 1.0 | 1.0 | 550 | $895 | $1.63 | 45d | 1 | 0.74mi |
| 23600 Schoolcraft Rd Detroit, MI | 1.0 | 1.0 | 750 | $995 | $1.33 | 45d | 1 | 0.74mi |
| 23616 Schoolcraft Rd Detroit, MI | 1.0 | 1.0 | 750 | $900 | $1.20 | 45d | 1 | 0.74mi |
| 23604 Schoolcraft Rd Detroit, MI | 1.0 | 1.0 | 750 | $900 | $1.20 | 45d | 1 | 0.74mi |
| 23612 Schoolcraft Rd Detroit, MI | 1.0 | 1.0 | 750 | $895 | $1.19 | 45d | 1 | 0.74mi |
| 23624 Schoolcraft Rd Detroit, MI | 1.0 | 1.0 | 750 | $895 | $1.19 | 45d | 1 | 0.76mi |
| 14088 Riverview St Unit 207 Detroit, MI | 2.0 | 1.0 | 750 | $975 | $1.30 | 45d | 1 | 0.77mi |
| 14088 Riverview St Unit 108 Detroit, MI | 2.0 | 1.0 | 750 | $900 | $1.20 | 45d | 1 | 0.77mi |
| 14088 Riverview St Unit 208 Detroit, MI | 2.0 | 1.0 | 750 | $985 | $1.31 | 45d | 1 | 0.77mi |
| 14084 Riverview St Detroit, MI | 1.0 | 1.0 | 750 | $985 | $1.31 | 45d | 1 | 0.77mi |
| 14090 Riverview St Detroit, MI | 1.0 | 1.0 | 750 | $895 | $1.19 | 45d | 1 | 0.77mi |
| 14094 Riverview St Detroit, MI | 1.0 | 1.0 | 750 | $795 | $1.06 | 45d | 1 | 0.77mi |
| 23632 Schoolcraft Rd Detroit, MI | 1.0 | 1.0 | 750 | $900 | $1.20 | 45d | 1 | 0.77mi |
| 23636 Schoolcraft Rd Unit 109 Detroit, MI | 2.0 | 1.0 | 750 | $975 | $1.30 | 45d | 1 | 0.77mi |
| 23636 Schoolcraft Rd Apt 212 Detroit, MI | 2.0 | 1.0 | 750 | $985 | $1.31 | 45d | 1 | 0.77mi |
| 23636 Schoolcraft Rd Unit 210 Detroit, MI | 1.0 | 1.0 | 550 | $845 | $1.54 | 26d | 1 | 0.77mi |
| 23628 Schoolcraft Rd Detroit, MI | 1.0 | 1.0 | 750 | $985 | $1.31 | 45d | 1 | 0.77mi |
| 23636 Schoolcraft Rd Unit 211 Detroit, MI | 1.0 | 1.0 | 750 | $950 | $1.27 | 45d | 1 | 0.77mi |
| 23636 Schoolcraft Rd Unit 111 Detroit, MI | 1.0 | 1.0 | 550 | $795 | $1.45 | 45d | 1 | 0.77mi |
| 14108 Riverview St Detroit, MI | 1.0 | 1.0 | 750 | $895 | $1.19 | 45d | 1 | 0.77mi |
| 14104 Riverview St Detroit, MI | 1.0 | 1.0 | 750 | $895 | $1.19 | 45d | 1 | 0.77mi |
| 14130 Riverview St Detroit, MI | 1.0 | 1.0 | 750 | $845 | $1.13 | 45d | 1 | 0.78mi |
| 14134 Riverview St Detroit, MI | 1.0 | 1.0 | 750 | $845 | $1.13 | 45d | 1 | 0.78mi |
| 14120 Riverview St Detroit, MI | 1.0 | 1.0 | 750 | $985 | $1.31 | 45d | 1 | 0.78mi |
| 14116 Riverview St Detroit, MI | 1.0 | 1.0 | 550 | $795 | $1.45 | 45d | 1 | 0.79mi |
| 23646 Schoolcraft Rd Detroit, MI | 1.0 | 1.0 | 750 | $800 | $1.07 | 45d | 1 | 0.79mi |
| 14080 Riverview St Detroit, MI | 1.0 | 1.0 | 750 | $985 | $1.31 | 45d | 1 | 0.80mi |
| 14138 Riverview St Detroit, MI | 1.0 | 1.0 | 750 | $845 | $1.13 | 45d | 1 | 0.80mi |
| 14100 Riverview St Detroit, MI | 1.0 | 1.0 | 750 | $795 | $1.06 | 45d | 1 | 0.80mi |
| 14076 Riverview St Detroit, MI | 1.0 | 1.0 | 750 | $895 | $1.19 | 45d | 1 | 0.80mi |
| 23654 Schoolcraft Rd Detroit, MI | 1.0 | 1.0 | 750 | $985 | $1.31 | 45d | 1 | 0.80mi |
| 14146 Riverview St Detroit, MI | 1.0 | 1.0 | 750 | $845 | $1.13 | 45d | 1 | 0.80mi |
| 14162 Riverview St Detroit, MI | 1.0 | 1.0 | 750 | $795 | $1.06 | 45d | 1 | 0.80mi |
| 14166 Riverview St Detroit, MI | 1.0 | 1.0 | 750 | $985 | $1.31 | 45d | 1 | 0.80mi |
| 14154 Riverview St Detroit, MI | 1.0 | 1.0 | 750 | $845 | $1.13 | 45d | 1 | 0.80mi |
| 14158 Riverview St Detroit, MI | 1.0 | 1.0 | 750 | $795 | $1.06 | 45d | 1 | 0.80mi |
Listing history 49 events
-
2026-06-21days on market $47,000 Active 26 DOM
-
2026-06-18days on market $47,000 Active 23 DOM
-
2026-06-17days on market $47,000 Active 22 DOM
-
2026-06-15days on market $47,000 Active 20 DOM
-
2026-06-13days on market $47,000 Active 18 DOM
-
2026-06-13days on market $47,000 Active 17 DOM
-
2026-06-09days on market $47,000 Active 14 DOM
-
2026-06-08days on market $47,000 Active 13 DOM
-
2026-06-07days on market $47,000 Active 12 DOM
-
2026-06-04days on market $47,000 Active 9 DOM
-
2026-06-03days on market $47,000 Active 8 DOM
-
2026-06-02days on market $47,000 Active 7 DOM
-
2026-06-01days on market $47,000 Active 6 DOM
-
2026-05-31days on market $47,000 Active 5 DOM
-
2026-05-27$47,000 Active
-
2026-05-26$47,000 Active 932-char remark
Show marketing remark (932 chars)
Unique opportunity in Detroit's established Brightmoor area! This tenant-occupied brick ranch is being sold together with adjacent property at 13926 Rockdale, offering exceptional flexibility for investors or owner-occupants alike. Live in one home while generating rental income from the other, expand your investment portfolio, or create a multi-property opportunity with side-by-side ownership. Conveniently located near Rouge Park Golf Course, major freeways, shopping, and just minutes from Downtown Detroit, this property offers strong long-term potential in an area seeing continued growth and investment. Features include 2 bedrooms, 1 bath, and a functional layout with great everyday livability. Tenant occupied. 24-hour notice required for all showings. Weekend showing requests must be submitted by Friday morning to allow time for tenant coordination. Later requests will be accommodated on a best-effort basis. BATVAI.
-
2021-01-01historical
-
2021-01-01historical
-
2020-11-24status Active
-
2020-11-24status Active
-
2020-11-05status Pending
-
2020-11-05status Pending
-
2020-08-01price $34,999
-
2020-07-31price $34,999
-
2020-06-05price $35,000
-
2020-06-04price $35,000
-
2020-05-30$70,000 Active
-
2020-05-30$70,000 Active
-
2020-04-03historical
-
2020-04-02historical
-
2020-02-26historical Keep Showing-Contgcy Appl
-
2020-02-26historical Contingent - Continue To Show
-
2020-01-22$74,900 Active
-
2020-01-22$74,900 Active
-
2015-11-04historical
-
2015-11-03historical
-
2015-06-07$45,000 Active
-
2015-06-01historical
-
2015-06-01historical
-
2014-11-03$45,000 Active
-
2014-11-03$45,000
-
2014-11-03$45,000
-
2007-01-29soldstatus $5,000
-
2007-01-29soldstatus $5,000
-
2006-10-23historical
-
2006-09-14$6,000
-
2006-09-14$6,000
-
2005-04-01soldstatus $71,000
-
1998-07-24soldstatus $8,174
ⓘ Source: listings_history table (triggers on properties + properties_extension) + one-shot
backfill from property_details.listing_events for pre-trigger history.
Tax reassessment forecast MI · Partial reset (capped growth)
- Current annual tax
- $429 · $36/mo
- Projected year-2 tax
- $577 · $48/mo
- Expected delta
- +$147/yr (+$12/mo · 34.3%)
ⓘ Screening estimate from a state-policy table — verify with the county assessor before closing.
Climate risk First Street
- Flood 1/10 Low FEMA zone X (unshaded) · 0% chance over 30 yrs
- Wildfire 1/10 Low
- Heat 3/10 Moderate 7 d/yr ≥99°F today · 15 d/yr by 30 yrs out
- Wind 2/10 Low
- Air quality 3/10 Moderate 2 unhealthy d/yr today · 3 by 30 yrs out
Nearby sold comps map
Loading sold comps map…
Walkable amenities ~0.75 mi
Loading nearby amenities…
Taxation est. · year 1
- Rental income
- $11,863
- − Mortgage interest
- −$2,633
- − Property taxes
- −$429
- − Insurance
- −$235
- − Repairs & maintenance
- −$949
- − Management
- −$949
- − Depreciation
- −$1,367
- Taxable income
- $5,300
- Est. tax owed @ 24.0%
- −$1,272
- After-tax cash flow
- $4,477/yr
For passive investors: Depreciation is non-cash, so a rental often shows a tax loss while cash-flowing — sheltering income. Rental losses are passive: they offset passive income freely, and up to $25,000/yr can offset ordinary (W-2) income if you actively participate and your MAGI is under $100k (phasing out to $0 by $150k); unused losses carry forward. On sale, claimed depreciation is recaptured at up to 25%, and gains may owe capital-gains tax (a 1031 exchange can defer both). Figures are a year-1 estimate at your 24.0% rate — not tax advice; consult a CPA.
Schools (NCES district)
- District
- Detroit Public Schools Community District
- NCES district ID
- 2601103
- Math proficiency
- 10% ▼ -2.00%
- Reading proficiency
- 24% ▲ 6.00%
- Median HH income
- $25,815
- Composite
- 13.06/100
- National rank
- #9564
- State rank
- #499 of 540 in MI
Livability — Detroit
- Score
- 73/100
- State rank
- #218
- US rank
- #5427
Category grades
Schools grade is shown separately in the Schools card above.
Census & demographics
- Census place
- Detroit, MI
- County
- Wayne County · 1,562,939 people
- City population
- 572,865
- Metro
- Detroit-Warren-Dearborn, MI
- Population (ZIP)
- 22,622
- Household income
- $44,512
- Rent vs Own
- Severe rent burden
- 1151.0
Population outlook (Wayne County) Hauer SSP2
- Today (2025)
- 1,675,273 people
- By 2030
- 1,620,300 · -3.3%
- By 2040
- 1,502,341 · -10.3%
- By 2050
- 1,384,039 · -17.4%
- By 2075
- 1,124,592 · -32.9%
- By 2100
- 881,193 · -47.4%
Race, ethnicity, and origin ACS 2023
- Neighborhood character
- Predominantly Black (86%)
- Race & ethnicity
- Black 86% White 7% Two or more races 5% Hispanic / Latino 2%
- Common ancestry
- Romanian 1% Iranian 1%
- Foreign-born
- 1% · Canada
- Languages at home
- 97% English-only · Spanish 2%
Political lean MEDSL · Wayne
- 2024 margin
- Strong D (+29.0) · D 62.7% · R 33.7% · Other 3.6%
- 2008→2024 swing
- -20.5pp toward R · 2008: 49.5pp · 2024: 29.0pp
- All cycles
- 2024: D+29.0 2020: D+38.1 2016: D+37.3 2012: D+46.9 2008: D+49.5
Not yet ingested
- Civics
- —
Market trends
- HPI YoY
- ▼ -303.41%
- Current HPI
- 138.2779
- Rent YoY
- —
- Metro
- Detroit-Warren-Dearborn, MI
- State GDP YoY
- ▲ 1.37%
- F500 in state
- 28
Industry mix (Fortune 500 HQ in MI)
| Industry | F500 HQs | Revenue |
|---|---|---|
| Automotive Parts | 3 | $48B |
|
||
| Automotive | 2 | $372B |
|
||
| Chemicals | 1 | $45B |
|
||
| Automotive Retail | 1 | $29B |
|
||
| Healthcare / Medical Devices | 1 | $23B |
|
||
| Automotive Technology | 1 | $20B |
|
||
Price history
+475.0% since first listed35 events — show timeline
- 2026-05-27 Listed $47,000 REALCOMP
- 2026-05-26 Listed $47,000 MiRealSource-MiMLS
- 2021-01-01 Listing Removed — MiRealSource-MiMLS
- 2021-01-01 Listing Removed — REALCOMP
- 2020-11-24 Relisted — MiRealSource-MiMLS
- 2020-11-24 Relisted — REALCOMP
- 2020-11-05 Pending — MiRealSource-MiMLS
- 2020-11-05 Pending — REALCOMP
- 2020-08-01 Price Changed $34,999 MiRealSource-MiMLS
- 2020-07-31 Price Changed $34,999 REALCOMP
- 2020-06-05 Price Changed $35,000 MiRealSource-MiMLS
- 2020-06-04 Price Changed $35,000 REALCOMP
- 2020-05-30 Listed $70,000 MiRealSource-MiMLS
- 2020-05-30 Listed $70,000 REALCOMP
- 2020-04-03 Listing Removed — REALCOMP
- 2020-04-02 Listing Removed — MiRealSource-MiMLS
- 2020-02-26 Contingent — MiRealSource-MiMLS
- 2020-02-26 Contingent — REALCOMP
- 2020-01-22 Listed $74,900 MiRealSource-MiMLS
- 2020-01-22 Listed $74,900 REALCOMP
- 2015-11-04 Listing Removed — REALCOMP
- 2015-11-03 Listing Removed — MiRealSource-MiMLS
- 2015-06-07 Listed $45,000 REALCOMP
- 2015-06-01 Listing Removed — REALCOMP
- 2015-06-01 Listing Removed — MiRealSource-MiMLS
- 2014-11-03 Listed $45,000 MiRealSource-MiMLS
- 2014-11-03 Listed $45,000 MiRealSource-MiMLS
- 2014-11-03 Listed $45,000 REALCOMP
- 2007-01-29 Sold (MLS) $5,000 MiRealSource-MiMLS
- 2007-01-29 Sold (MLS) $5,000 REALCOMP
- 2006-10-23 Listing Removed — MiRealSource-MiMLS
- 2006-09-14 Listed $6,000 MiRealSource-MiMLS
- 2006-09-14 Listed $6,000 REALCOMP
- 2005-04-01 Sold (Public Records) $71,000 Public Records
- 1998-07-24 Sold (Public Records) $8,174 Public Records
Property tax history
+3.5%/yrLatest (2025): $429 · -2.9% YoY. Source: county tax records.
Cash-flow waterfall
monthlySold comps — $/sqft
last 12 mo · ≤1 miLoading sold comps…