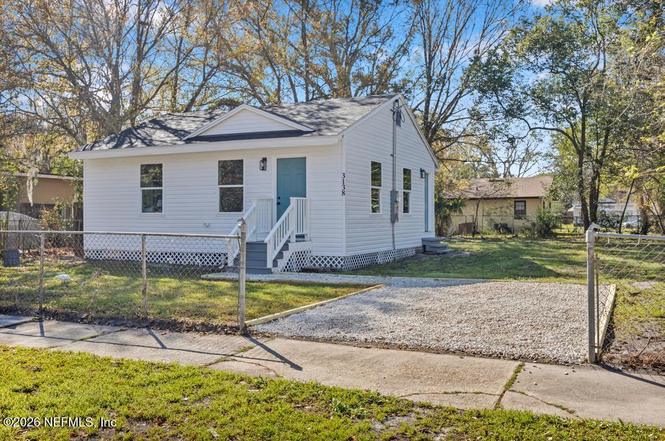
3138 N 3rd St Cir · Jacksonville, FL
Flood risk 1/10 · Minimal
- FEMA flood zone
- X (unshaded)
- Chance of flooding over 30 yrs
- 0.0%
- Est. flood insurance / yr
- $507 – $1,088
Fire risk 2/10 · Minimal
- Est. fire insurance / yr
- $947 – $1,759
Heat risk 9/10 · Severe
- Hot days now (above 107°F)
- 7 days/yr
- Hot days in 30 yrs
- 19 days/yr
Wind risk 9/10 · Severe
- Chance of severe wind over 30 yrs
- 99.0%
Air-quality risk 5/10 · Moderate
- Unhealthy air days now
- 7 days/yr
- Unhealthy air days in 30 yrs
- 7 days/yr
Risk factors via First Street. Map © Google.
Why this score? — see what drove the C grade
The composite is a weighted blend of 9 inputs, each scored 0–100. Each bar is that input's sub-score; the figure is the points it added to the 100-point composite (weight × sub-score).
- Cash flow +19.7/30.0
- ARV discount +7.5/15.0
- Appreciation +6.7/10.0
- DSCR +6.2/10.0
- Livability +4.2/5.0
- 1% rule +3.9/10.0
- Schools +3.9/10.0
- Rent growth +2.9/5.0
- Condition / age +2.5/5.0
$135,000
🖨 Deal sheet 📄 Offer letter ✓ Due diligence
Listing remarks
Fully renovated move-in ready, this home offers the reliability and feel of new construction at a price far below new builds at an incredible value. Renovated from top to bottom with no expense spared, including a brand new roof, new electrical panel with meter and updated wiring, new windows and exterior doors, a completely new kitchen, updated bathroom, new flooring throughout, and fresh interior and exterior paint. The open layout makes the home feel larger than its square footage and creates a bright, comfortable living space. A huge fenced backyard offers plenty of room for pets, entertaining, or simply enjoying the outdoors. Located in an area seeing strong revitalization with new con
Key facts
- New kitchen
- Updated wiring
- New exterior doors
Tags
Property features AI
Finance
- HOA & community: Not a senior community
Exterior
- Parking: Additional parking; Gated parking
- Utilities: Electricity connected; Water connected
- Home design: Single family residence; One level
- Exterior features: No private pool
Interior
- Kitchen: Electric cooktop; Electric oven; Refrigerator
- Bedrooms: 2 bedrooms
- Bathrooms: 1 full bathroom
- Heating & cooling: Central heating (electric); Central air conditioning (electric)
- Interior features: Electric water heater
Neighborhood map
What this means for you Summary
Snapshot
- This is a 2-bed/1.0-bath single-family listed at $135k.
Deal economics
- At list price, monthly cash flow is $157 ($2k/yr) — positive.
- The deal already cash-flows at list — no discount required.
- To meet the 1% rule (rent ≥ 1% of price), the offer needs to be $120k (10.8% below list).
- Recommended offer: $120k (10.8% below list) — sets the bar for 1% rule.
- Cap rate 7.7% vs local median 4.0% in Jacksonville — top-decile yield for the area; either an underpriced asset or a hidden risk that comps aren't pricing in. Stress-test before assuming the spread holds.
Location & tenants
- Location reads 83/100 on livability (#50 in FL, #911 nationally) — a professional / high-income tenant draw. Strengths: amenities A+, commute A+, housing A+.
- Duval (urban): math 46% / reading 45% proficiency, ranked #48 of 73 in FL (top 66%) — families likely to look elsewhere, expect single-tenant / working-renter base with shorter leases.
- Market conditions: Rents rising (+1.7%/yr); 172 active listings in the ZIP; 40 comparable units currently listed for rent nearby; rentals at typical pace (median 15d on market — plan ~3-4 weeks tenant-placement turnaround); lower-income renter base — watch delinquency; 6,503 units permitted in Duval County in 2024 (1,131 in 5+ unit buildings).
- This rent runs 41% of the median local income ($35k/yr) — at the standard rent-burdened threshold; future hikes will face affordability resistance.
Forward outlook
- In year one you build about $6k of equity ($933 loan paydown + $5k appreciation (3.4% local appreciation)).
- Duval County population projected at +19% by 2050 — long-run rental-demand tailwind backs the buy-and-hold thesis.
- At projected returns (3.4% appreciation + 1.7% rent growth), your $38k cash investment doubles in ~5 years — after that, you're playing with house money.
- By year 7, paydown + projected appreciation supports a ~$35k cash-out refi (75% LTV) — recoverable capital for the next deal without selling this one.
Negotiation context
- It's been on market 54 days — a 3% lower offer ($131k) is reasonable based on typical stale-listing flexibility.
- Current owner paid $37k; list at $135k implies a 265% gain — meaningful room to come down on a strong offer.
Risks & watch-outs
- Watch-outs: built in 1950 — expect roof / HVAC / electrical / plumbing capex.
- Climate carrying-cost: severe wind risk, 99% chance of damaging wind over 30y; extreme-heat days projected 7→19/yr by 2055 (HVAC capex compounding) — expect insurance premiums to compound above CPI over the hold.
Questions for the listing agent
- It's been on market 54 days. Have you received any prior offers? Is the seller open to a 11% concession, seller financing, or rate buy-down credit?
- Built in 1950 — when were the roof, HVAC, electrical panel, plumbing, and water heater last replaced?
- Is there a deadline driving the sale (1031 exchange, divorce, estate, relocation)? That informs how much negotiation room exists.
- Schools are B-rated — typically a magnet for longer-tenancy family renters. What's the average tenant stay here, and is there a school-zone premium baked into asking?
- What's the average days-on-market for RENTAL listings here right now (not sales)? A rising rental-DOM trend means longer vacancies and softer asking-rent achievability than the comps imply.
- What's the recent tenant-quality profile in this submarket — average credit score on applications, eviction rate, late-payment / NSF rate, and stable-employment percentage? A property-management company in the area should have these aggregated.
- How much new for-sale + rental construction is in the pipeline within 1–3 miles? Heavy new supply typically softens prices + rents 12–24 months out; constrained supply supports both.
Investment metrics
- 1% rule
- 0.89% ✗
- Cap rate
- 7.69%
- Cash-on-cash
- 5.00%
- DSCR
- 1.22
- GRM
- 9.3
CMA / ARV
- ARV (on-the-fly)
- $78,416
- Comps found
- 12
Show comp detail 12 sales within ~0.75 mi
| Address | Dist | Beds/Ba | Sqft | Sold | Price | $/sf | Match |
|---|---|---|---|---|---|---|---|
| 3138 N 3rd St Cir | 0.00mi | 2/1.0 | 754 (0%) | 0mo | $135,000 | $179 | 100 |
| 1317 St Clair St | 0.31mi | 2/1.0 | 768 (+2%) | 2mo | $81,500 | $106 | 80 |
| 2932 Rhonda Rd | 0.32mi | 2/1.0 | 750 (-0%) | 7mo | $78,000 | $104 | 78 |
| 3040 Columbus Ave | 0.49mi | 2/1.0 | 756 (+0%) | 2mo | $130,625 | $173 | 74 |
| 1066 Detroit Cir W | 0.22mi | 2/1.0 | 828 (+10%) | 3mo | $72,000 | $87 | 71 |
| 1073 Melson Ave | 0.21mi | 3/1.0 (+1) | 816 (+8%) | 2mo | $45,000 | $55 | 69 |
| 3527 Hyacinth St | 0.58mi | 3/1.0 (+1) | 784 (+4%) | 1mo | $135,000 | $172 | 60 |
| 3044 W 9th St W | 0.35mi | 2/1.0 | 852 (+13%) | 2mo | $55,000 | $65 | 60 |
| 1739 Melson Ave | 0.31mi | 3/1.0 (+1) | 849 (+13%) | 7mo | $78,500 | $92 | 54 |
| 1023 Ontario St | 0.64mi | 2/1.0 | 840 (+11%) | 2mo | $33,000 | $39 | 50 |
| 930 Ontario St | 0.69mi | 2/1.0 | 815 (+8%) | 9mo | $73,500 | $90 | 46 |
| 3518 Acacia St | 0.61mi | 3/1.0 (+1) | 836 (+11%) | 6mo | $130,000 | $156 | 43 |
Match score weights: distance 35% · size 25% · config 20% · recency 20%. Top-matched comps best support the ARV.
Projected returns pro-forma
3.41% appreciation · 1.7% rent growth · sell at horizon
- IRR
- 12.6%
- Equity multiple
- 1.73×
- Total profit
- $27,640
- Equity at exit
- $63,864
- IRR
- 13.8%
- Equity multiple
- 3.08×
- Total profit
- $78,617
- Equity at exit
- $100,954
Cash invested: $37,800 (down + closing). Projections, not guarantees.
Landlord ↔ Tenant lean methodology
- Overall (STATE)
- 87 Strongly Landlord-Friendly
- State Florida
- 87 Strongly Landlord-Friendly · R+3
- County
- — inherits STATE
- City
- — inherits STATE
ZIP-level market 32254
- Home prices YoY
- 1.2%
- Rents YoY
- 1.7%
- Active inventory
- 172
- Price-to-rent
- 9.3×
Monthly cashflow live
- Estimated rent
- $1,204 high interval (Pro) →
- Mortgage (P&I)
- −$708
- Tax from tax record
- −$30 /mo · $355/yr
- Insurance
- −$56
- HOA
- −$0
- Vacancy / Maint / Mgmt
- −$253
- Net cashflow
- $157
Break-even live
UW: 25.0% down · 7.5% · 30yr · 1.5% tax · 5.0% vac · 8.0% maint · 8.0% mgmt
Financing live
Cash to close
- Down payment
- $33,750
- Closing costs
- $4,050
- Reserves months
- —
- Total cash needed
- —
Loan-product check · same deal, 3 products live
Conventional
25% down · 7.5% · 30yr
- Down + closing
- —
- Monthly P&I
- —
- Monthly cashflow
- —
- DSCR
- —
- Eligible?
- —
Personal DTI + credit; lowest rate.
DSCR
20% down · 8.5% · 30yr
- Down + closing
- —
- Monthly P&I
- —
- Monthly cashflow
- —
- DSCR
- —
- Eligible?
- —
No personal income docs; deal must DSCR.
Hard money
10% down · 12.0% · 12mo
- Down + closing
- —
- Monthly P&I
- —
- Monthly cashflow
- —
- DSCR
- —
- Eligible?
- —
Short-term bridge; refi at stabilization.
Rent comps 40 comps
| Address | Beds | Baths | Sqft | Rent | $/sqft | DOM | Units | Dist |
|---|---|---|---|---|---|---|---|---|
| 3055 2nd Street Cir Jacksonville, FL | 3.0 | 1.5 | 1050 | $1,340 | $1.28 | 17d | 1 | 0.07mi |
| 3101 3rd Street Cir N Jacksonville, FL | 2.0 | 1.0 | 870 | $1,150 | $1.32 | 8d | 1 | 0.07mi |
| 1227 Dena St Jacksonville, FL | 3.0 | 1.0 | 1033 | $1,325 | $1.28 | 24d | 1 | 0.12mi |
| 2965 Sunset St Jacksonville, FL | 3.0 | 1.5 | 1056 | $1,375 | $1.30 | 8d | 1 | 0.20mi |
| 2965 Sunset St Jacksonville, FL | 3.0 | 2.0 | 1056 | $1,375 | $1.30 | 4d | 1 | 0.20mi |
| 1612 Alfen St Jacksonville, FL | 3.0 | 1.5 | 945 | $1,113 | $1.18 | 8d | 1 | 0.23mi |
| 2913 W 2nd St Jacksonville, FL | 2.0 | 1.0 | 720 | $1,000 | $1.39 | 2d | 1 | 0.27mi |
| 2862 W 1st St Unit 1 Jacksonville, FL | 2.0 | 1.0 | 800 | $895 | $1.12 | 15d | 1 | 0.33mi |
| 2862 W 1st St Jacksonville, FL | 2.0 | 1.0 | 800 | $895 | $1.12 | 4d | 1 | 0.33mi |
| 3326 W 1st St Jacksonville, FL | 2.0 | 1.0 | 791 | $995 | $1.26 | 24d | 1 | 0.34mi |
| 1037 Detroit St Jacksonville, FL | 3.0 | 2.0 | 912 | $1,250 | $1.37 | 2d | 1 | 0.34mi |
| 2852 W 1st St Jacksonville, FL | 2.0 | 1.0 | 800 | $895 | $1.12 | 8d | 1 | 0.34mi |
| 1085 Saint Clair St Jacksonville, FL | 1.0 | 1.0 | 600 | $795 | $1.32 | 24d | 1 | 0.35mi |
| 1021 Woodstock Ave Jacksonville, FL | 3.0 | 2.0 | 1012 | $1,495 | $1.48 | 8d | 1 | 0.36mi |
| 1021 Woodstock Ave Jacksonville, FL | 3.0 | 2.0 | 1012 | $1,495 | $1.48 | 24d | 1 | 0.36mi |
| 2851 Sophia St Jacksonville, FL | 2.0 | 1.0 | 846 | $1,000 | $1.18 | 24d | 3 | 0.38mi |
| 3359 Columbus Ave Jacksonville, FL | 1.0 | 1.0 | 550 | $1,000 | $1.82 | 24d | 1 | 0.53mi |
| 3359 Columbus Ave Jacksonville, FL | 1.0 | 1.0 | 525 | $1,000 | $1.90 | 12d | 1 | 0.53mi |
| 3357 Columbus Ave Jacksonville, FL | 1.0 | 1.0 | 550 | $1,000 | $1.82 | 17d | 1 | 0.53mi |
| 3368 Columbus Ave Jacksonville, FL | 2.0 | 1.0 | 955 | $1,300 | $1.36 | 4d | 1 | 0.56mi |
| 2939 W 11th St Jacksonville, FL | 3.0 | 1.0 | 1086 | $1,295 | $1.19 | 24d | 1 | 0.56mi |
| 3012 Imperial St Jacksonville, FL | 3.0 | 1.0 | 1089 | $1,395 | $1.28 | 24d | 1 | 0.61mi |
| 912 Huron St Jacksonville, FL | 2.0 | 1.0 | 900 | $1,100 | $1.22 | 15d | 1 | 0.62mi |
| 2854 Wickwire St Jacksonville, FL | 2.0 | 1.0 | 948 | $1,300 | $1.37 | 4d | 1 | 0.64mi |
| 3303 Broadway Ave Jacksonville, FL | 3.0 | 2.0 | 1072 | $1,550 | $1.45 | 4d | 1 | 0.66mi |
| 3138 W 15th St Jacksonville, FL | 2.0 | 1.0 | 734 | $1,150 | $1.57 | 8d | 1 | 0.70mi |
| 3138 W 15th St Jacksonville, FL | 2.0 | 1.0 | 734 | $1,150 | $1.57 | 24d | 1 | 0.70mi |
| 841 Ontario St Jacksonville, FL | 2.0 | 1.0 | 1000 | $1,285 | $1.28 | 24d | 1 | 0.78mi |
| 3305 Sunnybrook Ave N Jacksonville, FL | 2.0 | 1.0 | 1012 | $1,021 | $1.01 | 24d | 1 | 0.78mi |
| 3350 Sunnybrook Ave N Jacksonville, FL | 2.0 | 1.0 | 900 | $1,095 | $1.22 | 24d | 1 | 0.82mi |
| 3433 Brookhaven Dr Jacksonville, FL | 2.0 | 1.0 | 754 | $1,295 | $1.72 | 8d | 1 | 0.85mi |
| 2587 Orchard St Jacksonville, FL | 2.0 | 2.0 | 992 | $1,295 | $1.31 | 8d | 1 | 0.93mi |
| 5148 Cain Ln Jacksonville, FL | 3.0 | 1.0 | 1104 | $1,306 | $1.18 | 21d | 1 | 1.06mi |
| 1213 Moat St Jacksonville, FL | 2.0 | 2.5 | 1022 | $1,283 | $1.26 | 17d | 1 | 1.13mi |
| 2325 Westbrook Cir N Jacksonville, FL | 3.0 | 2.0 | 812 | $1,200 | $1.48 | 24d | 1 | 1.15mi |
| 2627 Wylene St Jacksonville, FL | 2.0 | 2.0 | 594 | $1,400 | $2.36 | 24d | 1 | 1.20mi |
| 5364 Mary Budd Ave Jacksonville, FL | 3.0 | 2.0 | 836 | $1,225 | $1.47 | 3d | 1 | 1.21mi |
| 3515 Dignan St Jacksonville, FL | 3.0 | 1.0 | 915 | $1,036 | $1.13 | 3d | 1 | 1.24mi |
| 3318 Dignan St Jacksonville, FL | 3.0 | 2.0 | 960 | $1,200 | $1.25 | 24d | 1 | 1.30mi |
| 3323 Nolan St Jacksonville, FL | 3.0 | 1.0 | 927 | $1,050 | $1.13 | 2d | 1 | 1.32mi |
Listing history 6 events
-
2026-04-29status Pending
-
2026-03-06$135,000 Active
-
2025-04-30soldstatus $37,000
-
1985-11-01soldstatus $21,000
-
1985-06-01soldstatus $18,000
-
1982-05-01soldstatus $19,900
ⓘ Source: listings_history table (triggers on properties + properties_extension) + one-shot
backfill from property_details.listing_events for pre-trigger history.
Tax reassessment forecast FL · Resets to sale price
- Current annual tax
- $355 · $30/mo
- Projected year-2 tax
- $1,120 · $93/mo
- Expected delta
- +$765/yr (+$64/mo · 215.2%)
ⓘ Screening estimate from a state-policy table — verify with the county assessor before closing.
Climate risk First Street
- Flood 1/10 Low FEMA zone X (unshaded) · 0% chance over 30 yrs
- Wildfire 2/10 Low
- Heat 9/10 Extreme 7 d/yr ≥107°F today · 19 d/yr by 30 yrs out
- Wind 9/10 Extreme 99% chance of damaging wind over 30 yrs
- Air quality 5/10 Major 7 unhealthy d/yr today · 7 by 30 yrs out
Nearby sold comps map
Loading sold comps map…
Walkable amenities ~0.75 mi
Loading nearby amenities…
Taxation est. · year 1
- Rental income
- $14,450
- − Mortgage interest
- −$7,562
- − Property taxes
- −$355
- − Insurance
- −$675
- − Repairs & maintenance
- −$1,156
- − Management
- −$1,156
- − Depreciation
- −$3,927
- Taxable loss
- −$382
- Est. tax savings @ 24.0%
- +$92
- After-tax cash flow
- $1,981/yr
For passive investors: Depreciation is non-cash, so a rental often shows a tax loss while cash-flowing — sheltering income. Rental losses are passive: they offset passive income freely, and up to $25,000/yr can offset ordinary (W-2) income if you actively participate and your MAGI is under $100k (phasing out to $0 by $150k); unused losses carry forward. On sale, claimed depreciation is recaptured at up to 25%, and gains may owe capital-gains tax (a 1031 exchange can defer both). Figures are a year-1 estimate at your 24.0% rate — not tax advice; consult a CPA.
Schools (NCES district)
- District
- Duval
- NCES district ID
- 1200480
- Math proficiency
- 46% ▼ -11.00%
- Reading proficiency
- 45% ▼ -4.00%
- Median HH income
- $48,987
- Composite
- 38.97/100
- National rank
- #4076
- State rank
- #48 of 73 in FL
Livability — Jacksonville
- Score
- 83/100
- State rank
- #50
- US rank
- #911
Category grades
Schools grade is shown separately in the Schools card above.
Census & demographics
- Census place
- Jacksonville, FL
- County
- Duval County · 1,015,274 people
- City population
- 979,034
- Metro
- Jacksonville, FL
- Population (ZIP)
- 13,927
- Household income
- $34,953
- Rent vs Own
- Severe rent burden
- 882.0
Population outlook (Duval County) Hauer SSP2
- Today (2025)
- 1,013,010 people
- By 2030
- 1,059,228 · +4.6%
- By 2040
- 1,141,439 · +12.7%
- By 2050
- 1,205,258 · +19.0%
- By 2075
- 1,324,282 · +30.7%
- By 2100
- 1,319,620 · +30.3%
Race, ethnicity, and origin ACS 2023
- Neighborhood character
- Diverse neighborhood (Simpson 0.56)
- Race & ethnicity
- Black 60% White 28% Two or more races 7% Hispanic / Latino 5%
- Hispanic origin (detail)
- Puerto Rican 1%
- Common ancestry
- Slovak 1% Hispanic 1% Lithuanian 1%
- Foreign-born
- 4% · Canada
- Languages at home
- 94% English-only · Spanish 4% French/Haitian/Cajun 2%
Political lean MEDSL · Duval
- 2024 margin
- Toss-up / Even · D 48.7% · R 50.1% · Other 1.2%
- 2008→2024 swing
- +0.4pp no change · 2008: -1.9pp · 2024: -1.5pp
- All cycles
- 2024: R+1.5 2020: D+3.8 2016: R+1.5 2012: R+3.6 2008: R+1.9
Not yet ingested
- Civics
- —
Market trends
- HPI YoY
- ▲ 3.41%
- Current HPI
- 282.2981
- Rent YoY
- ▲ 1.70%
- Metro
- Jacksonville, FL
- State GDP YoY
- ▲ 3.28%
- F500 in state
- 36
Industry mix (Fortune 500 HQ in FL)
| Industry | F500 HQs | Revenue |
|---|---|---|
| Industrial Technology | 2 | $29B |
|
||
| Insurance | 2 | $17B |
|
||
| Retail | 1 | $60B |
|
||
| Technology Distribution | 1 | $58B |
|
||
| Homebuilding | 1 | $35B |
|
||
| Technology Manufacturing | 1 | $35B |
|
||
Price history
+578.4% since first listed6 events — show timeline
- 2026-04-29 Pending — realMLS
- 2026-03-06 Listed $135,000 realMLS
- 2025-04-30 Sold (Public Records) $37,000 Public Records
- 1985-11-01 Sold (Public Records) $21,000 Public Records
- 1985-06-01 Sold (Public Records) $18,000 Public Records
- 1982-05-01 Sold (Public Records) $19,900 Public Records
Property tax history
+5.2%/yrLatest (2025): $355 · +95.5% YoY. Source: county tax records.
Cash-flow waterfall
monthlySold comps — $/sqft
last 12 mo · ≤1 miLoading sold comps…