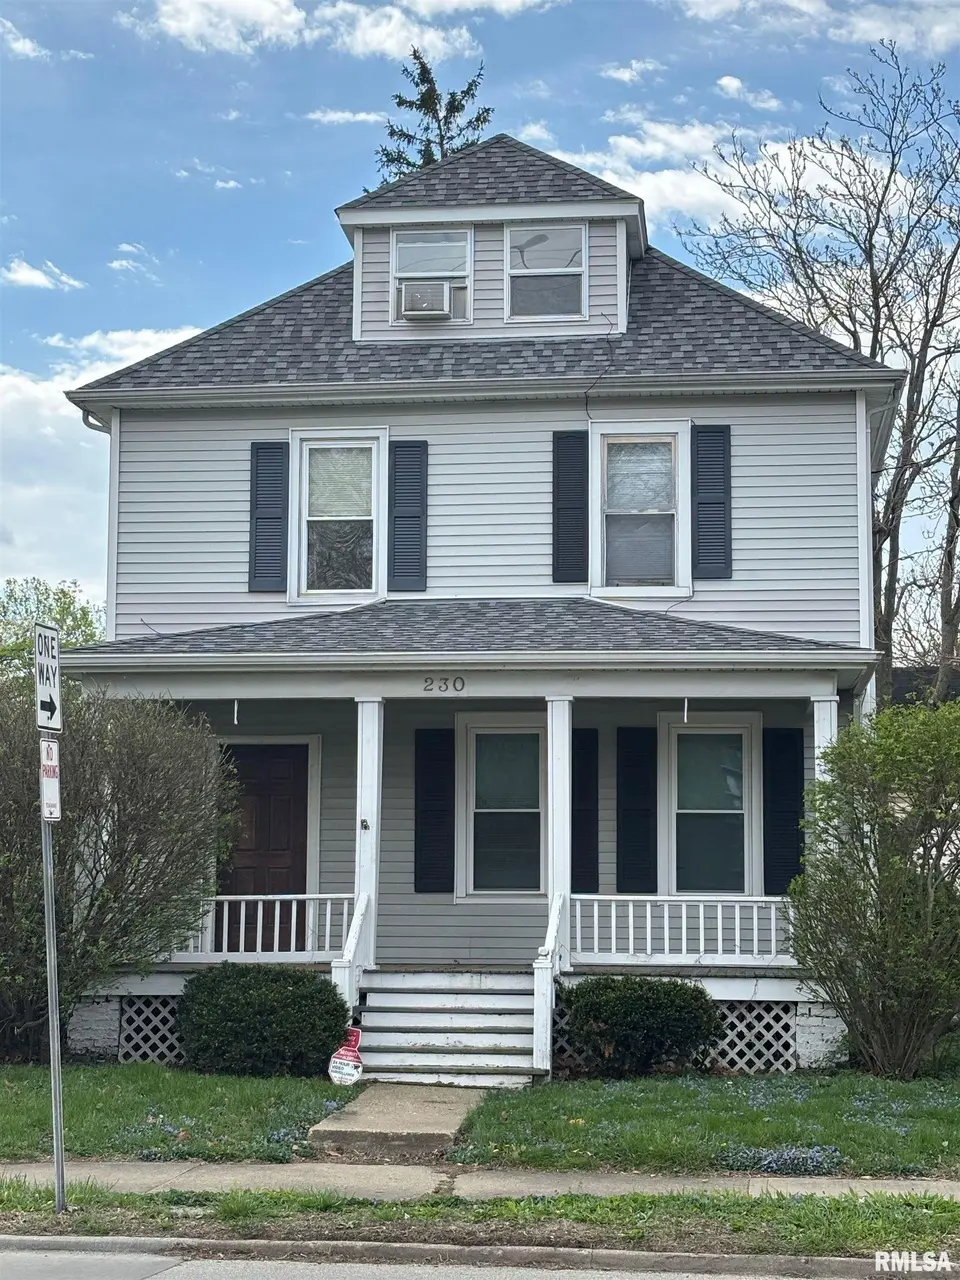
230 E Lawrence Ave · Springfield, IL
Flood risk 1/10 · Minimal
- FEMA flood zone
- X (unshaded)
- Chance of flooding over 30 yrs
- 0.0%
- Est. flood insurance / yr
- $473 – $860
Fire risk 1/10 · Minimal
- Est. fire insurance / yr
- $804 – $1,492
Heat risk 4/10 · Minor
- Hot days now (above 105°F)
- 7 days/yr
- Hot days in 30 yrs
- 20 days/yr
Wind risk 2/10 · Minimal
- Chance of severe wind over 30 yrs
- 1.0%
Air-quality risk 2/10 · Minimal
- Unhealthy air days now
- 1 days/yr
- Unhealthy air days in 30 yrs
- 2 days/yr
Risk factors via First Street. Map © Google.
Why this score? — see what drove the C grade
The composite is a weighted blend of 9 inputs, each scored 0–100. Each bar is that input's sub-score; the figure is the points it added to the 100-point composite (weight × sub-score).
- Cash flow +23.1/30.0
- ARV discount +7.5/15.0
- DSCR +7.4/10.0
- 1% rule +6.0/10.0
- Rent growth +4.1/5.0
- Livability +4.0/5.0
- Condition / age +2.5/5.0
- Schools +1.7/10.0
- Appreciation +0.0/10.0
$120,000
🖨 Deal sheet 📄 Offer letter ✓ Due diligence
Listing remarks
Affordable living close to downtown, State Capitol, State office buildings and medical centers, or an attractive investment opportunity. This 3 story property offers 3-4 bedrooms, 1.5 baths, & main floor laundry. The charm of the past is evident in the hardwood floors, glass french doors between the formal dining room & living room. 7 windows throught out the house were recently replaced (2020). New roof 2022. Eat-in kitchen with stylish exposed brick chimney. 1/2 bath on main floor. Second floor has 3 bedrooms & full bath, 3rd floor has 4th bedroom with large walk-in closet, or perfect space for in home office, play room, etc. Railroad relocation is scheduled to remove tr
Key facts
- Glass french doors
- Large walk-in closet
- Hardwood floors
Tags
Property features AI
Exterior
- Parking: Parking pad (no garage)
- Utilities: Public water; Public sewer
- Home design: Single-family residence; Two levels; Built in 1905
- Construction: Shingle roof; Unfinished basement
- Exterior features: Corner, level lot; Paved road access; Shingle roof; Unfinished basement
Interior
- Kitchen: Refrigerator
- Bedrooms: 3 bedrooms (bedrooms located on upper levels; one additional bedroom/room on third floor)
- Flooring: Carpet in upper-level bedrooms and additional rooms; Hardwood in main-level living and dining rooms; Laminate in kitchen and laundry
- Bathrooms: 1 full bathroom; 1 half bathroom
- Heating & cooling: Central air; Forced air heating; Gas water heater; Window unit(s)
- Interior features: Vaulted/cathedral/tray ceilings; Ceiling fan(s)
- Laundry & utility: Washer; Dryer; Main-level laundry
Neighborhood map
What this means for you Summary
Snapshot
- This is a 3-bed/1.5-bath other listed at $120k.
Deal economics
- At list price, monthly cash flow is $214 ($3k/yr) — positive.
- The deal already cash-flows at list — no discount required.
- Meets the 1% rule at list price ($1k rent vs $120k).
- Cap rate 8.4% vs local median 4.9% in Springfield — top-decile yield for the area; either an underpriced asset or a hidden risk that comps aren't pricing in. Stress-test before assuming the spread holds.
Location & tenants
- Location reads 79/100 on livability (#122 in IL, #2,138 nationally) — a middle-class / working-renter tenant base. Strengths: amenities A+, commute A+, cost of living A+; Watch: schools D+, crime F.
- Springfield SD 186 (urban): math 17% / reading 22% proficiency, ranked #438 of 620 in IL (top 71%) — low school quality limits family demand, transient renter base, plan for 1-2y turnover; 64% free/reduced lunch — lower-income household profile, screen leases tightly.
- Market conditions: Rents rising fast (+6.3%/yr); 177 active listings in the ZIP; 15 comparable units currently listed for rent nearby; rentals lingering (median 44d on market — plan ~5-8 weeks vacancy on turnover, expect pricing pressure); 73% of comp listings sitting > 30 days — soft ceiling on asking rent; 225 units permitted in Sangamon County in 2024 (48 in 5+ unit buildings).
Forward outlook
- Local home prices are declining (-3.0%/yr); year-one equity from $830 of loan paydown is wiped out by about $4k of value loss. Plan a longer hold.
- Sangamon County population projected to shrink 9% by 2050 — rents likely to lag national; underwrite the cash flow, not the appreciation.
- At projected returns (-3.0% appreciation + 6.3% rent growth), your $34k cash investment doubles in ~9 years — after that, you're playing with house money.
Negotiation context
- Only 14 days on market — expect competitive offers; lowballing is unlikely to land.
Risks & watch-outs
- Watch-outs: built in 1905 — expect roof / HVAC / electrical / plumbing capex.
Questions for the listing agent
- Built in 1905 — when were the roof, HVAC, electrical panel, plumbing, and water heater last replaced?
- Is there a deadline driving the sale (1031 exchange, divorce, estate, relocation)? That informs how much negotiation room exists.
- Schools are D-rated, which usually means shorter tenancies and higher turnover. Who's the typical renter profile here, and what's been the actual vacancy rate?
- Crime grade is F in this area — have there been break-ins, vandalism, or insurance claims at this property in the last 3 years? What carrier currently insures it and at what premium?
- What's the average days-on-market for RENTAL listings here right now (not sales)? A rising rental-DOM trend means longer vacancies and softer asking-rent achievability than the comps imply.
- What's the recent tenant-quality profile in this submarket — average credit score on applications, eviction rate, late-payment / NSF rate, and stable-employment percentage? A property-management company in the area should have these aggregated.
- How much new for-sale + rental construction is in the pipeline within 1–3 miles? Heavy new supply typically softens prices + rents 12–24 months out; constrained supply supports both.
Investment metrics
- 1% rule
- 1.10% ✓
- Cap rate
- 8.44%
- Cash-on-cash
- 7.66%
- DSCR
- 1.34
- GRM
- 7.6
CMA / ARV
No comps found within radius.
Projected returns pro-forma
-3.0% appreciation · 6.32% rent growth · sell at horizon
- IRR
- -0.9%
- Equity multiple
- 0.96×
- Total profit
- $-1,192
- Equity at exit
- $17,892
- IRR
- 12.0%
- Equity multiple
- 2.09×
- Total profit
- $36,722
- Equity at exit
- $10,375
Cash invested: $33,600 (down + closing). Projections, not guarantees.
Landlord ↔ Tenant lean methodology
- Overall (STATE)
- 43 Moderately Tenant-Leaning
- State Illinois
- 43 Moderately Tenant-Leaning · D+7
- County
- — inherits STATE
- City
- — inherits STATE
ZIP-level market 62704
- Home prices YoY
- -31.1%
- Rents YoY
- 6.3%
- Active inventory
- 177
- Price-to-rent
- 7.6×
Monthly cashflow live
- Estimated rent
- $1,324 high interval (Pro) →
- Mortgage (P&I)
- −$629
- Tax from tax record
- −$152 /mo · $1,829/yr
- Insurance
- −$50
- HOA
- −$0
- Vacancy / Maint / Mgmt
- −$278
- Net cashflow
- $214
Break-even live
UW: 25.0% down · 7.5% · 30yr · 1.5% tax · 5.0% vac · 8.0% maint · 8.0% mgmt
Financing live
Cash to close
- Down payment
- $30,000
- Closing costs
- $3,600
- Reserves months
- —
- Total cash needed
- —
Loan-product check · same deal, 3 products live
Conventional
25% down · 7.5% · 30yr
- Down + closing
- —
- Monthly P&I
- —
- Monthly cashflow
- —
- DSCR
- —
- Eligible?
- —
Personal DTI + credit; lowest rate.
DSCR
20% down · 8.5% · 30yr
- Down + closing
- —
- Monthly P&I
- —
- Monthly cashflow
- —
- DSCR
- —
- Eligible?
- —
No personal income docs; deal must DSCR.
Hard money
10% down · 12.0% · 12mo
- Down + closing
- —
- Monthly P&I
- —
- Monthly cashflow
- —
- DSCR
- —
- Eligible?
- —
Short-term bridge; refi at stabilization.
Rent comps 15 comps
| Address | Beds | Baths | Sqft | Rent | $/sqft | DOM | Units | Dist |
|---|---|---|---|---|---|---|---|---|
| 229 W Allen St Springfield, IL | 3.0 | 1.5 | 1050 | $1,305 | $1.24 | 21d | 1 | 0.42mi |
| 1214 S 7th St Unit C Springfield, IL | 3.0 | 1.0 | 1200 | $1,350 | $1.12 | 43d | 1 | 0.46mi |
| 525 E Pine St Springfield, IL | 2.0 | 2.0 | 1250 | $1,200 | $0.96 | 43d | 1 | 0.57mi |
| 525 E Pine St Unit 4 Springfield, IL | 2.0 | 2.0 | 1250 | $1,200 | $0.96 | 21d | 1 | 0.57mi |
| 400 E Jefferson St Springfield, IL | 2.0 | 1.0 | 1420 | $1,220 | $0.86 | 43d | 1 | 0.60mi |
| 1104 S 11th St Unit A Springfield, IL | 3.0 | 1.0 | 1200 | $1,000 | $0.83 | 43d | 1 | 0.65mi |
| 1600 S 6th St Unit 1 Springfield, IL | 3.0 | 2.0 | 1100 | $1,250 | $1.14 | 21d | 1 | 0.67mi |
| 1726 S 6th St Springfield, IL | 3.0 | 1.5 | 1408 | $1,500 | $1.07 | 43d | 1 | 0.77mi |
| 922 Governor St Springfield, IL | 3.0 | 1.0 | 1682 | $1,200 | $0.71 | 43d | 1 | 0.86mi |
| 1933 S 2nd St Springfield, IL | 4.0 | 2.0 | 1433 | $1,400 | $0.98 | 43d | 1 | 1.01mi |
| 1213 E Ash St Springfield, IL | 3.0 | 2.0 | 1861 | $2,030 | $1.09 | 21d | 1 | 1.21mi |
| 2257 S 10th St Springfield, IL | 2.0 | 1.0 | 1100 | $1,150 | $1.05 | 43d | 1 | 1.37mi |
| 1929 E Spruce St Springfield, IL | 3.0 | 1.0 | 1500 | $1,300 | $0.87 | 43d | 1 | 1.42mi |
| 2328 S 10th St Springfield, IL | 3.0 | 1.0 | 1100 | $1,200 | $1.09 | 43d | 1 | 1.47mi |
| 401 W Elliott Ave Unit A Springfield, IL | 3.0 | 1.0 | 1100 | $1,300 | $1.18 | 43d | 1 | 1.47mi |
Listing history 7 events
-
2026-06-19days on market $120,000 Active 14 DOM
-
2026-06-18days on market $120,000 Active 13 DOM
-
2026-06-17days on market $120,000 Active 12 DOM
-
2026-06-16days on market $120,000 Active 11 DOM
-
2026-06-15days on market $120,000 Active 10 DOM
-
2026-06-14remarks 687-char remark
-
2026-06-14$120,000 Active 8 DOM
ⓘ Source: listings_history table (triggers on properties + properties_extension) + one-shot
backfill from property_details.listing_events for pre-trigger history.
Tax reassessment forecast IL · Partial reset (capped growth)
- Current annual tax
- $1,829 · $152/mo
- Projected year-2 tax
- $2,277 · $190/mo
- Expected delta
- +$447/yr (+$37/mo · 24.5%)
ⓘ Screening estimate from a state-policy table — verify with the county assessor before closing.
Climate risk First Street
- Flood 1/10 Low FEMA zone X (unshaded) · 0% chance over 30 yrs
- Wildfire 1/10 Low
- Heat 4/10 Moderate 7 d/yr ≥105°F today · 20 d/yr by 30 yrs out
- Wind 2/10 Low 100% chance of damaging wind over 30 yrs
- Air quality 2/10 Low 1 unhealthy d/yr today · 2 by 30 yrs out
Nearby sold comps map
Loading sold comps map…
Walkable amenities ~0.75 mi
Loading nearby amenities…
Taxation est. · year 1
- Rental income
- $15,892
- − Mortgage interest
- −$6,722
- − Property taxes
- −$1,829
- − Insurance
- −$600
- − Repairs & maintenance
- −$1,271
- − Management
- −$1,271
- − Depreciation
- −$3,491
- Taxable income
- $707
- Est. tax owed @ 24.0%
- −$170
- After-tax cash flow
- $2,404/yr
For passive investors: Depreciation is non-cash, so a rental often shows a tax loss while cash-flowing — sheltering income. Rental losses are passive: they offset passive income freely, and up to $25,000/yr can offset ordinary (W-2) income if you actively participate and your MAGI is under $100k (phasing out to $0 by $150k); unused losses carry forward. On sale, claimed depreciation is recaptured at up to 25%, and gains may owe capital-gains tax (a 1031 exchange can defer both). Figures are a year-1 estimate at your 24.0% rate — not tax advice; consult a CPA.
Schools (NCES district)
- District
- Springfield SD 186
- NCES district ID
- 1737080
- Math proficiency
- 17% ▼ -7.00%
- Reading proficiency
- 22% ▼ -5.00%
- Median HH income
- $43,744
- Composite
- 16.89/100
- National rank
- #9142
- State rank
- #438 of 620 in IL
Livability — Springfield
- Score
- 79/100
- State rank
- #122
- US rank
- #2138
Category grades
Schools grade is shown separately in the Schools card above.
Census & demographics
- Census place
- Springfield, IL
- County
- Sangamon County · 115,414 people
- City population
- 59,955
- Metro
- Springfield, IL
- Population (ZIP)
- 40,046
- Household income
- $69,976
- Rent vs Own
- Severe rent burden
- 1529.0
Population outlook (Sangamon County) Hauer SSP2
- Today (2025)
- 198,317 people
- By 2030
- 196,127 · -1.1%
- By 2040
- 188,664 · -4.9%
- By 2050
- 179,624 · -9.4%
- By 2075
- 155,027 · -21.8%
- By 2100
- 122,588 · -38.2%
Race, ethnicity, and origin ACS 2023
- Neighborhood character
- Predominantly White (74%)
- Race & ethnicity
- White 74% Black 15% Two or more races 5% Hispanic / Latino 4% Asian 4%
- Common ancestry
- Lithuanian 2% Romanian 2% Slovak 2%
- Foreign-born
- 6% · Canada, China, Vietnam
- Languages at home
- 92% English-only · Spanish 2% Other Indo-European 1% Tagalog/Filipino 1%
Political lean MEDSL · Sangamon
- 2024 margin
- Toss-up / Even · D 46.6% · R 51.6% · Other 1.8%
- 2008→2024 swing
- -9.3pp toward R · 2008: 4.4pp · 2024: -5.0pp
- All cycles
- 2024: R+5.0 2020: R+4.4 2016: R+9.4 2012: R+8.7 2008: D+4.4
Not yet ingested
- Civics
- —
Market trends
- HPI YoY
- ▼ -70.79%
- Current HPI
- 156.7086
- Rent YoY
- ▲ 6.32%
- Metro
- Springfield, IL
- State GDP YoY
- ▲ 1.59%
- F500 in state
- 60
Industry mix (Fortune 500 HQ in IL)
| Industry | F500 HQs | Revenue |
|---|---|---|
| Insurance | 4 | $201B |
|
||
| Consumer Goods | 4 | $87B |
|
||
| Industrial Machinery | 3 | $64B |
|
||
| Healthcare | 2 | $55B |
|
||
| Retail / Pharmacy | 1 | $148B |
|
||
| Agriculture / Food | 1 | $86B |
|
||
Property tax history
+1.7%/yrLatest (2025): $1,829 · +3.3% YoY. Source: county tax records.
Cash-flow waterfall
monthlySold comps — $/sqft
last 12 mo · ≤1 miLoading sold comps…