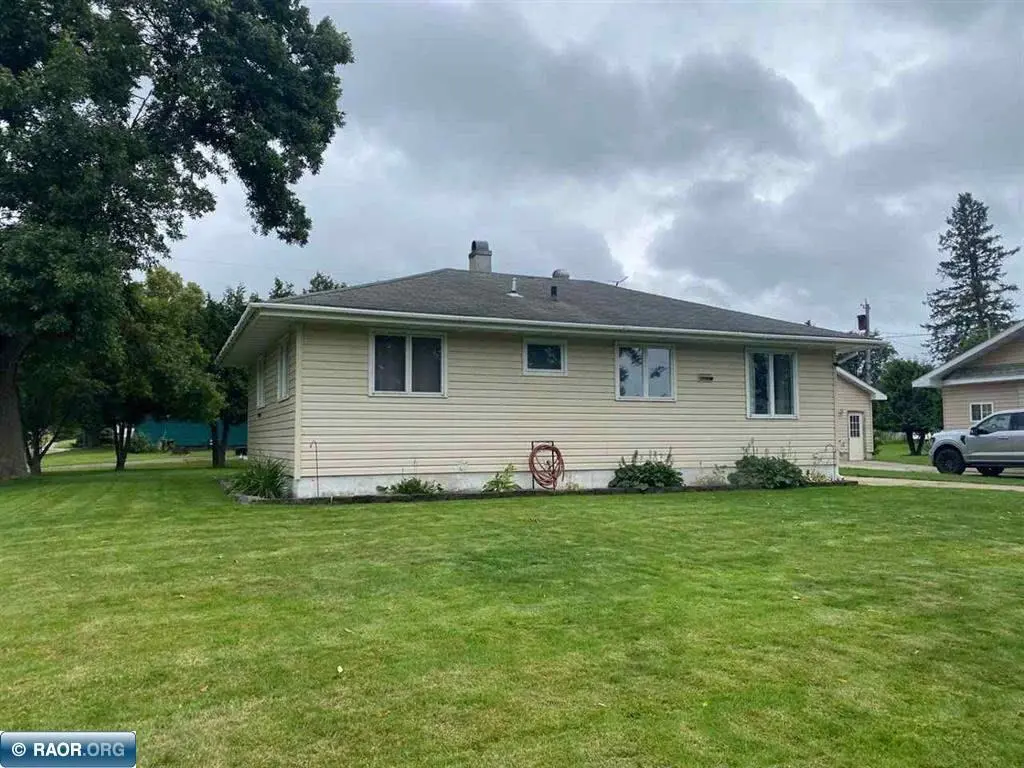
228 Elmwood Rd · Hoyt Lakes, MN
Flood risk 1/10 · Minimal
- FEMA flood zone
- —
- Chance of flooding over 30 yrs
- 0.0%
- Est. flood insurance / yr
- —
Fire risk 4/10 · Minor
- Est. fire insurance / yr
- $888 – $1,650
Heat risk 1/10 · Minimal
- Hot days now (above 90°F)
- 7 days/yr
- Hot days in 30 yrs
- 13 days/yr
Wind risk 1/10 · Minimal
- Chance of severe wind over 30 yrs
- —
Air-quality risk 2/10 · Minimal
- Unhealthy air days now
- 0 days/yr
- Unhealthy air days in 30 yrs
- 1 days/yr
Risk factors via First Street. Map © Google.
Why this score? — see what drove the D- grade
The composite is a weighted blend of 9 inputs, each scored 0–100. Each bar is that input's sub-score; the figure is the points it added to the 100-point composite (weight × sub-score).
- Cash flow +13.8/30.0
- DSCR +4.2/10.0
- Livability +3.6/5.0
- Schools +3.2/10.0
- 1% rule +2.9/10.0
- ARV discount +2.6/15.0
- Rent growth +2.5/5.0
- Condition / age +2.5/5.0
- Appreciation +0.0/10.0
$147,500
🖨 Deal sheet (PDF) 📄 Offer letter ✓ Due diligence
Listing remarks MLS
Welcome home to this 3 bedroom 1 bath home nestled on a corner lot complete with a back deck and detached heated/insulated 24x28 garage. The main level features an updated eat in kitchen and living room with a sliding glass door heading to the back deck. Down the hall are 3 bedrooms and a full, updated bathroom. The lower level has a finished rec room, laundry room, and a new workout room. Main level living room is currently used as a dining room.
Key facts
- Finished rec room
- New workout room
- Back deck
Tags
Neighborhood map
What this means for you Summary
Snapshot
- This is a 3-bed/1.0-bath single-family listed at $148k.
Deal economics
- At list price, monthly cash flow is $12 ($149/yr) — positive.
- The deal already cash-flows at list — no discount required.
- To meet the 1% rule (rent ≥ 1% of price), the offer needs to be $117k (21.0% below list).
- Recommended offer: $117k (21.0% below list) — sets the bar for 1% rule.
Location & tenants
- Location reads 72/100 on livability (#270 in MN) — a middle-class / working-renter tenant base. Strengths: cost of living A+, housing A+, health & safety A+; Watch: employment C-, amenities F, commute F.
- Mesabi East School District (rural): math 27% / reading 47% proficiency, ranked #240 of 301 in MN (top 80%) — families likely to look elsewhere, expect single-tenant / working-renter base with shorter leases.
- Zoned schools: Mesabi East Elementary (math 33% / reading 47%, grade F, #600 of 857 statewide, top 70%, 474 students, 51% FRL); Mesabi East Secondary (math 12% / reading 47%, grade F, #354 of 471 statewide, top 77%, 415 students, 43% FRL).
- Market conditions: 23 active listings in the ZIP; 639 units permitted in St. Louis County in 2024 (338 in 5+ unit buildings).
Forward outlook
- Local home prices are declining (-3.0%/yr); year-one equity from $1k of loan paydown is wiped out by about $4k of value loss. Plan a longer hold.
Negotiation context
- It's been on market 47 days — a 3% lower offer ($143k) is reasonable based on typical stale-listing flexibility.
- 4 sale attempts since 12y ago with the ask held roughly flat each time — persistent listings suggest the price (not the market) is what's stuck; bring a comps-based counter.
- Current owner paid $74k; list at $148k implies a 98% gain — meaningful room to come down on a strong offer.
Risks & watch-outs
- Watch-outs: built in 1956 — expect roof / HVAC / electrical / plumbing capex.
Questions for the listing agent
- It's been on market 47 days. Have you received any prior offers? Is the seller open to a 21% concession, seller financing, or rate buy-down credit?
- Built in 1956 — when were the roof, HVAC, electrical panel, plumbing, and water heater last replaced?
- Is there a deadline driving the sale (1031 exchange, divorce, estate, relocation)? That informs how much negotiation room exists.
- Schools are D-rated, which usually means shorter tenancies and higher turnover. Who's the typical renter profile here, and what's been the actual vacancy rate?
- The area grade is low — what's the realistic commute time and amenity access for the typical tenant pool here? Any planned neighborhood developments (good or bad) we should know about?
- What's the average days-on-market for RENTAL listings here right now (not sales)? A rising rental-DOM trend means longer vacancies and softer asking-rent achievability than the comps imply.
- What's the recent tenant-quality profile in this submarket — average credit score on applications, eviction rate, late-payment / NSF rate, and stable-employment percentage? A property-management company in the area should have these aggregated.
- How much new for-sale + rental construction is in the pipeline within 1–3 miles? Heavy new supply typically softens prices + rents 12–24 months out; constrained supply supports both.
Investment metrics
- 1% rule
- 0.79% ✗
- Cap rate
- 6.39%
- Cash-on-cash
- 0.36%
- DSCR
- 1.02
- GRM
- 10.6
CMA / ARV
- ARV (median comp)
- $132,958
- List price
- $147,500
- Delta
- 10.94%
- Verdict
- OVERPRICED
- Comps
- 20 within 1.0 mi
Show comp detail 2 sales within ~0.75 mi
| Address | Dist | Beds/Ba | Sqft | Sold | Price | $/sf | Match |
|---|---|---|---|---|---|---|---|
| 415 Leeds Rd | 0.38mi | 3/1.0 | 864 (0%) | 2mo | $93,000 | $108 | 80 |
| 202 Dorchester Dr | 0.15mi | 3/1.0 | 950 (+10%) | 23mo | $80,000 | $84 | 57 |
Match score weights: distance 35% · size 25% · config 20% · recency 20%. Top-matched comps best support the ARV.
Projected returns pro-forma
-3.0% appreciation · 3.0% rent growth · sell at horizon
- IRR
- -15.8%
- Equity multiple
- 0.44×
- Total profit
- $-23,161
- Equity at exit
- $21,993
- IRR
- -7.4%
- Equity multiple
- 0.53×
- Total profit
- $-19,356
- Equity at exit
- $12,753
Cash invested: $41,300 (down + closing). Projections, not guarantees.
Landlord ↔ Tenant lean methodology
- Overall (STATE)
- 46 Balanced
- State Minnesota
- 46 Balanced · D+2
- County
- — inherits STATE
- City
- — inherits STATE
ZIP-level market 55750
- Home prices YoY
- -23.3%
- Active inventory
- 23
- Price-to-rent
- 10.6×
Monthly cashflow live
- Estimated rent
- $1,165 medium interval (Pro) →
- Mortgage (P&I)
- −$774
- Tax from tax record
- −$73 /mo · $876/yr
- Insurance
- −$61
- HOA
- −$0
- Vacancy / Maint / Mgmt
- −$245
- Net cashflow
- $12
Break-even live
Sensitivity live
| Price | -10% $96 | -5% $54 | +0% $12 | +5% $-29 | +10% $-71 |
|---|---|---|---|---|---|
| Rent | -10% $-80 | -5% $-34 | +0% $12 | +5% $58 | +10% $104 |
| Rate | -1.0pp $87 | -0.5pp $50 | base $12 | +0.5pp $-26 | +1.0pp $-65 |
UW: 25.0% down · 7.5% · 30yr · 1.5% tax · 5.0% vac · 8.0% maint · 8.0% mgmt
Financing live
Cash to close
- Down payment
- $36,875
- Closing costs
- $4,425
- Reserves months
- —
- Total cash needed
- —
Loan-product check · same deal, 3 products live
Conventional
25% down · 7.5% · 30yr
- Down + closing
- —
- Monthly P&I
- —
- Monthly cashflow
- —
- DSCR
- —
- Eligible?
- —
Personal DTI + credit; lowest rate.
DSCR
20% down · 8.5% · 30yr
- Down + closing
- —
- Monthly P&I
- —
- Monthly cashflow
- —
- DSCR
- —
- Eligible?
- —
No personal income docs; deal must DSCR.
Hard money
10% down · 12.0% · 12mo
- Down + closing
- —
- Monthly P&I
- —
- Monthly cashflow
- —
- DSCR
- —
- Eligible?
- —
Short-term bridge; refi at stabilization.
Listing history 14 events
-
2026-05-31days on market $147,500 Active 47 DOM
-
2026-05-30days on market $147,500 Active 46 DOM
-
2026-04-12$147,500 Active 451-char remark
Show marketing remark (451 chars)
Welcome home to this 3 bedroom 1 bath home nestled on a corner lot complete with a back deck and detached heated/insulated 24x28 garage. The main level features an updated eat in kitchen and living room with a sliding glass door heading to the back deck. Down the hall are 3 bedrooms and a full, updated bathroom. The lower level has a finished rec room, laundry room, and a new workout room. Main level living room is currently used as a dining room.
-
2025-09-19price $144,000
-
2019-08-02soldstatus $74,500
-
2019-07-31soldstatus $74,500
-
2019-06-22$78,500
-
2018-02-28soldstatus $64,000
-
2018-02-26soldstatus $64,000
-
2017-05-23$68,900
-
2014-05-19soldstatus $64,900
-
2014-04-30soldstatus $64,900
-
2014-03-14$64,900
-
2010-06-09soldstatus $50,000
ⓘ Source: listings_history table (triggers on properties + properties_extension) + one-shot
backfill from property_details.listing_events for pre-trigger history.
Tax reassessment forecast MN · Partial reset (capped growth)
- Current annual tax
- $876 · $73/mo
- Projected year-2 tax
- $1,264 · $105/mo
- Expected delta
- +$388/yr (+$32/mo · 44.3%)
ⓘ Screening estimate from a state-policy table — verify with the county assessor before closing.
Climate risk First Street
- Flood 1/10 Low 0% chance over 30 yrs
- Wildfire 4/10 Moderate
- Heat 1/10 Low 7 d/yr ≥90°F today · 13 d/yr by 30 yrs out
- Wind 1/10 Low
- Air quality 2/10 Low 0 unhealthy d/yr today · 1 by 30 yrs out
Nearby sold comps map
Loading sold comps map…
Walkable amenities ~0.75 mi
Loading nearby amenities…
Taxation est. · year 1
- Rental income
- $13,981
- − Mortgage interest
- −$8,262
- − Property taxes
- −$876
- − Insurance
- −$738
- − Repairs & maintenance
- −$1,118
- − Management
- −$1,118
- − Depreciation
- −$4,291
- Taxable loss
- −$2,423
- Est. tax savings @ 24.0%
- +$582
- After-tax cash flow
- $731/yr
For passive investors: Depreciation is non-cash, so a rental often shows a tax loss while cash-flowing — sheltering income. Rental losses are passive: they offset passive income freely, and up to $25,000/yr can offset ordinary (W-2) income if you actively participate and your MAGI is under $100k (phasing out to $0 by $150k); unused losses carry forward. On sale, claimed depreciation is recaptured at up to 25%, and gains may owe capital-gains tax (a 1031 exchange can defer both). Figures are a year-1 estimate at your 24.0% rate — not tax advice; consult a CPA.
Schools (NCES district)
- District
- Mesabi East School District
- NCES district ID
- 2791450
- Math proficiency
- 27% ▼ -17.00%
- Reading proficiency
- 47% ▼ -8.00%
- Median HH income
- $47,546
- Composite
- 31.69/100
- National rank
- #5922
- State rank
- #240 of 301 in MN
Livability — Hoyt Lakes
- Score
- 72/100
- State rank
- #270
- US rank
- #5844
Category grades
Schools grade is shown separately in the Schools card above.
Census & demographics
- Census place
- Hoyt Lakes, MN
- Population (ZIP)
- 2,078
Population outlook (St. Louis County) Hauer SSP2
- Today (2025)
- 202,411 people
- By 2030
- 203,234 · +0.4%
- By 2040
- 202,520 · +0.1%
- By 2050
- 200,853 · -0.8%
- By 2075
- 200,943 · -0.7%
- By 2100
- 192,058 · -5.1%
Race, ethnicity, and origin ACS 2023
- Neighborhood character
- Predominantly White (88%)
- Race & ethnicity
- White 88% Hispanic / Latino 7% Two or more races 6% Native American 3%
- Hispanic origin (detail)
- Mexican 5% Puerto Rican 1%
- Common ancestry
- Portuguese 19% Lithuanian 4% Romanian 4%
- Foreign-born
- 0%
- Languages at home
- 97% English-only · Spanish 3%
Political lean MEDSL · St. Louis
- 2024 margin
- D (+13.7) · D 55.9% · R 42.2% · Other 1.8%
- 2008→2024 swing
- -18.8pp toward R · 2008: 32.5pp · 2024: 13.7pp
- All cycles
- 2024: D+13.7 2020: D+15.6 2016: D+11.8 2012: D+29.6 2008: D+32.5
Not yet ingested
- Civics
- —
Market trends
- HPI YoY
- ▼ -52.12%
- Current HPI
- 171.9924
- Rent YoY
- —
- Metro
- —
- State GDP YoY
- ▲ 2.41%
- F500 in state
- 34
Industry mix (Fortune 500 HQ in MN)
| Industry | F500 HQs | Revenue |
|---|---|---|
| Healthcare | 2 | $407B |
|
||
| Retail | 2 | $150B |
|
||
| Consumer Goods | 2 | $32B |
|
||
| Industrial Machinery | 2 | $6B |
|
||
| Agriculture | 1 | $40B |
|
||
| Healthcare / Medical Devices | 1 | $32B |
|
||
Price history
+195.0% since first listed12 events — show timeline
- 2026-04-12 Listed $147,500 RAOR
- 2025-09-19 Price Changed $144,000 RAOR
- 2019-08-02 Sold (Public Records) $74,500 Public Records
- 2019-07-31 Sold (MLS) $74,500 RAOR
- 2019-06-22 Listed $78,500 RAOR
- 2018-02-28 Sold (Public Records) $64,000 Public Records
- 2018-02-26 Sold (MLS) $64,000 RAOR
- 2017-05-23 Listed $68,900 RAOR
- 2014-05-19 Sold (Public Records) $64,900 Public Records
- 2014-04-30 Sold (MLS) $64,900 RAOR
- 2014-03-14 Listed $64,900 RAOR
- 2010-06-09 Sold (Public Records) $50,000 Public Records
Property tax history
+7.8%/yrLatest (2025): $876 · -6.4% YoY. Source: county tax records.
Cash-flow waterfall
monthlySold comps — $/sqft
last 12 mo · ≤1 miLoading sold comps…