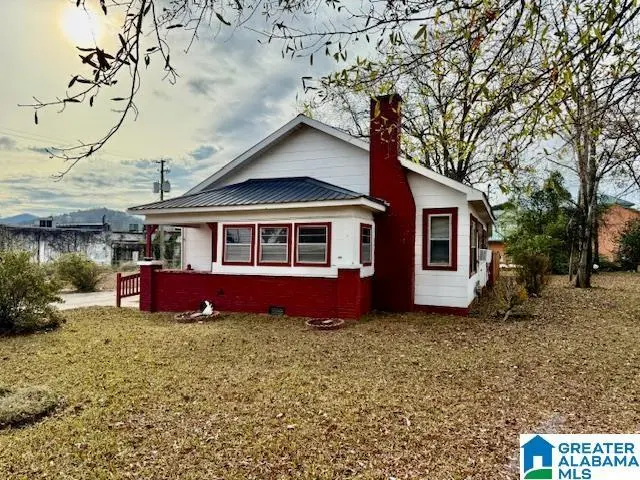
207 N Church St · Piedmont, AL
Flood risk 1/10 · Minimal
- FEMA flood zone
- X (unshaded)
- Chance of flooding over 30 yrs
- 0.0%
- Est. flood insurance / yr
- $507 – $1,088
Fire risk 5/10 · Moderate
- Est. fire insurance / yr
- $916 – $1,700
Heat risk 6/10 · Moderate
- Hot days now (above 104°F)
- 7 days/yr
- Hot days in 30 yrs
- 20 days/yr
Wind risk 4/10 · Minor
- Chance of severe wind over 30 yrs
- 22.0%
Air-quality risk 2/10 · Minimal
- Unhealthy air days now
- 1 days/yr
- Unhealthy air days in 30 yrs
- 2 days/yr
Risk factors via First Street. Map © Google.
Why this score? — see what drove the C+ grade
The composite is a weighted blend of 9 inputs, each scored 0–100. Each bar is that input's sub-score; the figure is the points it added to the 100-point composite (weight × sub-score).
- Cash flow +24.8/30.0
- ARV discount +10.4/15.0
- DSCR +8.0/10.0
- 1% rule +6.4/10.0
- Schools +4.0/10.0
- Livability +2.9/5.0
- Rent growth +2.5/5.0
- Condition / age +2.5/5.0
- Appreciation +0.0/10.0
$89,900
🖨 Deal sheet (PDF) 📄 Offer letter ✓ Due diligence
Listing remarks MLS
Discover this great 2 bed, 2 bath home situated on a spacious 0.43± acre level lot in the heart of Piedmont. The inviting front porch offers both an open area to relax and a partially enclosed section for added versatility. Exterior features include a rear attached carport, an additional detached carport, a concrete driveway, and a storage building—providing plenty of room for parking and outdoor organization. The yard is partially fenced, ideal for pets or gardening. Inside, the home offers a comfortable layout with a living room, dining room, kitchen, and laundry room. The kitchen features beautiful wooden cabinets that extend all the way to the ceiling, offering generous storage and timeless charm! Conveniently located just 2 blocks from the Chief Ladiga Trail and 3–4 blocks from Piedmont Elementary and Middle Schools, this home offers excellent access to local amenities, recreation, and award-winning schools. This one is full of potential-come see all this property has to offer!
Key facts
- Detached carport
- Inviting front porch
- Storage building
Tags
Neighborhood map
What this means for you Summary
Snapshot
- This is a 2-bed/1.0-bath single-family listed at $90k.
Deal economics
- At list price, monthly cash flow is $191 ($2k/yr) — positive.
- The deal already cash-flows at list — no discount required.
- Meets the 1% rule at list price ($1k rent vs $90k).
- Recommended offer: $79k (12.0% below list) — sets the bar for market timing.
- Cap rate 8.8% vs local median 4.5% in Piedmont — top-decile yield for the area; either an underpriced asset or a hidden risk that comps aren't pricing in. Stress-test before assuming the spread holds.
Location & tenants
- Location reads 57/100 on livability (#402 in AL) — a working-class tenant base; expect higher turnover. Strengths: cost of living A+, housing A+; Watch: schools C-, crime F, amenities F.
- Piedmont City (town): math 40% / reading 57% proficiency, ranked #14 of 129 in AL (top 11%) — families likely to look elsewhere, expect single-tenant / working-renter base with shorter leases.
- Market conditions: 88 active listings in the ZIP; 135 units permitted in Calhoun County in 2024 (0 in 5+ unit buildings).
Forward outlook
- Local home prices are declining (-3.0%/yr); year-one equity from $622 of loan paydown is wiped out by about $3k of value loss. Plan a longer hold.
- Calhoun County population projected at -21% by 2050 — secular population decline; favor cash flow + early exit over multi-decade hold.
Negotiation context
- It's been on market 170 days — a 12% lower offer ($79k) is reasonable based on typical stale-listing flexibility.
Risks & watch-outs
- Watch-outs: built in 1936 — expect roof / HVAC / electrical / plumbing capex.
- Climate carrying-cost: moderate wildfire risk; extreme-heat days projected 7→20/yr by 2055 (HVAC capex compounding) — expect insurance premiums to compound above CPI over the hold.
Questions for the listing agent
- It's been on market 170 days. Have you received any prior offers? Is the seller open to a 12% concession, seller financing, or rate buy-down credit?
- Built in 1936 — when were the roof, HVAC, electrical panel, plumbing, and water heater last replaced?
- Why hasn't it sold? Are there any deal-killer items the seller is aware of (foundation, flood, title, zoning, code violations)?
- Is there a deadline driving the sale (1031 exchange, divorce, estate, relocation)? That informs how much negotiation room exists.
- Crime grade is F in this area — have there been break-ins, vandalism, or insurance claims at this property in the last 3 years? What carrier currently insures it and at what premium?
- What's the average days-on-market for RENTAL listings here right now (not sales)? A rising rental-DOM trend means longer vacancies and softer asking-rent achievability than the comps imply.
- What's the recent tenant-quality profile in this submarket — average credit score on applications, eviction rate, late-payment / NSF rate, and stable-employment percentage? A property-management company in the area should have these aggregated.
- How much new for-sale + rental construction is in the pipeline within 1–3 miles? Heavy new supply typically softens prices + rents 12–24 months out; constrained supply supports both.
Investment metrics
- 1% rule
- 1.14% ✓
- Cap rate
- 8.84%
- Cash-on-cash
- 9.08%
- DSCR
- 1.40
- GRM
- 7.3
CMA / ARV
- ARV (median comp)
- $96,198
- List price
- $89,900
- Delta
- -6.55%
- Verdict
- FAIR
- Comps
- 20 within 1.0 mi
Show comp detail 12 sales within ~0.75 mi
| Address | Dist | Beds/Ba | Sqft | Sold | Price | $/sf | Match |
|---|---|---|---|---|---|---|---|
| 508 Main St N | 0.26mi | 2/1.0 | 1,149 (-4%) | 18mo | $153,500 | $134 | 65 |
| 310 N 5th Ave | 0.41mi | 3/2.0 (+1) | 1,190 (-1%) | 9mo | $155,000 | $130 | 63 |
| 306 Dailey St | 0.38mi | 2/1.0 | 1,248 (+4%) | 19mo | $85,000 | $68 | 60 |
| 121 Taylor St | 0.39mi | 2/1.0 | 1,024 (-15%) | 1mo | $108,500 | $106 | 57 |
| 127 Taylor St | 0.41mi | 2/2.0 | 1,280 (+7%) | 12mo | $106,900 | $84 | 55 |
| 602 E Ladiga St | 0.56mi | 2/1.0 | 1,088 (-9%) | 5mo | $40,000 | $37 | 54 |
| 418 Riddle Ave | 0.66mi | 3/1.0 (+1) | 1,276 (+6%) | 6mo | $144,900 | $114 | 49 |
| 407 S Main St | 0.64mi | 3/1.0 (+1) | 1,332 (+11%) | 7mo | $168,000 | $126 | 41 |
| 302 Woolf Ave | 0.68mi | 3/1.0 (+1) | 1,344 (+12%) | 2mo | $150,000 | $112 | 41 |
| 313 Gadsden St | 0.52mi | 3/2.0 (+1) | 1,361 (+13%) | 5mo | $145,900 | $107 | 40 |
| 502 Hughes St | 0.51mi | 3/2.0 (+1) | 1,280 (+7%) | 20mo | $135,000 | $105 | 39 |
| 117 Foskett St | 0.64mi | 3/2.0 (+1) | 1,376 (+15%) | 21mo | $128,000 | $93 | 20 |
Match score weights: distance 35% · size 25% · config 20% · recency 20%. Top-matched comps best support the ARV.
Projected returns pro-forma
-3.0% appreciation · 3.0% rent growth · sell at horizon
- IRR
- -2.5%
- Equity multiple
- 0.90×
- Total profit
- $-2,417
- Equity at exit
- $13,404
- IRR
- 7.2%
- Equity multiple
- 1.54×
- Total profit
- $13,584
- Equity at exit
- $7,773
Cash invested: $25,172 (down + closing). Projections, not guarantees.
Landlord ↔ Tenant lean methodology
- Overall (STATE)
- 90 Strongly Landlord-Friendly
- State Alabama
- 90 Strongly Landlord-Friendly · R+15
- County
- — inherits STATE
- City
- — inherits STATE
ZIP-level market 36272
- Home prices YoY
- -10.2%
- Active inventory
- 88
- Price-to-rent
- 7.3×
Monthly cashflow live
- Estimated rent
- $1,028 medium interval (Pro) →
- Mortgage (P&I)
- −$471
- Tax est. 1.5%
- −$112 /mo · $1,348/yr
- Insurance
- −$37
- HOA
- −$0
- Vacancy / Maint / Mgmt
- −$216
- Net cashflow
- $191
Break-even live
Sensitivity live
| Price | -10% $253 | -5% $222 | +0% $191 | +5% $159 | +10% $128 |
|---|---|---|---|---|---|
| Rent | -10% $109 | -5% $150 | +0% $191 | +5% $231 | +10% $272 |
| Rate | -1.0pp $236 | -0.5pp $213 | base $191 | +0.5pp $167 | +1.0pp $144 |
UW: 25.0% down · 7.5% · 30yr · 1.5% tax · 5.0% vac · 8.0% maint · 8.0% mgmt
Financing live
Cash to close
- Down payment
- $22,475
- Closing costs
- $2,697
- Reserves months
- —
- Total cash needed
- —
Loan-product check · same deal, 3 products live
Conventional
25% down · 7.5% · 30yr
- Down + closing
- —
- Monthly P&I
- —
- Monthly cashflow
- —
- DSCR
- —
- Eligible?
- —
Personal DTI + credit; lowest rate.
DSCR
20% down · 8.5% · 30yr
- Down + closing
- —
- Monthly P&I
- —
- Monthly cashflow
- —
- DSCR
- —
- Eligible?
- —
No personal income docs; deal must DSCR.
Hard money
10% down · 12.0% · 12mo
- Down + closing
- —
- Monthly P&I
- —
- Monthly cashflow
- —
- DSCR
- —
- Eligible?
- —
Short-term bridge; refi at stabilization.
Listing history 3 events
-
2025-12-06$89,900 Active 1016-char remark
Show marketing remark (1016 chars)
Discover this great 2 bed, 2 bath home situated on a spacious 0.43± acre level lot in the heart of Piedmont. The inviting front porch offers both an open area to relax and a partially enclosed section for added versatility. Exterior features include a rear attached carport, an additional detached carport, a concrete driveway, and a storage building—providing plenty of room for parking and outdoor organization. The yard is partially fenced, ideal for pets or gardening. Inside, the home offers a comfortable layout with a living room, dining room, kitchen, and laundry room. The kitchen features beautiful wooden cabinets that extend all the way to the ceiling, offering generous storage and timeless charm! Conveniently located just 2 blocks from the Chief Ladiga Trail and 3–4 blocks from Piedmont Elementary and Middle Schools, this home offers excellent access to local amenities, recreation, and award-winning schools. This one is full of potential-come see all this property has to offer!
-
2025-04-11price $109,500
-
2025-03-13price $109,900
ⓘ Source: listings_history table (triggers on properties + properties_extension) + one-shot
backfill from property_details.listing_events for pre-trigger history.
Climate risk First Street
- Flood 1/10 Low FEMA zone X (unshaded) · 0% chance over 30 yrs
- Wildfire 5/10 Major
- Heat 6/10 Major 7 d/yr ≥104°F today · 20 d/yr by 30 yrs out
- Wind 4/10 Moderate 22% chance of damaging wind over 30 yrs
- Air quality 2/10 Low 1 unhealthy d/yr today · 2 by 30 yrs out
Nearby sold comps map
Loading sold comps map…
Walkable amenities ~0.75 mi
Loading nearby amenities…
Taxation est. · year 1
- Rental income
- $12,331
- − Mortgage interest
- −$5,036
- − Property taxes
- −$1,348
- − Insurance
- −$450
- − Repairs & maintenance
- −$987
- − Management
- −$987
- − Depreciation
- −$2,615
- Taxable income
- $909
- Est. tax owed @ 24.0%
- −$218
- After-tax cash flow
- $2,068/yr
For passive investors: Depreciation is non-cash, so a rental often shows a tax loss while cash-flowing — sheltering income. Rental losses are passive: they offset passive income freely, and up to $25,000/yr can offset ordinary (W-2) income if you actively participate and your MAGI is under $100k (phasing out to $0 by $150k); unused losses carry forward. On sale, claimed depreciation is recaptured at up to 25%, and gains may owe capital-gains tax (a 1031 exchange can defer both). Figures are a year-1 estimate at your 24.0% rate — not tax advice; consult a CPA.
Schools (NCES district)
- District
- Piedmont City
- NCES district ID
- 0102760
- Math proficiency
- 40% ▼ -14.00%
- Reading proficiency
- 57% ▲ 6.00%
- Median HH income
- $32,302
- Composite
- 39.78/100
- National rank
- #3881
- State rank
- #14 of 129 in AL
Livability — Piedmont
- Score
- 57/100
- State rank
- #402
- US rank
- #22342
Category grades
Schools grade is shown separately in the Schools card above.
Census & demographics
- Census place
- Piedmont, AL
- City population
- 12,996
- Population (ZIP)
- 12,996
Population outlook (Calhoun County) Hauer SSP2
- Today (2025)
- 109,765 people
- By 2030
- 105,708 · -3.7%
- By 2040
- 96,192 · -12.4%
- By 2050
- 86,413 · -21.3%
- By 2075
- 63,467 · -42.2%
- By 2100
- 44,704 · -59.3%
Race, ethnicity, and origin ACS 2023
- Neighborhood character
- Predominantly White (90%)
- Race & ethnicity
- White 90% Black 5% Two or more races 3% Hispanic / Latino 2%
- Common ancestry
- Russian 2% Serbian 1% Lithuanian 1%
- Foreign-born
- 2% · Canada
- Languages at home
- 96% English-only · Spanish 4%
Political lean MEDSL · Calhoun
- 2024 margin
- Solid R (+44.8) · D 27.2% · R 71.9%
- 2008→2024 swing
- -12.2pp toward R · 2008: -32.5pp · 2024: -44.8pp
- All cycles
- 2024: R+44.8 2020: R+39.0 2016: R+41.4 2012: R+31.9 2008: R+32.5
Not yet ingested
- Civics
- —
Market trends
- HPI YoY
- ▼ -21.87%
- Current HPI
- 192.177
- Rent YoY
- —
- Metro
- —
- State GDP YoY
- ▲ 2.94%
- F500 in state
- 4
Industry mix (Fortune 500 HQ in AL)
| Industry | F500 HQs | Revenue |
|---|---|---|
| Financial Services | 1 | $8B |
|
||
| Healthcare | 1 | $5B |
|
||
Price history
-18.2% since first listed3 events — show timeline
- 2025-12-06 Listed $89,900 Greater Alabama MLS
- 2025-04-11 Price Changed $109,500 VMLS
- 2025-03-13 Price Changed $109,900 VMLS
Property tax history
+3.5%/yrLatest (2019): $136 · +0.0% YoY. Source: county tax records.
Cash-flow waterfall
monthlySold comps — $/sqft
last 12 mo · ≤1 miLoading sold comps…