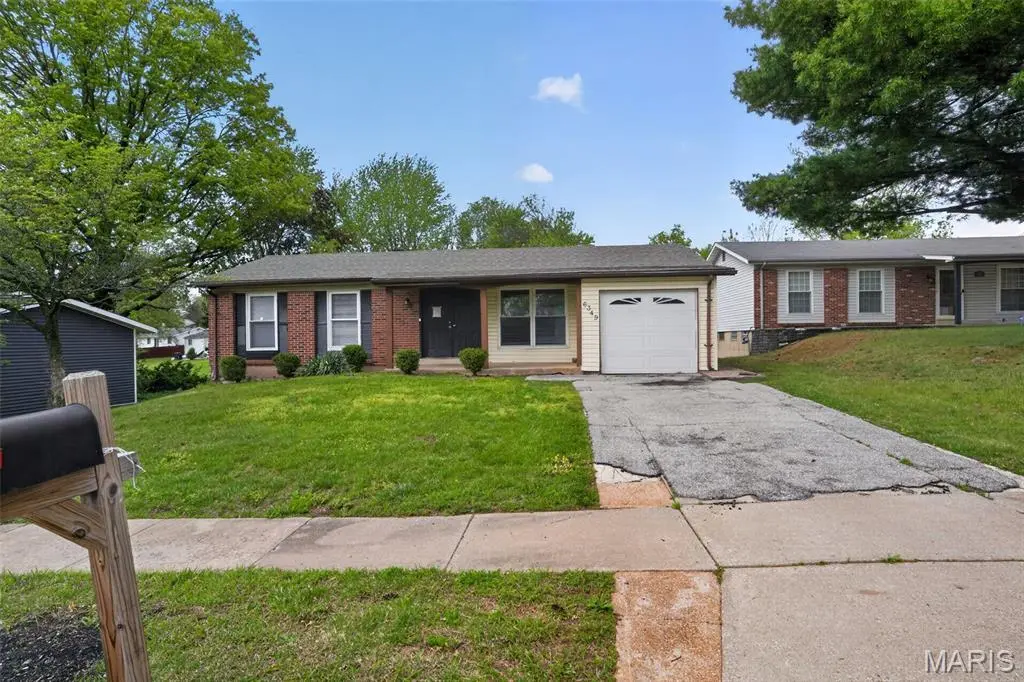
6349 Honey Bee Ct · Black Jack, MO
Flood risk 1/10 · Minimal
- FEMA flood zone
- X (unshaded)
- Chance of flooding over 30 yrs
- 0.0%
- Est. flood insurance / yr
- $473 – $860
Fire risk 1/10 · Minimal
- Est. fire insurance / yr
- $1,054 – $1,958
Heat risk 5/10 · Moderate
- Hot days now (above 106°F)
- 7 days/yr
- Hot days in 30 yrs
- 21 days/yr
Wind risk 2/10 · Minimal
- Chance of severe wind over 30 yrs
- 1.0%
Air-quality risk 4/10 · Minor
- Unhealthy air days now
- 4 days/yr
- Unhealthy air days in 30 yrs
- 5 days/yr
Risk factors via First Street. Map © Google.
Why this score? — see what drove the B grade
The composite is a weighted blend of 9 inputs, each scored 0–100. Each bar is that input's sub-score; the figure is the points it added to the 100-point composite (weight × sub-score).
- Cash flow +23.7/30.0
- ARV discount +13.4/15.0
- Appreciation +10.0/10.0
- DSCR +7.6/10.0
- 1% rule +7.1/10.0
- Rent growth +4.4/5.0
- Livability +3.5/5.0
- Condition / age +2.5/5.0
- Schools +1.7/10.0
$149,900
🖨 Deal sheet 📄 Offer letter ✓ Due diligence
Listing remarks MLS
Welcome to this charming home 3 bedroom, 2 full bath located on a quiet cul-de-sac in Florissant! This property offers a functional layout with comfortable living space and a spacious yard, perfect for everyday living or entertaining. Conveniently situated near shopping, dining, schools, and major highways, providing easy access throughout St. Louis County. Ideal for first-time buyers or investors looking for a great opportunity. Don’t miss this one!
Key facts
- 7,623 sq ft lot
- Garage
- Built 1972
Neighborhood map
What this means for you Summary
Snapshot
- This is a 3-bed/2.0-bath single-family listed at $150k.
Deal economics
- At list price, monthly cash flow is $286 ($3k/yr) — positive.
- The deal already cash-flows at list — no discount required.
- Meets the 1% rule at list price ($2k rent vs $150k).
- Recommended offer: $145k (3.0% below list) — sets the bar for market timing.
- Cap rate 8.6% vs local median 6.2% in Black Jack — top-decile yield for the area; either an underpriced asset or a hidden risk that comps aren't pricing in. Stress-test before assuming the spread holds.
Location & tenants
- Location reads 70/100 on livability (#132 in MO) — a middle-class / working-renter tenant base. Strengths: cost of living A+, housing A+; Watch: health & safety C-, crime D+, amenities F.
- Hazelwood (suburban): math 11% / reading 26% proficiency, ranked #306 of 324 in MO (top 94%) — low school quality limits family demand, transient renter base, plan for 1-2y turnover.
- Market conditions: Rents rising fast (+7.5%/yr); 218 active listings in the ZIP; 9 comparable units currently listed for rent nearby; rentals leasing fast (median 2d on market — plan ~1-2 weeks tenant-placement turnaround); 920 units permitted in St. Louis County in 2024 (250 in 5+ unit buildings).
- This rent runs 33% of the median local income ($67k/yr) — at the standard rent-burdened threshold; future hikes will face affordability resistance.
Forward outlook
- In year one you build about $16k of equity ($1k loan paydown + $15k appreciation (10.0% local appreciation)).
- At projected returns (10.0% appreciation + 7.5% rent growth), your $42k cash investment doubles in ~3 years — after that, you're playing with house money.
- By year 3, paydown + projected appreciation supports a ~$41k cash-out refi (75% LTV) — recoverable capital for the next deal without selling this one.
Negotiation context
- It's been on market 53 days — a 3% lower offer ($145k) is reasonable based on typical stale-listing flexibility.
Risks & watch-outs
- Climate carrying-cost: extreme-heat days projected 7→21/yr by 2055 (HVAC capex compounding) — expect insurance premiums to compound above CPI over the hold.
Questions for the listing agent
- It's been on market 53 days. Have you received any prior offers? Is the seller open to a 3% concession, seller financing, or rate buy-down credit?
- Built in 1972 — when were the roof, HVAC, electrical panel, plumbing, and water heater last replaced?
- What does the HOA fee cover, when was the last increase, and are there any pending special assessments or reserve-fund shortfalls?
- Is there a deadline driving the sale (1031 exchange, divorce, estate, relocation)? That informs how much negotiation room exists.
- Crime grade is D in this area — have there been break-ins, vandalism, or insurance claims at this property in the last 3 years? What carrier currently insures it and at what premium?
- What's the average days-on-market for RENTAL listings here right now (not sales)? A rising rental-DOM trend means longer vacancies and softer asking-rent achievability than the comps imply.
- What's the recent tenant-quality profile in this submarket — average credit score on applications, eviction rate, late-payment / NSF rate, and stable-employment percentage? A property-management company in the area should have these aggregated.
- How much new for-sale + rental construction is in the pipeline within 1–3 miles? Heavy new supply typically softens prices + rents 12–24 months out; constrained supply supports both.
Investment metrics
- 1% rule
- 1.21% ✓
- Cap rate
- 8.58%
- Cash-on-cash
- 8.18%
- DSCR
- 1.36
- GRM
- 6.9
CMA / ARV
- ARV (median comp)
- $172,564
- List price
- $149,900
- Delta
- -13.13%
- Verdict
- UNDERPRICED
- Comps
- 20 within 1.0 mi
Show comp detail 12 sales within ~0.75 mi
| Address | Dist | Beds/Ba | Sqft | Sold | Price | $/sf | Match |
|---|---|---|---|---|---|---|---|
| 12166 La Padera Ln | 0.08mi | 3/2.0 | 1,136 (+2%) | 2mo | $200,000 | $176 | 92 |
| 12113 La Padera Ln | 0.07mi | 3/2.0 | 1,144 (+2%) | 4mo | $149,000 | $130 | 90 |
| 12095 El Camara Dr | 0.17mi | 3/2.0 | 1,088 (-3%) | 0mo | $154,900 | $142 | 88 |
| 6250 Pennyrich Ct | 0.03mi | 3/2.0 | 1,186 (+6%) | 2mo | $149,000 | $126 | 87 |
| 12178 El Camara Dr | 0.16mi | 3/2.0 | 1,144 (+2%) | 4mo | $204,900 | $179 | 85 |
| 12136 La Padera Ln | 0.05mi | 3/2.0 | 1,060 (-5%) | 4mo | $165,000 | $156 | 85 |
| 11955 Red Barn Ct | 0.32mi | 3/2.0 | 1,120 (+0%) | 5mo | $169,900 | $152 | 81 |
| 6530 Farm Pond Ct | 0.37mi | 3/2.0 | 1,060 (-5%) | 2mo | $219,900 | $207 | 72 |
| 30 Tarpon Ct | 0.58mi | 2/2.0 (-1) | 1,096 (-2%) | 2mo | $124,900 | $114 | 63 |
| 12045 Victorian Village Ct | 0.74mi | 3/2.0 | 1,096 (-2%) | 3mo | $104,900 | $96 | 60 |
| 11623 Arroyo Dr | 0.58mi | 3/1.5 | 1,042 (-7%) | 1mo | $174,900 | $168 | 59 |
| 6842 Champana Dr | 0.52mi | 3/1.0 | 1,044 (-7%) | 8mo | $149,900 | $144 | 54 |
Match score weights: distance 35% · size 25% · config 20% · recency 20%. Top-matched comps best support the ARV.
Projected returns pro-forma
10.0% appreciation · 7.51% rent growth · sell at horizon
- IRR
- 32.4%
- Equity multiple
- 3.59×
- Total profit
- $108,533
- Equity at exit
- $135,042
- IRR
- 29.6%
- Equity multiple
- 8.78×
- Total profit
- $326,348
- Equity at exit
- $291,223
Cash invested: $41,972 (down + closing). Projections, not guarantees.
Landlord ↔ Tenant lean methodology
- Overall (STATE)
- 81 Strongly Landlord-Friendly
- State Missouri
- 81 Strongly Landlord-Friendly · R+10
- County
- — inherits STATE
- City
- — inherits STATE
ZIP-level market 63033
- Home prices YoY
- 2.5%
- Rents YoY
- 7.5%
- Active inventory
- 218
- Price-to-rent
- 6.9×
Monthly cashflow live
- Estimated rent
- $1,810 high interval (Pro) →
- Mortgage (P&I)
- −$786
- Tax from tax record
- −$170 /mo · $2,045/yr
- Insurance
- −$62
- HOA
- −$125
- Vacancy / Maint / Mgmt
- −$380
- Net cashflow
- $286
Break-even live
UW: 25.0% down · 7.5% · 30yr · 1.5% tax · 5.0% vac · 8.0% maint · 8.0% mgmt
Financing live
Cash to close
- Down payment
- $37,475
- Closing costs
- $4,497
- Reserves months
- —
- Total cash needed
- —
Loan-product check · same deal, 3 products live
Conventional
25% down · 7.5% · 30yr
- Down + closing
- —
- Monthly P&I
- —
- Monthly cashflow
- —
- DSCR
- —
- Eligible?
- —
Personal DTI + credit; lowest rate.
DSCR
20% down · 8.5% · 30yr
- Down + closing
- —
- Monthly P&I
- —
- Monthly cashflow
- —
- DSCR
- —
- Eligible?
- —
No personal income docs; deal must DSCR.
Hard money
10% down · 12.0% · 12mo
- Down + closing
- —
- Monthly P&I
- —
- Monthly cashflow
- —
- DSCR
- —
- Eligible?
- —
Short-term bridge; refi at stabilization.
Rent comps 9 comps
| Address | Beds | Baths | Sqft | Rent | $/sqft | DOM | Units | Dist |
|---|---|---|---|---|---|---|---|---|
| 11592 Las Ladera Dr Florissant, MO | 3.0 | 2.0 | 986 | $1,616 | $1.64 | 7d | 1 | 0.67mi |
| 11969 Continental Dr St. Louis, MO | 2.0–3.0 | 1.5 | 1075 | $1,325 | $1.23 | 1d | 3 | 0.87mi |
| 1911 Redman Rd Saint Louis, MO | 3.0 | 1.0 | 1454 | $1,495 | $1.03 | 2d | 1 | 1.00mi |
| 12810 Verwood Dr Florissant, MO | 3.0 | 2.0 | 1408 | $2,026 | $1.44 | 43d | 1 | 1.03mi |
| 11321 Amboy Ln Saint Louis, MO | 3.0 | 3.0 | 1182 | $1,756 | $1.49 | 1d | 1 | 1.16mi |
| 12887 Fox Haven Dr Florissant, MO | 3.0 | 2.0 | 1135 | $1,750 | $1.54 | 43d | 1 | 1.26mi |
| 1708 San Remo Ct St. Louis, MO | 1.0–3.0 | 1.0–1.5 | 1053 | $1,300 | $1.23 | 1d | 9 | 1.39mi |
| 6431 Brown Fox Dr Florissant, MO | 3.0 | 2.0 | 1105 | $1,905 | $1.72 | 22d | 1 | 1.45mi |
| 4872 Bristol Rock Rd Black Jack, MO | 4.0 | 2.0 | 1448 | $2,061 | $1.42 | 2d | 1 | 1.50mi |
HOA detail
- Monthly dues
- $125 · $1,500/yr
Listing history 18 events
-
2026-06-10status $149,900 Pending 53 DOM
-
2026-06-09days on market $149,900 Active 53 DOM
-
2026-06-08days on market $149,900 Active 52 DOM
-
2026-06-07days on market $149,900 Active 51 DOM
-
2026-06-05days on market $149,900 Active 48 DOM
-
2026-06-03days on market $149,900 Active 47 DOM
-
2026-06-02days on market $149,900 Active 46 DOM
-
2026-06-01days on market $149,900 Active 45 DOM
-
2026-05-31days on market $149,900 Active 44 DOM
-
2026-05-15price $149,900 460-char remark
Show marketing remark (460 chars)
Welcome to this charming home 3 bedroom, 2 full bath located on a quiet cul-de-sac in Florissant! This property offers a functional layout with comfortable living space and a spacious yard, perfect for everyday living or entertaining. Conveniently situated near shopping, dining, schools, and major highways, providing easy access throughout St. Louis County. Ideal for first-time buyers or investors looking for a great opportunity. Don’t miss this one!
-
2026-04-17$154,900 Active 460-char remark
Show marketing remark (460 chars)
Welcome to this charming home 3 bedroom, 2 full bath located on a quiet cul-de-sac in Florissant! This property offers a functional layout with comfortable living space and a spacious yard, perfect for everyday living or entertaining. Conveniently situated near shopping, dining, schools, and major highways, providing easy access throughout St. Louis County. Ideal for first-time buyers or investors looking for a great opportunity. Don’t miss this one!
-
2021-05-21soldstatus $6,455,503
-
2015-06-26soldstatus $350,000
-
2008-01-29soldstatus
-
1995-10-24soldstatus $68,000
-
1990-10-01soldstatus $77,400
-
1990-10-01soldstatus
-
1989-09-01soldstatus $76,500
ⓘ Source: listings_history table (triggers on properties + properties_extension) + one-shot
backfill from property_details.listing_events for pre-trigger history.
Tax reassessment forecast MO · Resets to sale price
- Current annual tax
- $2,045 · $170/mo
- Projected year-2 tax
- $2,045 · $170/mo
- Expected delta
- $0/yr ($0/mo · 0.0%)
ⓘ Screening estimate from a state-policy table — verify with the county assessor before closing.
Climate risk First Street
- Flood 1/10 Low FEMA zone X (unshaded) · 0% chance over 30 yrs
- Wildfire 1/10 Low
- Heat 5/10 Major 7 d/yr ≥106°F today · 21 d/yr by 30 yrs out
- Wind 2/10 Low 100% chance of damaging wind over 30 yrs
- Air quality 4/10 Moderate 4 unhealthy d/yr today · 5 by 30 yrs out
Nearby sold comps map
Loading sold comps map…
Walkable amenities ~0.75 mi
Loading nearby amenities…
Taxation est. · year 1
- Rental income
- $21,721
- − Mortgage interest
- −$8,397
- − Property taxes
- −$2,045
- − Insurance
- −$750
- − Repairs & maintenance
- −$1,738
- − Management
- −$1,738
- − HOA
- −$1,500
- − Depreciation
- −$4,361
- Taxable income
- $1,193
- Est. tax owed @ 24.0%
- −$286
- After-tax cash flow
- $3,145/yr
For passive investors: Depreciation is non-cash, so a rental often shows a tax loss while cash-flowing — sheltering income. Rental losses are passive: they offset passive income freely, and up to $25,000/yr can offset ordinary (W-2) income if you actively participate and your MAGI is under $100k (phasing out to $0 by $150k); unused losses carry forward. On sale, claimed depreciation is recaptured at up to 25%, and gains may owe capital-gains tax (a 1031 exchange can defer both). Figures are a year-1 estimate at your 24.0% rate — not tax advice; consult a CPA.
Schools (NCES district)
- District
- Hazelwood
- NCES district ID
- 2913830
- Math proficiency
- 11% ▼ -13.00%
- Reading proficiency
- 26% ▼ -6.00%
- Median HH income
- $51,621
- Composite
- 16.77/100
- National rank
- #9156
- State rank
- #306 of 324 in MO
Livability — Black Jack
- Score
- 70/100
- State rank
- #132
- US rank
- #7706
Category grades
Schools grade is shown separately in the Schools card above.
Census & demographics
- County
- Saint Louis County · 888,823 people
- City population
- 42,258
- Metro
- St. Louis, MO-IL
- Population (ZIP)
- 43,056
- Household income
- $66,776
- Rent vs Own
- Severe rent burden
- 1429.0
Population outlook (St. Louis County) Hauer SSP2
- Today (2025)
- 1,025,227 people
- By 2030
- 1,028,023 · +0.3%
- By 2040
- 1,020,940 · -0.4%
- By 2050
- 1,007,280 · -1.8%
- By 2075
- 987,277 · -3.7%
- By 2100
- 921,984 · -10.1%
Race, ethnicity, and origin ACS 2023
- Neighborhood character
- Predominantly Black (71%)
- Race & ethnicity
- Black 71% White 23% Two or more races 4% Hispanic / Latino 1%
- Common ancestry
- Romanian 1% Lithuanian 1% Italian 1%
- Foreign-born
- 3% · Canada, Vietnam
- Languages at home
- 95% English-only · Spanish 1% French/Haitian/Cajun 1%
Political lean MEDSL · St. Louis
- 2024 margin
- Strong D (+23.4) · D 60.8% · R 37.4% · Other 1.7%
- 2008→2024 swing
- +3.5pp toward D · 2008: 19.9pp · 2024: 23.4pp
- All cycles
- 2024: D+23.4 2020: D+24.0 2016: D+16.2 2012: D+13.7 2008: D+19.9
Not yet ingested
- Civics
- —
Market trends
- HPI YoY
- ▲ 13.78%
- Current HPI
- 570.6
- Rent YoY
- ▲ 7.51%
- Metro
- St. Louis, MO-IL
- State GDP YoY
- ▲ 1.84%
- F500 in state
- 20
Industry mix (Fortune 500 HQ in MO)
| Industry | F500 HQs | Revenue |
|---|---|---|
| Healthcare | 1 | $163B |
|
||
| Insurance | 1 | $21B |
|
||
| Industrial Technology | 1 | $17B |
|
||
| Retail | 1 | $16B |
|
||
| Industrial Distribution | 1 | $10B |
|
||
| Utilities | 1 | $9B |
|
||
Price history
+95.9% since first listed9 events — show timeline
- 2026-05-15 Price Changed $149,900 MARIS as Distributed by MLS Grid
- 2026-04-17 Listed $154,900 MARIS as Distributed by MLS Grid
- 2021-05-21 Sold (Public Records) $6,455,503 Public Records
- 2015-06-26 Sold (Public Records) $350,000 Public Records
- 2008-01-29 Sold (Public Records) — Public Records
- 1995-10-24 Sold (Public Records) $68,000 Public Records
- 1990-10-01 Sold (Public Records) — Public Records
- 1990-10-01 Sold (Public Records) $77,400 Public Records
- 1989-09-01 Sold (Public Records) $76,500 Public Records
Property tax history
+0.7%/yrLatest (2022): $2,045 · +5.7% YoY. Source: county tax records.
Cash-flow waterfall
monthlySold comps — $/sqft
last 12 mo · ≤1 miLoading sold comps…