1516 N Dixie Hwy Unit 1-2 · Fort Lauderdale, FL
Flood risk 4/10 · Minor
- FEMA flood zone
- AH
- Chance of flooding over 30 yrs
- 0.22%
- Est. flood insurance / yr
- $1,142 – $2,507
Fire risk 1/10 · Minimal
- Est. fire insurance / yr
- $947 – $1,759
Heat risk 10/10 · Severe
- Hot days now (above 105°F)
- 7 days/yr
- Hot days in 30 yrs
- 27 days/yr
Wind risk 10/10 · Severe
- Chance of severe wind over 30 yrs
- 99.0%
Air-quality risk 2/10 · Minimal
- Unhealthy air days now
- 1 days/yr
- Unhealthy air days in 30 yrs
- 1 days/yr
Risk factors via First Street. Map © Google.
Why this score? — see what drove the F grade
The composite is a weighted blend of 9 inputs, each scored 0–100. Each bar is that input's sub-score; the figure is the points it added to the 100-point composite (weight × sub-score).
- ARV discount +7.5/15.0
- Cash flow +4.4/30.0
- Schools +4.1/10.0
- Livability +4.1/5.0
- Condition / age +4.0/5.0
- Rent growth +3.2/5.0
- 1% rule +0.4/10.0
- DSCR +0.0/10.0
- Appreciation +0.0/10.0
$650,000
🖨 Deal sheet (PDF) 📄 Offer letter ✓ Due diligence
Listing remarks
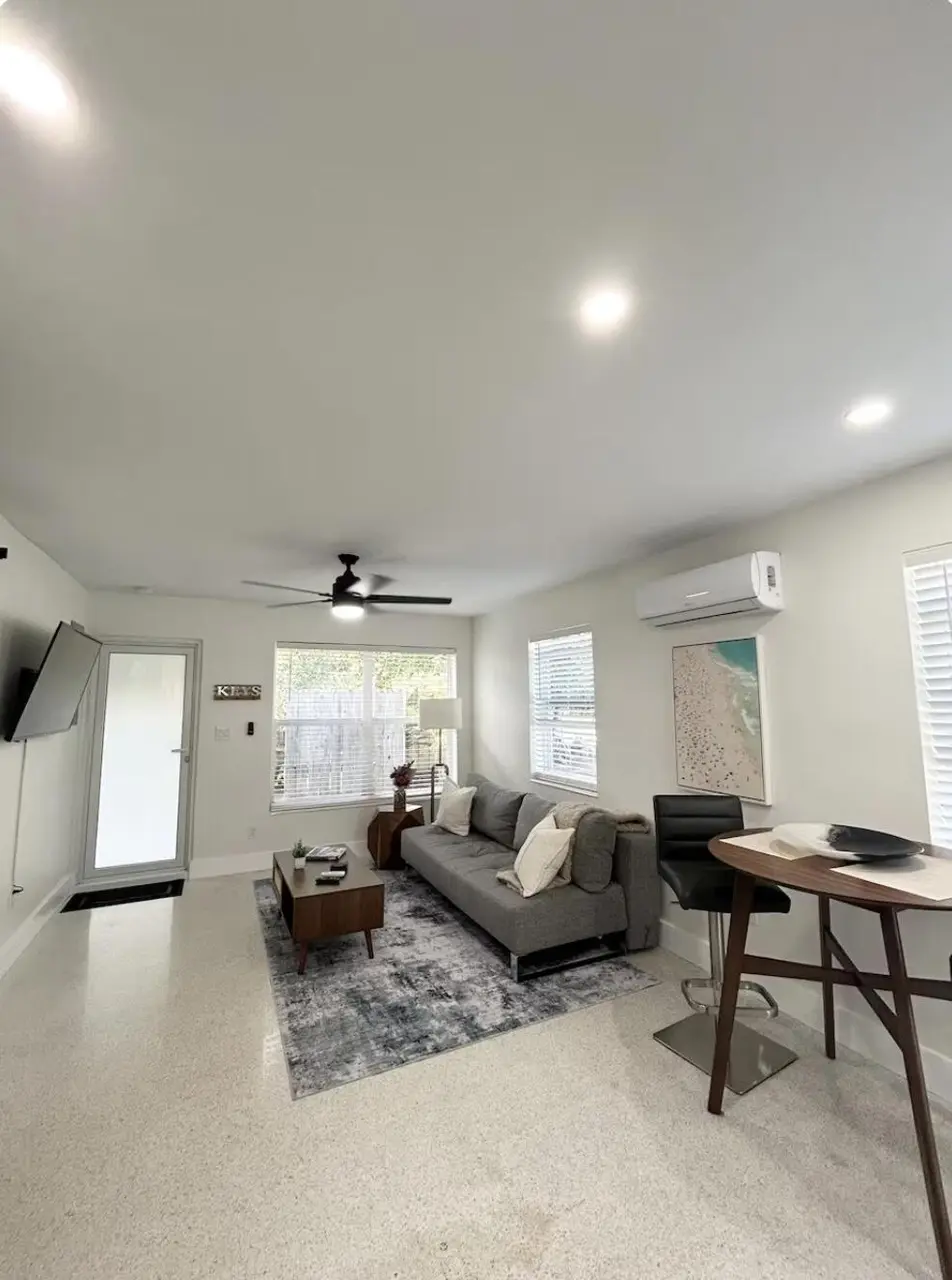
Updated property in Middle River Terrace with a flexible income-producing layout. Current configuration consists of a 1BR/1BA unit, studio unit, 2BR/2BA unit, and additional studio space. Buyer to verify current use, zoning, and future permitted configuration with the City of Fort Lauderdale, as the city has indicated the property may need to be returned to a duplex configuration. Flexible layout offers a variety of potential living, workspace, or rental arrangements. Property is vacant and ready for immediate occupancy or repositioning. Recent updates include permitted electrical upgrades with new service line and panels, removal of cloth wiring, new outlets and switches, new mini-split A/
Key facts
- 6,433 sq ft lot
- Built 1959
- Listed 86 days
Property features AI
Finance
- Financial info: Two total units; Two units in the community; Pets allowed with no restrictions
Exterior
- Utilities: Public water; Public sewer; Electricity connected (circuit breakers); Cable connected; Sewer connected; Water connected; Four separate electric meters
- Home design: Duplex; One story; Resale property
- Construction: CBS construction; Spanish tile roof; Building area approximately 1,944 (public records); Total stories: 1
- Exterior features: Open patio; Patio; Fencing: Other; Not waterfront
Interior
- Flooring: Terrazzo
- Heating & cooling: Heating present (type: Other); Cooling present: Ceiling fans, Electric, Wall/Window units, Other
- Interior features: Terrazzo flooring; Storm windows
Neighborhood map
What this means for you Summary
Snapshot
- This is a condo listed at $650k. Condition is rated good.
Deal economics
- At list price, monthly cash flow is $-2k ($-22k/yr) — negative.
- To cash-flow at today's rent, offer at most $382k (41.3% below list).
- To meet the 1% rule (rent ≥ 1% of price), the offer needs to be $353k (45.7% below list).
- Recommended offer: $353k (45.7% below list) — sets the bar for 1% rule.
- Cap rate 3.2% vs local median 2.2% in Fort Lauderdale — top-decile yield for the area; either an underpriced asset or a hidden risk that comps aren't pricing in. Stress-test before assuming the spread holds.
Location & tenants
- Location reads 82/100 on livability (#78 in FL, #1,293 nationally) — a professional / high-income tenant draw. Strengths: crime A+, amenities A+, health & safety A+; Watch: cost of living D-.
- Broward (suburban): math 42% / reading 53% proficiency, ranked #46 of 73 in FL (top 63%) — families likely to look elsewhere, expect single-tenant / working-renter base with shorter leases.
- Zoned schools: North Side Elementary School (math 32% / reading 32%, grade F, #1,797 of 2,144 statewide, top 86%, 329 students, 87% FRL); Sunrise Middle School (math 50% / reading 52%, grade C, #237 of 571 statewide, top 43%, 1,242 students, 64% FRL); Fort Lauderdale High School (math 38% / reading 67%, grade C-, #154 of 667 statewide, top 24%, 2,228 students, 57% FRL) — zoned schools average 69% FRL vs 51% district-wide (18 pts higher); higher-poverty schools than district average — tighter screening recommended.
- Market conditions: Rents rising (+2.8%/yr); 629 active listings in the ZIP; 40 comparable units currently listed for rent nearby; rentals at typical pace (median 25d on market — plan ~3-4 weeks tenant-placement turnaround); solid renter incomes; 2,111 units permitted in Broward County in 2024 (1,265 in 5+ unit buildings).
- At $3,532/mo this rent would consume 50% of the median local household income ($85k/yr) (locally 1534% of renters already pay >50% of income on rent) — very limited rent-growth headroom before tenants either downsize or default.
Forward outlook
- Local home prices are declining (-3.0%/yr); year-one equity from $4k of loan paydown is wiped out by about $20k of value loss. Plan a longer hold.
- Broward County population projected at +34% by 2050 — long-run rental-demand tailwind backs the buy-and-hold thesis.
Negotiation context
- It's been on market 87 days — a 6% lower offer ($611k) is reasonable based on typical stale-listing flexibility.
Risks & watch-outs
- Watch-outs: flood insurance adds $152/mo; built in 1959 — expect roof / HVAC / electrical / plumbing capex.
- Climate carrying-cost: in FEMA flood zone AH (mandatory federal flood insurance); severe wind risk, 99% chance of damaging wind over 30y; extreme-heat days projected 7→27/yr by 2055 (HVAC capex compounding) — expect insurance premiums to compound above CPI over the hold.
Questions for the listing agent
- What do current leases actually rent for vs. the listed asking? Can we see a recent rent roll and the last 12 months of T-12 income?
- It's been on market 87 days. Have you received any prior offers? Is the seller open to a 46% concession, seller financing, or rate buy-down credit?
- Built in 1959 — when were the roof, HVAC, electrical panel, plumbing, and water heater last replaced?
- What's the actual annual flood-insurance premium (NFIP or private), and is the property in a SFHA with mandatory coverage?
- Any open or pending special assessments — roof, HVAC, plumbing, elevator, façade? What's the per-unit balance and payoff schedule, and is the seller paying it off at close or rolling it to the buyer?
- Why hasn't it sold? Are there any deal-killer items the seller is aware of (foundation, flood, title, zoning, code violations)?
- Is there a deadline driving the sale (1031 exchange, divorce, estate, relocation)? That informs how much negotiation room exists.
- Schools are B-rated — typically a magnet for longer-tenancy family renters. What's the average tenant stay here, and is there a school-zone premium baked into asking?
- The area grade is low — what's the realistic commute time and amenity access for the typical tenant pool here? Any planned neighborhood developments (good or bad) we should know about?
- What's the average days-on-market for RENTAL listings here right now (not sales)? A rising rental-DOM trend means longer vacancies and softer asking-rent achievability than the comps imply.
- What's the recent tenant-quality profile in this submarket — average credit score on applications, eviction rate, late-payment / NSF rate, and stable-employment percentage? A property-management company in the area should have these aggregated.
- How much new apartment / multifamily construction is in the pipeline within 1–3 miles? Heavy new supply (>2% of stock underway) typically softens rents 12–24 months out; light construction supports rent growth.
Investment metrics
- 1% rule
- 0.54% ✗
- Cap rate
- 3.15%
- Cash-on-cash
- -11.22%
- DSCR
- 0.50
- GRM
- 15.3
CMA / ARV
No comps found within radius.
Projected returns pro-forma
-3.0% appreciation · 2.75% rent growth · sell at horizon
- IRR
- -39.1%
- Equity multiple
- -0.23×
- Total profit
- $-224,110
- Equity at exit
- $96,917
- IRR
- -62.3%
- Equity multiple
- -0.92×
- Total profit
- $-350,173
- Equity at exit
- $56,200
Cash invested: $182,000 (down + closing). Projections, not guarantees.
Landlord ↔ Tenant lean methodology
- Overall (STATE)
- 87 Strongly Landlord-Friendly
- State Florida
- 87 Strongly Landlord-Friendly · R+3
- County
- — inherits STATE
- City
- — inherits STATE
ZIP-level market 33304
- Rents YoY
- 2.8%
- Active inventory
- 629
- Price-to-rent
- 15.3×
Monthly cashflow live
- Estimated rent
- $3,532 high interval (Pro) →
- Mortgage (P&I)
- −$3,409
- Tax est. 1.5%
- −$812 /mo · $9,750/yr
- Insurance
- −$271
- Flood insurance flood zone
- −$152 /mo · $1,824/yr
- HOA
- −$0
- Vacancy / Maint / Mgmt
- −$742
- Net cashflow
- $-1,853
Break-even live
Sensitivity live
| Price | -10% $-1,404 | -5% $-1,629 | +0% $-1,853 | +5% $-2,078 | +10% $-2,303 |
|---|---|---|---|---|---|
| Rent | -10% $-2,132 | -5% $-1,993 | +0% $-1,853 | +5% $-1,714 | +10% $-1,574 |
| Rate | -1.0pp $-1,526 | -0.5pp $-1,688 | base $-1,853 | +0.5pp $-2,022 | +1.0pp $-2,193 |
UW: 25.0% down · 7.5% · 30yr · 1.5% tax · 5.0% vac · 8.0% maint · 8.0% mgmt
Financing live
Cash to close
- Down payment
- $162,500
- Closing costs
- $19,500
- Reserves months
- —
- Total cash needed
- —
Loan-product check · same deal, 3 products live
Conventional
25% down · 7.5% · 30yr
- Down + closing
- —
- Monthly P&I
- —
- Monthly cashflow
- —
- DSCR
- —
- Eligible?
- —
Personal DTI + credit; lowest rate.
DSCR
20% down · 8.5% · 30yr
- Down + closing
- —
- Monthly P&I
- —
- Monthly cashflow
- —
- DSCR
- —
- Eligible?
- —
No personal income docs; deal must DSCR.
Hard money
10% down · 12.0% · 12mo
- Down + closing
- —
- Monthly P&I
- —
- Monthly cashflow
- —
- DSCR
- —
- Eligible?
- —
Short-term bridge; refi at stabilization.
Rent comps 40 comps
| Address | Beds | Baths | Sqft | Rent | $/sqft | DOM | Units | Dist |
|---|---|---|---|---|---|---|---|---|
| 1492 Holly Heights Dr Unit 1 Fort Lauderdale, FL | 3.0 | 2.0 | 1425 | $2,500 | $1.75 | 0d | 1 | 0.12mi |
| 1126 NE 16th Pl Unit 3 Fort Lauderdale, FL | 2.0 | 2.0 | 2391 | $2,350 | $0.98 | 23d | 1 | 0.17mi |
| 1649 NE 8th Ave Unit 1 Fort Lauderdale, FL | 1.0 | 1.0 | 1776 | $1,700 | $0.96 | 25d | 1 | 0.21mi |
| 1401 NE 15th St Unit 8 Fort Lauderdale, FL | 2.0 | 1.0 | 1472 | $1,950 | $1.32 | 25d | 1 | 0.27mi |
| 1520 NE 14th Ter Fort Lauderdale, FL | 3.0 | 2.0 | 1500 | $5,500 | $3.67 | 8d | 1 | 0.27mi |
| 1520 NE 14th Ter Fort Lauderdale, FL | 3.0 | 2.0 | 1500 | $5,500 | $3.67 | 15d | 1 | 0.27mi |
| 537 NE 14th Ct Fort Lauderdale, FL | 3.0 | 2.0 | 1668 | $4,750 | $2.85 | 25d | 1 | 0.29mi |
| 1531 NE 15th Ave Fort Lauderdale, FL | 3.0 | 2.0 | 1345 | $3,500 | $2.60 | 16d | 1 | 0.30mi |
| 1531 NE 15th Ave Fort Lauderdale, FL | 3.0 | 2.0 | 1345 | $3,700 | $2.75 | 25d | 1 | 0.30mi |
| 1321 NE 13th Ave Unit 1321 Fort Lauderdale, FL | 3.0 | 3.5 | 2500 | $8,750 | $3.50 | 25d | 1 | 0.31mi |
| 1606 NE 15th Ave Unit 1606 Fort Lauderdale, FL | 3.0 | 2.0 | 1550 | $5,200 | $3.35 | 25d | 1 | 0.33mi |
| 1524 NE 5th Ave Fort Lauderdale, FL | 2.0 | 2.0 | 1616 | $3,200 | $1.98 | 25d | 1 | 0.35mi |
| 1721 NE 15th Ave #1 Fort Lauderdale, FL | 2.0 | 1.0 | 1519 | $2,100 | $1.38 | 25d | 1 | 0.36mi |
| 1829 N Dixie Hwy Fort Lauderdale, FL | 2.0 | 1.0 | 1248 | $1,900 | $1.52 | 25d | 1 | 0.39mi |
| 1413 NE 5th Ave Unit 1 Fort Lauderdale, FL | 3.0 | 2.5 | 2000 | $3,975 | $1.99 | 8d | 1 | 0.41mi |
| 1015 NE 12th St Fort Lauderdale, FL | 3.0 | 2.0 | 1849 | $2,995 | $1.62 | 25d | 1 | 0.43mi |
| 1236 NE 14th Ave Fort Lauderdale, FL | 3.0 | 2.5 | 2400 | $4,000 | $1.67 | 18d | 1 | 0.43mi |
| 1245 NE 15th Ave Unit B Fort Lauderdale, FL | 1.0 | 1.0 | 2389 | $1,600 | $0.67 | 6d | 1 | 0.44mi |
| 1329 NE 5th Ave #3 Fort Lauderdale, FL | 1.0 | 1.5 | 1790 | $2,200 | $1.23 | 25d | 1 | 0.44mi |
| 1329 NE 5th Ave Unit 4 Fort Lauderdale, FL | 1.0 | 1.0 | 1790 | $2,200 | $1.23 | 19d | 1 | 0.44mi |
| 605 Kensington Pl Wilton Manors, FL | 3.0 | 2.5 | 1900 | $5,200 | $2.74 | 25d | 1 | 0.46mi |
| 590 NE 20th St Unit 1 Wilton Manors, FL | 2.0 | 1.0 | 2292 | $2,500 | $1.09 | 15d | 1 | 0.46mi |
| 590 NE 20th St Unit 2 Wilton Manors, FL | 3.0 | 2.0 | 2292 | $3,000 | $1.31 | 25d | 1 | 0.46mi |
| 1517 NE 3rd Ave Fort Lauderdale, FL | 3.0 | 2.0 | 1499 | $3,250 | $2.17 | 8d | 1 | 0.50mi |
| 1517 NE 3rd Ave Fort Lauderdale, FL | 3.0 | 2.0 | 1499 | $3,250 | $2.17 | 17d | 1 | 0.50mi |
| 1532 NE 17th Ave Fort Lauderdale, FL | 3.0 | 2.0 | 1612 | $5,500 | $3.41 | 11d | 1 | 0.50mi |
| 1118 NE 10th Ave Unit 1118 Fort Lauderdale, FL | 3.0 | 2.5 | 1603 | $4,950 | $3.09 | 25d | 1 | 0.51mi |
| 520 NE 20th St Wilton Manors, FL | 1.0–3.0 | 1.0–2.0 | 947 | $2,320 | $2.45 | 0d | 11 | 0.53mi |
| 1123 NE 14th Ave Unit 3 Fort Lauderdale, FL | 3.0 | 2.0 | 1504 | $3,550 | $2.36 | 25d | 1 | 0.55mi |
| 1421 NE 17th Ter Fort Lauderdale, FL | 2.0 | 2.5 | 1540 | $3,200 | $2.08 | 6d | 1 | 0.55mi |
| 201 NE 16th Ct Unit 1044531P Fort Lauderdale, FL | 2.0 | 2.0 | 1248 | $5,320 | $4.26 | 8d | 1 | 0.55mi |
| 1110 NE 14th Ave Fort Lauderdale, FL | 3.0 | 2.5 | 1513 | $4,000 | $2.64 | 0d | 1 | 0.56mi |
| 1110 NE 14th Ave Fort Lauderdale, FL | 3.0 | 2.5 | 1513 | $4,400 | $2.91 | 23d | 1 | 0.56mi |
| 1917 NE 16th Ter Fort Lauderdale, FL | 3.0 | 2.0 | 1674 | $3,850 | $2.30 | 25d | 1 | 0.57mi |
| 1724 NE 17th St Fort Lauderdale, FL | 2.0 | 1.0 | 1692 | $3,400 | $2.01 | 25d | 1 | 0.58mi |
| 1409 NE 2nd Ave Fort Lauderdale, FL | 3.0 | 2.0 | 1269 | $3,700 | $2.92 | 25d | 1 | 0.58mi |
| 1030 NE 9th Ave Unit 1 Fort Lauderdale, FL | 3.0 | 2.0 | 1900 | $5,050 | $2.66 | 25d | 1 | 0.60mi |
| 2008 NE 4th Ave Unit R Wilton Manors, FL | 2.0 | 2.0 | 2174 | $2,600 | $1.20 | 25d | 1 | 0.62mi |
| 2008 NE 4th Ave Unit R Wilton Manors, FL | 2.0 | 2.0 | 1274 | $2,600 | $2.04 | 4d | 1 | 0.62mi |
| 1204 NE 3rd Ave Fort Lauderdale, FL | 3.0 | 2.0 | 1500 | $3,550 | $2.37 | 25d | 1 | 0.62mi |
HOA detail condo
- Monthly dues
- $0 · $0/yr
- Likely covers
- electric
- Assessments
- None detected in remarks — confirm with the listing agent.
Listing history 17 events
-
2026-06-21days on market $650,000 Active 87 DOM
-
2026-06-18days on market $650,000 Active 84 DOM
-
2026-06-17days on market $650,000 Active 83 DOM
-
2026-06-16days on market $650,000 Active 82 DOM
-
2026-06-15days on market $650,000 Active 81 DOM
-
2026-06-13days on market $650,000 Active 79 DOM
-
2026-06-09days on market $650,000 Active 75 DOM
-
2026-06-08days on market $650,000 Active 74 DOM
-
2026-06-07days on market $650,000 Active 73 DOM
-
2026-06-04days on market $650,000 Active 70 DOM
-
2026-06-03days on market $650,000 Active 69 DOM
-
2026-06-02days on market $650,000 Active 68 DOM
-
2026-06-01days on market $650,000 Active 67 DOM
-
2026-05-31days on market $650,000 Active 66 DOM
-
2026-05-18price $650,000
-
2026-04-10price $875,000
-
2026-03-26$925,000 Active
ⓘ Source: listings_history table (triggers on properties + properties_extension) + one-shot
backfill from property_details.listing_events for pre-trigger history.
Climate risk First Street
- Flood 4/10 Moderate FEMA zone AH · 22% chance over 30 yrs
- Wildfire 1/10 Low
- Heat 10/10 Extreme 7 d/yr ≥105°F today · 27 d/yr by 30 yrs out
- Wind 10/10 Extreme 99% chance of damaging wind over 30 yrs
- Air quality 2/10 Low 1 unhealthy d/yr today · 1 by 30 yrs out
Nearby sold comps map
Loading sold comps map…
Walkable amenities ~0.75 mi
Loading nearby amenities…
Taxation est. · year 1
- Rental income
- $42,390
- − Mortgage interest
- −$36,410
- − Property taxes
- −$9,750
- − Insurance
- −$5,074
- − Repairs & maintenance
- −$3,391
- − Management
- −$3,391
- − Depreciation
- −$18,909
- Taxable loss
- −$34,536
- Est. tax savings @ 24.0%
- +$8,289
- After-tax cash flow
- $-13,952/yr
For passive investors: Depreciation is non-cash, so a rental often shows a tax loss while cash-flowing — sheltering income. Rental losses are passive: they offset passive income freely, and up to $25,000/yr can offset ordinary (W-2) income if you actively participate and your MAGI is under $100k (phasing out to $0 by $150k); unused losses carry forward. On sale, claimed depreciation is recaptured at up to 25%, and gains may owe capital-gains tax (a 1031 exchange can defer both). Figures are a year-1 estimate at your 24.0% rate — not tax advice; consult a CPA.
Condition & rehab AI · 12 photos
This property is in good condition with recent updates and is ready for immediate occupancy or repositioning.
Value-add opportunities
- Both Paint the exterior — Enhances curb appeal and property value.
- Rental Replace the air filters — Improves air quality and tenant satisfaction.
Renovation cost estimate screening
Value-add ROI direction
- Both Paint the exterior — Enhances curb appeal and property value. ↑
- Rental Replace the air filters — Improves air quality and tenant satisfaction. ↑
ⓘ Cost ranges are severity-bucket heuristics (US national rule-of-thumb). Get contractor quotes + a written scope before underwriting a rehab budget.
Schools (NCES district)
- District
- Broward
- NCES district ID
- 1200180
- Math proficiency
- 42% ▼ -18.00%
- Reading proficiency
- 53% ▼ -5.00%
- Median HH income
- $52,139
- Composite
- 40.88/100
- National rank
- #3621
- State rank
- #46 of 73 in FL
Livability — Fort Lauderdale
- Score
- 82/100
- State rank
- #78
- US rank
- #1293
Category grades
Schools grade is shown separately in the Schools card above.
Census & demographics
- Census place
- Fort Lauderdale, FL
- County
- Broward County · 1,963,430 people
- City population
- 235,769
- Metro
- Miami-Fort Lauderdale-Pompano Beach, FL
- Population (ZIP)
- 18,332
- Household income
- $84,920
- Rent vs Own
- Severe rent burden
- 1534.0
Population outlook (Broward County) Hauer SSP2
- Today (2025)
- 2,207,033 people
- By 2030
- 2,360,704 · +7.0%
- By 2040
- 2,661,208 · +20.6%
- By 2050
- 2,946,698 · +33.5%
- By 2075
- 3,602,273 · +63.2%
- By 2100
- 3,970,984 · +79.9%
Race, ethnicity, and origin ACS 2023
- Neighborhood character
- Diverse neighborhood (Simpson 0.63)
- Race & ethnicity
- White 56% Hispanic / Latino 19% Two or more races 17% Black 13% Asian 4%
- Hispanic origin (detail)
- Mexican 2% Puerto Rican 4% Cuban 3%
- Common ancestry
- Hispanic 5% Scotch-Irish 3% Romanian 2%
- Foreign-born
- 32% · Canada, Jamaica, Vietnam
- Languages at home
- 61% English-only · Spanish 20% Other Indo-European 6% French/Haitian/Cajun 5%
Political lean MEDSL · Broward
- 2024 margin
- D (+17.0) · D 58.0% · R 41.0%
- 2008→2024 swing
- -17.8pp toward R · 2008: 34.7pp · 2024: 17.0pp
- All cycles
- 2024: D+17.0 2020: D+29.8 2016: D+35.0 2012: D+34.9 2008: D+34.7
Not yet ingested
- Civics
- —
Market trends
- HPI YoY
- ▼ -522.22%
- Current HPI
- 348.0065
- Rent YoY
- ▲ 2.75%
- Metro
- Miami-Fort Lauderdale-Pompano Beach, FL
- State GDP YoY
- ▲ 3.28%
- F500 in state
- 36
Industry mix (Fortune 500 HQ in FL)
| Industry | F500 HQs | Revenue |
|---|---|---|
| Industrial Technology | 2 | $29B |
|
||
| Insurance | 2 | $17B |
|
||
| Retail | 1 | $60B |
|
||
| Technology Distribution | 1 | $58B |
|
||
| Homebuilding | 1 | $35B |
|
||
| Technology Manufacturing | 1 | $35B |
|
||
Price history
-29.7% since first listed3 events — show timeline
- 2026-05-18 Price Changed $650,000 Beaches MLS
- 2026-04-10 Price Changed $875,000 Beaches MLS
- 2026-03-26 Listed $925,000 Beaches MLS
Cash-flow waterfall
monthlySold comps — $/sqft
last 12 mo · ≤1 miLoading sold comps…