 Multi-family
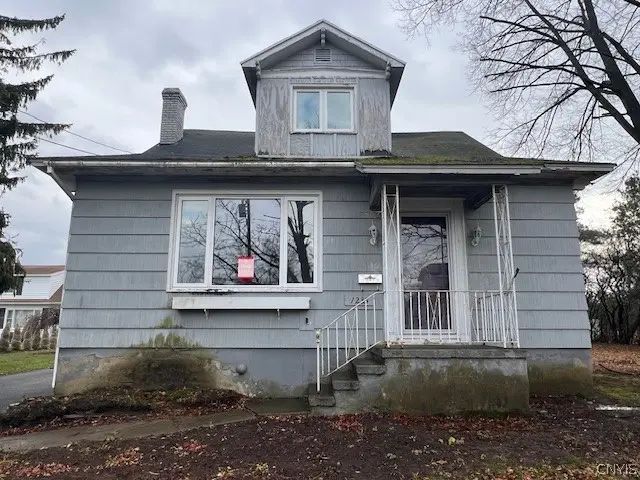
1235 Hammond Ave #2 · Utica, NY
Flood risk 1/10 · Minimal
- FEMA flood zone
- X (unshaded)
- Chance of flooding over 30 yrs
- 0.0%
- Est. flood insurance / yr
- $473 – $860
Fire risk 3/10 · Minor
- Est. fire insurance / yr
- $691 – $1,283
Heat risk 3/10 · Minor
- Hot days now (above 95°F)
- 7 days/yr
- Hot days in 30 yrs
- 17 days/yr
Wind risk 2/10 · Minimal
- Chance of severe wind over 30 yrs
- 1.0%
Air-quality risk 2/10 · Minimal
- Unhealthy air days now
- 0 days/yr
- Unhealthy air days in 30 yrs
- 1 days/yr
Risk factors via First Street. Map © Google.
Why this score? — see what drove the A grade
The composite is a weighted blend of 9 inputs, each scored 0–100. Each bar is that input's sub-score; the figure is the points it added to the 100-point composite (weight × sub-score).
- Cash flow +30.0/30.0
- ARV discount +15.0/15.0
- 1% rule +10.0/10.0
- DSCR +10.0/10.0
- Appreciation +10.0/10.0
- Livability +4.0/5.0
- Schools +2.9/10.0
- Rent growth +2.5/5.0
- Condition / age +2.0/5.0
$144,900
🖨 Deal sheet 📄 Offer letter ✓ Due diligence
Multi-family units
County records classify this as Multi-Family (2-4 Unit). Listing-text estimate: 1 unit. estimate disagrees with records
Listing remarks
This two-unit property offers exceptional potential, featuring separate private entrances and a detached two-stall garage. Each unit includes three bedrooms, and the upper unit adds convenience with its own laundry room. With some sweat equity and TLC, you can restore this home to its original charm. A great opportunity for a summer project or investment. Additional lot is also included to the right of this property. Total frontage for both lots is 120 feet. Being sold as-is.
Key facts
- Total frontage
- Laundry room
- Private entrances
Tags
Property features AI
Finance
- Financial info: Multi-unit property with 2 total units; Operating expense details referenced in remarks
- HOA & community: Other annual assessment reported
Exterior
- Parking: Attached garage with 2 spaces; Additional off-street parking (two or more spaces)
- Utilities: Public water connected; Sewer connected
- Home design: 2-story building; Resale property
- Construction: Composite siding; Asphalt roof; Existing (previously built)
- Exterior features: Rectangular residential lot; City street frontage; Lot dimensions approximately 80 x 149
Interior
- Kitchen: No kitchen appliance details provided
- Bedrooms: Duplex with 2 units total
- Flooring: Carpet; Hardwood; Vinyl; Varied flooring
- Bathrooms: 2 full bathrooms (total)
- Heating & cooling: Gas forced-air heating
- Interior features: Full basement; Gas water heater
- Laundry & utility: Separate electric meters for units (2); Single shared gas meter
Neighborhood map
What this means for you Summary
Snapshot
- This is a 6-bed/2.0-bath multifamily listed at $145k. Condition is rated fair.
Deal economics
- At list price, monthly cash flow is $2k ($25k/yr) — positive.
- The deal already cash-flows at list — no discount required.
- Meets the 1% rule at list price ($4k rent vs $145k).
- Cap rate 23.2% vs local median 7.7% in Utica — top-decile yield for the area; either an underpriced asset or a hidden risk that comps aren't pricing in. Stress-test before assuming the spread holds.
Location & tenants
- Location reads 80/100 on livability (#104 in NY, #1,589 nationally) — a professional / high-income tenant draw. Strengths: commute A+, cost of living A+, housing A+; Watch: employment D, schools D-, crime F.
- Utica City School District (urban): math 33% / reading 38% proficiency, ranked #562 of 590 in NY (top 95%) — families likely to look elsewhere, expect single-tenant / working-renter base with shorter leases; 71% free/reduced lunch — lower-income household profile, screen leases tightly.
- Market conditions: 143 active listings in the ZIP; 204 units permitted in Oneida County in 2024 (68 in 5+ unit buildings).
- At $3,852/mo this rent would consume 88% of the median local household income ($53k/yr) (locally 2251% of renters already pay >50% of income on rent) — very limited rent-growth headroom before tenants either downsize or default.
Forward outlook
- In year one you build about $15k of equity ($1k loan paydown + $14k appreciation (10.0% local appreciation)).
- Oneida County population projected at -12% by 2050 — secular population decline; favor cash flow + early exit over multi-decade hold.
- At projected returns (10.0% appreciation + 3.0% rent growth), your $41k cash investment doubles in ~2 years — after that, you're playing with house money.
- By year 3, paydown + projected appreciation supports a ~$39k cash-out refi (75% LTV) — recoverable capital for the next deal without selling this one.
Negotiation context
- Only 6 days on market — expect competitive offers; lowballing is unlikely to land.
- 2 sale attempts with the ask held roughly flat each time — persistent listings suggest the price (not the market) is what's stuck; bring a comps-based counter.
Risks & watch-outs
- Watch-outs: built in 1930 — expect roof / HVAC / electrical / plumbing capex.
Questions for the listing agent
- Have any recent inspections been done? Can we get a copy of the seller's disclosures and any deferred-maintenance estimates?
- Built in 1930 — when were the roof, HVAC, electrical panel, plumbing, and water heater last replaced?
- Is there a deadline driving the sale (1031 exchange, divorce, estate, relocation)? That informs how much negotiation room exists.
- Schools are D-rated, which usually means shorter tenancies and higher turnover. Who's the typical renter profile here, and what's been the actual vacancy rate?
- Crime grade is F in this area — have there been break-ins, vandalism, or insurance claims at this property in the last 3 years? What carrier currently insures it and at what premium?
- What's the average days-on-market for RENTAL listings here right now (not sales)? A rising rental-DOM trend means longer vacancies and softer asking-rent achievability than the comps imply.
- What's the recent tenant-quality profile in this submarket — average credit score on applications, eviction rate, late-payment / NSF rate, and stable-employment percentage? A property-management company in the area should have these aggregated.
- How much new apartment / multifamily construction is in the pipeline within 1–3 miles? Heavy new supply (>2% of stock underway) typically softens rents 12–24 months out; light construction supports rent growth.
Investment metrics
- 1% rule
- 2.66% ✓
- Cap rate
- 23.20%
- Cash-on-cash
- 60.39%
- DSCR
- 3.69
- GRM
- 3.1
CMA / ARV
- ARV (on-the-fly)
- $226,233
- Comps found
- 12
Show comp detail 12 sales within ~0.75 mi
| Address | Dist | Beds/Ba | Sqft | Sold | Price | $/sf | Match |
|---|---|---|---|---|---|---|---|
| 914 Eagle St | 0.18mi | 6/2.0 | 2,400 (-14%) | 5mo | $150,000 | $63 | 64 |
| 1619 Mohawk St | 0.57mi | 6/2.0 | 2,704 (-3%) | 6mo | $240,000 | $89 | 63 |
| 1311 Taylor Ave | 0.63mi | 5/2.0 (-1) | 2,732 (-2%) | 8mo | $90,000 | $33 | 55 |
| 1131 Saint Vincent St | 0.59mi | 7/3.0 (+1) | 2,737 (-2%) | 7mo | $160,000 | $58 | 54 |
| 923 Rutger St | 0.66mi | 6/2.0 | 2,600 (-7%) | 4mo | $245,500 | $94 | 54 |
| 1547 Mohawk St | 0.47mi | 6/2.0 | 2,496 (-11%) | 10mo | $250,000 | $100 | 52 |
| 810 South St | 0.49mi | 6/2.0 | 2,452 (-12%) | 8mo | $195,000 | $80 | 50 |
| 1020 Tilden Ave | 0.75mi | 6/2.0 | 2,508 (-10%) | 5mo | $230,000 | $92 | 44 |
| 1222 Mummery St | 0.54mi | 5/2.0 (-1) | 2,401 (-14%) | 6mo | $195,000 | $81 | 41 |
| 1146 Brinckerhoff Ave | 0.75mi | 5/4.0 (-1) | 2,692 (-4%) | 6mo | $115,000 | $43 | 41 |
| 1010 Morris St | 0.71mi | 5/2.0 (-1) | 2,512 (-10%) | 8mo | $280,000 | $111 | 39 |
| 1418 Brinckerhoff Ave | 0.72mi | 6/2.0 | 2,406 (-14%) | 9mo | $105,001 | $44 | 36 |
Match score weights: distance 35% · size 25% · config 20% · recency 20%. Top-matched comps best support the ARV.
Projected returns pro-forma
10.0% appreciation · 3.0% rent growth · sell at horizon
- IRR
- 72.5%
- Equity multiple
- 6.15×
- Total profit
- $209,012
- Equity at exit
- $130,537
- IRR
- 66.4%
- Equity multiple
- 13.65×
- Total profit
- $513,361
- Equity at exit
- $281,509
Cash invested: $40,572 (down + closing). Projections, not guarantees.
Landlord ↔ Tenant lean methodology
- Overall (STATE)
- 15 Strongly Tenant-Friendly
- State New York
- 15 Strongly Tenant-Friendly · D+10
- County
- — inherits STATE
- City
- — inherits STATE
ZIP-level market 13501
- Home prices YoY
- 5.6%
- Active inventory
- 143
- Price-to-rent
- 6.3×
Monthly cashflow live
- Estimated rent
- $3,852 high interval (Pro) →
- Mortgage (P&I)
- −$760
- Tax est. 1.5%
- −$181 /mo · $2,174/yr
- Insurance
- −$60
- HOA
- −$0
- Vacancy / Maint / Mgmt
- −$809
- Net cashflow
- $2,042
Break-even live
2-unit breakdown (identical units grouped — click to expand)
| Units | Beds | Baths | Est. rent |
|---|---|---|---|
| 2× units | 3 | 1 | $3,852 |
| #1 | 3 | 1 | $1,926 |
| #2 | 3 | 1 | $1,926 |
| Total (2 units) | $3,852 | ||
UW: 25.0% down · 7.5% · 30yr · 1.5% tax · 5.0% vac · 8.0% maint · 8.0% mgmt
Financing live
Cash to close
- Down payment
- $36,225
- Closing costs
- $4,347
- Reserves months
- —
- Total cash needed
- —
Loan-product check · same deal, 3 products live
Conventional
25% down · 7.5% · 30yr
- Down + closing
- —
- Monthly P&I
- —
- Monthly cashflow
- —
- DSCR
- —
- Eligible?
- —
Personal DTI + credit; lowest rate.
DSCR
20% down · 8.5% · 30yr
- Down + closing
- —
- Monthly P&I
- —
- Monthly cashflow
- —
- DSCR
- —
- Eligible?
- —
No personal income docs; deal must DSCR.
Hard money
10% down · 12.0% · 12mo
- Down + closing
- —
- Monthly P&I
- —
- Monthly cashflow
- —
- DSCR
- —
- Eligible?
- —
Short-term bridge; refi at stabilization.
Listing history 6 events
-
2026-05-23$144,900 Active
-
2026-04-24historical
-
2026-01-11price $149,000
-
2025-12-19price $152,900
-
2025-11-26price $159,900
-
2025-11-26$159,000 Active
ⓘ Source: listings_history table (triggers on properties + properties_extension) + one-shot
backfill from property_details.listing_events for pre-trigger history.
Climate risk First Street
- Flood 1/10 Low FEMA zone X (unshaded) · 0% chance over 30 yrs
- Wildfire 3/10 Moderate
- Heat 3/10 Moderate 7 d/yr ≥95°F today · 17 d/yr by 30 yrs out
- Wind 2/10 Low 100% chance of damaging wind over 30 yrs
- Air quality 2/10 Low 0 unhealthy d/yr today · 1 by 30 yrs out
Nearby sold comps map
Loading sold comps map…
Walkable amenities ~0.75 mi
Loading nearby amenities…
Taxation est. · year 1
- Rental income
- $46,224
- − Mortgage interest
- −$8,117
- − Property taxes
- −$2,174
- − Insurance
- −$724
- − Repairs & maintenance
- −$3,698
- − Management
- −$3,698
- − Depreciation
- −$4,215
- Taxable income
- $23,598
- Est. tax owed @ 24.0%
- −$5,664
- After-tax cash flow
- $18,837/yr
For passive investors: Depreciation is non-cash, so a rental often shows a tax loss while cash-flowing — sheltering income. Rental losses are passive: they offset passive income freely, and up to $25,000/yr can offset ordinary (W-2) income if you actively participate and your MAGI is under $100k (phasing out to $0 by $150k); unused losses carry forward. On sale, claimed depreciation is recaptured at up to 25%, and gains may owe capital-gains tax (a 1031 exchange can defer both). Figures are a year-1 estimate at your 24.0% rate — not tax advice; consult a CPA.
Condition & rehab AI · 1 photo
This two-unit property requires moderate renovations to improve its curb appeal and value. Exterior repairs and maintenance are critical to address weathered siding, moss on the roof, and overgrown vegetation.
Repairs flagged
- Major siding — Severe weathering and moss
- Major roof — Moss and potential water damage
- Major exterior — Overgrown vegetation and debris
Value-add opportunities
- Both paint exterior — Enhances curb appeal and value
- Both trim overgrown vegetation — Improves curb appeal and safety
- Both repair and replace siding — Fixes major issue and improves appearance
- Both repair and replace roof — Fixes major issue and improves appearance
Renovation cost estimate screening
| Repair item | Severity | Est. cost |
|---|---|---|
| siding · Severe weathering and moss | Major | $15,000–50,000 |
| roof · Moss and potential water damage | Major | $15,000–50,000 |
| exterior · Overgrown vegetation and debris | Major | $15,000–50,000 |
| Total estimated repair cost · 3 items | $45,000–150,000 |
Value-add ROI direction
- Both paint exterior — Enhances curb appeal and value ↑
- Both trim overgrown vegetation — Improves curb appeal and safety ↑
- Both repair and replace siding — Fixes major issue and improves appearance ↑
- Both repair and replace roof — Fixes major issue and improves appearance ↑
ⓘ Cost ranges are severity-bucket heuristics (US national rule-of-thumb). Get contractor quotes + a written scope before underwriting a rehab budget.
Schools (NCES district)
- District
- Utica City School District
- NCES district ID
- 3629370
- Math proficiency
- 33% ▼ -7.00%
- Reading proficiency
- 38% ▲ 2.00%
- Median HH income
- $31,834
- Composite
- 29.01/100
- National rank
- #6613
- State rank
- #562 of 590 in NY
Livability — Utica
- Score
- 80/100
- State rank
- #104
- US rank
- #1589
Category grades
Schools grade is shown separately in the Schools card above.
Census & demographics
- Census place
- Utica, NY
- County
- Oneida County · 89,710 people
- City population
- 72,968
- Metro
- Utica-Rome, NY
- Population (ZIP)
- 38,931
- Household income
- $52,548
- Rent vs Own
- Severe rent burden
- 2251.0
Population outlook (Oneida County) Hauer SSP2
- Today (2025)
- 225,223 people
- By 2030
- 220,384 · -2.1%
- By 2040
- 209,071 · -7.2%
- By 2050
- 197,920 · -12.1%
- By 2075
- 175,541 · -22.1%
- By 2100
- 148,491 · -34.1%
Race, ethnicity, and origin ACS 2023
- Neighborhood character
- Highly diverse neighborhood (Simpson 0.70)
- Race & ethnicity
- White 49% Two or more races 15% Hispanic / Latino 14% Black 14% Asian 14%
- Hispanic origin (detail)
- Puerto Rican 8% Dominican 4%
- Common ancestry
- American 8% Romanian 3% Lithuanian 1%
- Foreign-born
- 25% · Canada, Philippines, Vietnam
- Languages at home
- 62% English-only · Other Asian/Pacific 11% Russian/Polish/Slavic 10% Spanish 9%
Political lean MEDSL · Oneida
- 2024 margin
- Strong R (+21.3) · D 39.4% · R 60.6%
- 2008→2024 swing
- -15.2pp toward R · 2008: -6.1pp · 2024: -21.3pp
- All cycles
- 2024: R+21.3 2020: R+15.5 2016: R+21.1 2012: R+5.3 2008: R+6.1
Not yet ingested
- Civics
- —
Market trends
- HPI YoY
- ▲ 20.28%
- Current HPI
- 382.3726
- Rent YoY
- —
- Metro
- Utica-Rome, NY
- State GDP YoY
- ▲ 2.60%
- F500 in state
- 92
Industry mix (Fortune 500 HQ in NY)
| Industry | F500 HQs | Revenue |
|---|---|---|
| Financial Services | 10 | $950B |
|
||
| Consumer Goods | 9 | $162B |
|
||
| Insurance | 4 | $225B |
|
||
| Telecommunications | 2 | $144B |
|
||
| Pharmaceuticals | 2 | $112B |
|
||
| Media / Entertainment | 2 | $69B |
|
||
Price history
-8.9% since first listed6 events — show timeline
- 2026-05-23 Listed $144,900 CNYIS
- 2026-04-24 Listing Removed — CNYIS
- 2026-01-11 Price Changed $149,000 CNYIS
- 2025-12-19 Price Changed $152,900 CNYIS
- 2025-11-26 Price Changed $159,900 CNYIS
- 2025-11-26 Listed $159,000 CNYIS
Cash-flow waterfall
monthlySold comps — $/sqft
last 12 mo · ≤1 miLoading sold comps…