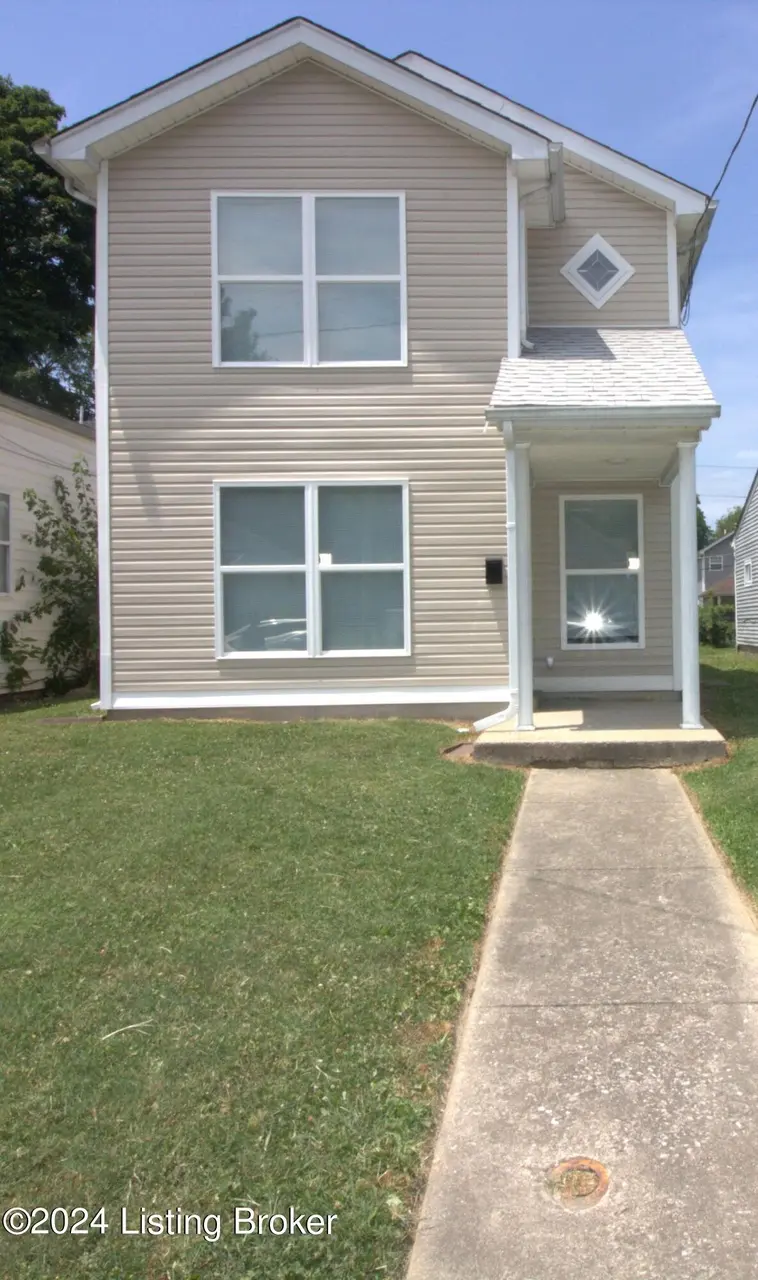
2914 S 5th St · Louisville, KY
Flood risk 1/10 · Minimal
- FEMA flood zone
- X (unshaded)
- Chance of flooding over 30 yrs
- 0.0%
- Est. flood insurance / yr
- $507 – $1,088
Fire risk 1/10 · Minimal
- Est. fire insurance / yr
- $839 – $1,559
Heat risk 5/10 · Moderate
- Hot days now (above 104°F)
- 7 days/yr
- Hot days in 30 yrs
- 20 days/yr
Wind risk 2/10 · Minimal
- Chance of severe wind over 30 yrs
- 1.0%
Air-quality risk 2/10 · Minimal
- Unhealthy air days now
- 1 days/yr
- Unhealthy air days in 30 yrs
- 3 days/yr
Risk factors via First Street. Map © Google.
Why this score? — see what drove the D- grade
The composite is a weighted blend of 9 inputs, each scored 0–100. Each bar is that input's sub-score; the figure is the points it added to the 100-point composite (weight × sub-score).
- Cash flow +14.3/30.0
- DSCR +4.3/10.0
- 1% rule +4.0/10.0
- Rent growth +4.0/5.0
- Livability +3.2/5.0
- Condition / age +2.5/5.0
- Schools +2.3/10.0
- ARV discount +2.1/15.0
- Appreciation +0.0/10.0
$181,000
🖨 Deal sheet (PDF) 📄 Offer letter ✓ Due diligence
Listing remarks
Check out this unique ''Urban Quad-Level'' Floor plan. Yes 3 levels plus a Basement. The 3-4 bedroom home with 2 Full baths is renovated and ready for you to move right in. The 1st level features Open Living Room and Dinning Area combination along with the Galley Kitchen, with Oak Cabinetry, plus granite countertops. New Black Finish Range, Refrigerator, and Dishwasher. A few steps up to the 2nd level and you'll find a Full Bath along with 2 Bedrooms. Move on up to Level # and you are Sold! The Over-sized Master Suite features Vaulted Ceiling, Walk-in Closet, and a Private full bath. Let's not forget the lowest level counted in the total square has an egress window, so make this your 4th be
Key facts
- Dinning area
- Oak cabinetry
- Open living room
Tags
Property features AI
Finance
- HOA & community: No association fee
Exterior
- Utilities: Electricity connected; Natural gas available
- Home design: Single family residence; Two stories; Built in 1996
- Construction: Vinyl siding; Shingle roof; Above-grade finished living area reported
- Exterior features: Lot is approximately 0.09 acres; Located in the Churchill subdivision
Interior
- Kitchen: Kitchen on the first floor
- Bedrooms: Four bedrooms total; Primary bedroom on the third floor; One bedroom on the basement level (egress window; can serve as family room or fourth bedroom); Two bedrooms on the second floor; No first-floor bedrooms
- Bathrooms: Two full bathrooms; Full bathrooms located on the third floor
- Heating & cooling: Forced air heating (natural gas); Central air conditioning
- Interior features: Partially finished basement; Basement has one closet; Six total rooms
- Laundry & utility: No first-floor laundry
Neighborhood map
What this means for you Summary
Snapshot
- This is a 4-bed/2.0-bath single-family listed at $181k.
Deal economics
- At list price, monthly cash flow is $32 ($387/yr) — positive.
- The deal already cash-flows at list — no discount required.
- To meet the 1% rule (rent ≥ 1% of price), the offer needs to be $162k (10.3% below list).
- Recommended offer: $162k (10.3% below list) — sets the bar for 1% rule.
- Cap rate 6.5% vs local median 5.0% in Louisville — top-decile yield for the area; either an underpriced asset or a hidden risk that comps aren't pricing in. Stress-test before assuming the spread holds.
Location & tenants
- Location reads 63/100 on livability (#333 in KY) — a middle-class / working-renter tenant base. Strengths: cost of living A+, housing A+; Watch: employment C-, health & safety D+, crime F.
- Jefferson County (urban): math 19% / reading 35% proficiency, ranked #121 of 165 in KY (top 73%) — low school quality limits family demand, transient renter base, plan for 1-2y turnover.
- Zoned schools: Frayser Elementary (math 2% / reading 8%, grade F, #670 of 676 statewide, top 100%, 318 students, 80% FRL); Noe Middle (math 49% / reading 62%, grade B-, #7 of 217 statewide, top 3%, 1,347 students, 46% FRL); Iroquois High (math 12% / reading 8%, grade F, #245 of 254 statewide, top 97%, 1,090 students, 74% FRL).
- Market conditions: Rents rising fast (+6.1%/yr); 76 active listings in the ZIP; 30 comparable units currently listed for rent nearby; rentals at typical pace (median 19d on market — plan ~3-4 weeks tenant-placement turnaround); lower-income renter base — watch delinquency; 2,836 units permitted in Jefferson County in 2024 (1,558 in 5+ unit buildings).
- At $1,624/mo this rent would consume 49% of the median local household income ($40k/yr) (locally 1136% of renters already pay >50% of income on rent) — very limited rent-growth headroom before tenants either downsize or default.
Forward outlook
- Local home prices are declining (-3.0%/yr); year-one equity from $1k of loan paydown is wiped out by about $5k of value loss. Plan a longer hold.
- Jefferson County population projected at +13% by 2050 — modest demand growth; plan on rents tracking national, not racing it.
Negotiation context
- It's been on market 41 days — a 3% lower offer ($176k) is reasonable based on typical stale-listing flexibility.
- 2 sale attempts since 2y ago with the ask held roughly flat each time — persistent listings suggest the price (not the market) is what's stuck; bring a comps-based counter.
Risks & watch-outs
- Climate carrying-cost: extreme-heat days projected 7→20/yr by 2055 (HVAC capex compounding) — expect insurance premiums to compound above CPI over the hold.
Questions for the listing agent
- It's been on market 41 days. Have you received any prior offers? Is the seller open to a 10% concession, seller financing, or rate buy-down credit?
- Is there a deadline driving the sale (1031 exchange, divorce, estate, relocation)? That informs how much negotiation room exists.
- Schools are D-rated, which usually means shorter tenancies and higher turnover. Who's the typical renter profile here, and what's been the actual vacancy rate?
- Crime grade is F in this area — have there been break-ins, vandalism, or insurance claims at this property in the last 3 years? What carrier currently insures it and at what premium?
- The area grade is low — what's the realistic commute time and amenity access for the typical tenant pool here? Any planned neighborhood developments (good or bad) we should know about?
- What's the average days-on-market for RENTAL listings here right now (not sales)? A rising rental-DOM trend means longer vacancies and softer asking-rent achievability than the comps imply.
- What's the recent tenant-quality profile in this submarket — average credit score on applications, eviction rate, late-payment / NSF rate, and stable-employment percentage? A property-management company in the area should have these aggregated.
- How much new for-sale + rental construction is in the pipeline within 1–3 miles? Heavy new supply typically softens prices + rents 12–24 months out; constrained supply supports both.
Investment metrics
- 1% rule
- 0.90% ✗
- Cap rate
- 6.51%
- Cash-on-cash
- 0.76%
- DSCR
- 1.03
- GRM
- 9.3
CMA / ARV
- ARV (on-the-fly)
- $161,728
- Comps found
- 12
Show comp detail 12 sales within ~0.75 mi
| Address | Dist | Beds/Ba | Sqft | Sold | Price | $/sf | Match |
|---|---|---|---|---|---|---|---|
| 513 M St | 0.15mi | 3/1.0 (-1) | 1,464 (+1%) | 2mo | $160,000 | $109 | 80 |
| 2922 S 5th St | 0.02mi | 3/2.0 (-1) | 1,311 (-9%) | 7mo | $180,000 | $137 | 73 |
| 708 Iowa Ave | 0.21mi | 3/2.0 (-1) | 1,550 (+7%) | 5mo | $180,000 | $116 | 69 |
| 724 Creel Ave | 0.48mi | 4/2.0 | 1,438 (-0%) | 10mo | $147,000 | $102 | 69 |
| 2827 S 5th St | 0.07mi | 3/2.0 (-1) | 1,307 (-10%) | 12mo | $170,000 | $130 | 66 |
| 1121 Larchmont Ave | 0.58mi | 3/2.0 (-1) | 1,426 (-1%) | 3mo | $150,000 | $105 | 63 |
| 713 Creel Ave | 0.46mi | 3/1.0 (-1) | 1,385 (-4%) | 5mo | $155,000 | $112 | 58 |
| 4010 S 3rd St | 0.67mi | 4/1.0 | 1,498 (+4%) | 2mo | $212,000 | $142 | 57 |
| 576 Longfield Ave | 0.67mi | 3/1.0 (-1) | 1,414 (-2%) | 1mo | $179,300 | $127 | 55 |
| 514 Winkler Ave | 0.21mi | 3/1.0 (-1) | 1,659 (+15%) | 1mo | $142,500 | $86 | 55 |
| 617 Creel Ave | 0.42mi | 4/2.0 | 1,616 (+12%) | 8mo | $180,000 | $111 | 54 |
| 1125 Homeview Dr | 0.64mi | 3/1.0 (-1) | 1,230 (-15%) | 2mo | $125,000 | $102 | 34 |
Match score weights: distance 35% · size 25% · config 20% · recency 20%. Top-matched comps best support the ARV.
Projected returns pro-forma
-3.0% appreciation · 6.06% rent growth · sell at horizon
- IRR
- -11.7%
- Equity multiple
- 0.56×
- Total profit
- $-22,100
- Equity at exit
- $26,988
- IRR
- 1.5%
- Equity multiple
- 1.12×
- Total profit
- $6,018
- Equity at exit
- $15,650
Cash invested: $50,680 (down + closing). Projections, not guarantees.
Landlord ↔ Tenant lean methodology
- Overall (STATE)
- 83 Strongly Landlord-Friendly
- State Kentucky
- 83 Strongly Landlord-Friendly · R+16
- County
- — inherits STATE
- City
- — inherits STATE
ZIP-level market 40208
- Home prices YoY
- -23.3%
- Rents YoY
- 6.1%
- Active inventory
- 76
- Price-to-rent
- 9.3×
Monthly cashflow live
- Estimated rent
- $1,624 high interval (Pro) →
- Mortgage (P&I)
- −$949
- Tax est. 1.5%
- −$226 /mo · $2,715/yr
- Insurance
- −$75
- HOA
- −$0
- Vacancy / Maint / Mgmt
- −$341
- Net cashflow
- $32
Break-even live
Sensitivity live
| Price | -10% $157 | -5% $95 | +0% $32 | +5% $-30 | +10% $-93 |
|---|---|---|---|---|---|
| Rent | -10% $-96 | -5% $-32 | +0% $32 | +5% $96 | +10% $161 |
| Rate | -1.0pp $123 | -0.5pp $78 | base $32 | +0.5pp $-15 | +1.0pp $-62 |
UW: 25.0% down · 7.5% · 30yr · 1.5% tax · 5.0% vac · 8.0% maint · 8.0% mgmt
Financing live
Cash to close
- Down payment
- $45,250
- Closing costs
- $5,430
- Reserves months
- —
- Total cash needed
- —
Loan-product check · same deal, 3 products live
Conventional
25% down · 7.5% · 30yr
- Down + closing
- —
- Monthly P&I
- —
- Monthly cashflow
- —
- DSCR
- —
- Eligible?
- —
Personal DTI + credit; lowest rate.
DSCR
20% down · 8.5% · 30yr
- Down + closing
- —
- Monthly P&I
- —
- Monthly cashflow
- —
- DSCR
- —
- Eligible?
- —
No personal income docs; deal must DSCR.
Hard money
10% down · 12.0% · 12mo
- Down + closing
- —
- Monthly P&I
- —
- Monthly cashflow
- —
- DSCR
- —
- Eligible?
- —
Short-term bridge; refi at stabilization.
Rent comps 30 comps
| Address | Beds | Baths | Sqft | Rent | $/sqft | DOM | Units | Dist |
|---|---|---|---|---|---|---|---|---|
| 315 M St Unit 101 Louisville, KY | 3.0 | 1.5 | 1200 | $1,800 | $1.50 | 13d | 1 | 0.22mi |
| 2711 S 3rd St Unit 1 Louisville, KY | 4.0 | 2.0 | 1800 | $2,400 | $1.33 | 13d | 1 | 0.30mi |
| 2826 Taylor Blvd Louisville, KY | 3.0 | 1.0 | 1044 | $1,345 | $1.29 | 25d | 1 | 0.37mi |
| 3102 Grant Ave Louisville, KY | 4.0 | 2.0 | 1603 | $1,595 | $1.00 | 25d | 1 | 0.40mi |
| 2501 S 4th St Louisville, KY | 1.0–3.0 | 1.0–3.0 | 897 | $6,345 | $7.07 | 5d | 1 | 0.50mi |
| 510 Colorado Ave Louisville, KY | 3.0 | 2.0 | 1500 | $1,750 | $1.17 | 25d | 1 | 0.50mi |
| 3860 Southern Pkwy Louisville, KY | 3.0 | 1.0 | 1064 | $1,250 | $1.17 | 25d | 1 | 0.60mi |
| 1301 Lillian Ave Louisville, KY | 3.0 | 1.0 | 974 | $1,250 | $1.28 | 17d | 1 | 0.61mi |
| 310 W Kenton St Louisville, KY | 3.0 | 2.0 | 1295 | $1,350 | $1.04 | 25d | 1 | 0.62mi |
| 1147 Lincoln Ave Louisville, KY | 4.0 | 1.0 | 1323 | $1,295 | $0.98 | 4d | 1 | 0.64mi |
| 3909 Southern Pkwy Unit 2 Louisville, KY | 3.0 | 1.0 | 1000 | $1,100 | $1.10 | 5d | 1 | 0.65mi |
| 615 Dresden Ave Louisville, KY | 3.0 | 1.0 | 884 | $1,450 | $1.64 | 25d | 1 | 0.67mi |
| 4007 Southern Pkwy Unit 1 Louisville, KY | 4.0 | 1.0 | 1500 | $1,395 | $0.93 | 5d | 1 | 0.74mi |
| 551 Denmark St Louisville, KY | 3.0 | 1.5 | 1160 | $1,700 | $1.47 | 25d | 1 | 0.79mi |
| 925 W Evelyn Ave Louisville, KY | 3.0 | 1.5 | 1520 | $1,650 | $1.09 | 25d | 1 | 0.86mi |
| 1244 Algonquin Pkwy Louisville, KY | 3.0 | 1.5 | 1136 | $1,400 | $1.23 | 25d | 1 | 1.01mi |
| 4133 S 5th St Louisville, KY | 4.0 | 1.0 | 1200 | $1,435 | $1.20 | 17d | 1 | 1.03mi |
| 910 W Whitney Ave Louisville, KY | 3.0 | 1.0 | 1186 | $1,450 | $1.22 | 3d | 1 | 1.03mi |
| 910 W Whitney Ave Louisville, KY | 3.0 | 1.0 | 1186 | $1,450 | $1.22 | 13d | 1 | 1.03mi |
| 2 Eutropia Ct Louisville, KY | 3.0 | 2.0 | 1367 | $1,950 | $1.43 | 18d | 1 | 1.08mi |
| 2125 Crittenden Dr Louisville, KY | 3.0 | 2.0 | 1450 | $1,800 | $1.24 | 18d | 1 | 1.12mi |
| 1501 Bellamy Pl Louisville, KY | 2.0–4.0 | 2.0–4.0 | 1074 | $2,676 | $2.49 | 5d | 1 | 1.22mi |
| 1522 Clara Ave Louisville, KY | 3.0 | 2.0 | 1150 | $1,150 | $1.00 | 25d | 1 | 1.24mi |
| 119 E Southern Heights Ave Louisville, KY | 3.0 | 1.0 | 1000 | $1,250 | $1.25 | 25d | 1 | 1.27mi |
| 2207 James Pirtle Ct Louisville, KY | 1.0–3.0 | 1.0–2.0 | 883 | $1,458 | $1.65 | 5d | 17 | 1.28mi |
| 414 W Hill St Louisville, KY | 3.0 | 1.5 | 1150 | $1,500 | $1.30 | 25d | 1 | 1.32mi |
| 4513 S 6th St Louisville, KY | 3.0 | 2.0 | 1581 | $2,650 | $1.68 | 25d | 1 | 1.34mi |
| 523 Rawlings St Louisville, KY | 3.0 | 1.0 | 1296 | $1,495 | $1.15 | 13d | 1 | 1.43mi |
| 216 W Burnett Ave Unit 216A Louisville, KY | 3.0 | 1.0 | 900 | $1,150 | $1.28 | 18d | 1 | 1.44mi |
| 1445 S 2nd St Unit 3 Louisville, KY | 3.0 | 1.0 | 1290 | $1,500 | $1.16 | 16d | 1 | 1.47mi |
Listing history 11 events
-
2026-06-07statusdays on market $181,000 Pending 41 DOM
-
2026-06-03days on market $181,000 Active 40 DOM
-
2026-06-02days on market $181,000 Active 39 DOM
-
2026-06-01days on market $181,000 Active 38 DOM
-
2026-05-31days on market $181,000 Active 37 DOM
-
2026-04-22$181,000 Active
-
2026-03-15historical
-
2026-02-04historical Active Under Contract
-
2025-07-13price $181,000
-
2024-12-19price $184,174
-
2024-06-27$187,933 Active
ⓘ Source: listings_history table (triggers on properties + properties_extension) + one-shot
backfill from property_details.listing_events for pre-trigger history.
Climate risk First Street
- Flood 1/10 Low FEMA zone X (unshaded) · 0% chance over 30 yrs
- Wildfire 1/10 Low
- Heat 5/10 Major 7 d/yr ≥104°F today · 20 d/yr by 30 yrs out
- Wind 2/10 Low 100% chance of damaging wind over 30 yrs
- Air quality 2/10 Low 1 unhealthy d/yr today · 3 by 30 yrs out
Nearby sold comps map
Loading sold comps map…
Walkable amenities ~0.75 mi
Loading nearby amenities…
Taxation est. · year 1
- Rental income
- $19,490
- − Mortgage interest
- −$10,139
- − Property taxes
- −$2,715
- − Insurance
- −$905
- − Repairs & maintenance
- −$1,559
- − Management
- −$1,559
- − Depreciation
- −$5,265
- Taxable loss
- −$2,653
- Est. tax savings @ 24.0%
- +$637
- After-tax cash flow
- $1,023/yr
For passive investors: Depreciation is non-cash, so a rental often shows a tax loss while cash-flowing — sheltering income. Rental losses are passive: they offset passive income freely, and up to $25,000/yr can offset ordinary (W-2) income if you actively participate and your MAGI is under $100k (phasing out to $0 by $150k); unused losses carry forward. On sale, claimed depreciation is recaptured at up to 25%, and gains may owe capital-gains tax (a 1031 exchange can defer both). Figures are a year-1 estimate at your 24.0% rate — not tax advice; consult a CPA.
Schools (NCES district)
- District
- Jefferson County
- NCES district ID
- 2102990
- Math proficiency
- 19% ▼ -17.00%
- Reading proficiency
- 35% ▼ -11.00%
- Median HH income
- $47,885
- Composite
- 23.45/100
- National rank
- #7884
- State rank
- #121 of 165 in KY
Livability — Louisville
- Score
- 63/100
- State rank
- #333
- US rank
- #15887
Category grades
Schools grade is shown separately in the Schools card above.
Census & demographics
- Census place
- Louisville, KY
- County
- Jefferson County · 790,184 people
- City population
- 769,292
- Metro
- Louisville/Jefferson County, KY-IN
- Population (ZIP)
- 15,605
- Household income
- $39,560
- Rent vs Own
- Severe rent burden
- 1136.0
Population outlook (Jefferson County) Hauer SSP2
- Today (2025)
- 823,112 people
- By 2030
- 849,343 · +3.2%
- By 2040
- 895,696 · +8.8%
- By 2050
- 933,630 · +13.4%
- By 2075
- 1,028,262 · +24.9%
- By 2100
- 1,072,675 · +30.3%
Race, ethnicity, and origin ACS 2023
- Neighborhood character
- Diverse neighborhood (Simpson 0.56)
- Race & ethnicity
- White 62% Black 22% Two or more races 9% Hispanic / Latino 6% Asian 1%
- Hispanic origin (detail)
- Mexican 4%
- Common ancestry
- Italian 3% Lithuanian 2% Slovak 2%
- Foreign-born
- 5% · Canada, China, South Korea
- Languages at home
- 90% English-only · Spanish 3% French/Haitian/Cajun 1%
Political lean MEDSL · Jefferson
- 2024 margin
- D (+16.6) · D 57.4% · R 40.9% · Other 1.7%
- 2008→2024 swing
- +4.5pp toward D · 2008: 12.0pp · 2024: 16.6pp
- All cycles
- 2024: D+16.6 2020: D+20.1 2016: D+13.3 2012: D+11.1 2008: D+12.0
Not yet ingested
- Civics
- —
Market trends
- HPI YoY
- ▼ -72.97%
- Current HPI
- 240.6261
- Rent YoY
- ▲ 6.06%
- Metro
- Louisville/Jefferson County, KY-IN
- State GDP YoY
- ▲ 1.81%
- F500 in state
- 4
Industry mix (Fortune 500 HQ in KY)
| Industry | F500 HQs | Revenue |
|---|---|---|
| Healthcare | 1 | $118B |
|
||
| Food / Beverage | 1 | $7B |
|
||
Price history
-3.7% since first listed6 events — show timeline
- 2026-04-22 Listed $181,000 Metro Search MLS
- 2026-03-15 Listing Removed — Metro Search MLS
- 2026-02-04 Contingent — Metro Search MLS
- 2025-07-13 Price Changed $181,000 Metro Search MLS
- 2024-12-19 Price Changed $184,174 Metro Search MLS
- 2024-06-27 Listed $187,933 Metro Search MLS
Cash-flow waterfall
monthlySold comps — $/sqft
last 12 mo · ≤1 miLoading sold comps…