7603 Arlo Dr · Amarillo, TX
Flood risk No data
- FEMA flood zone
- —
- Chance of flooding over 30 yrs
- —
- Est. flood insurance / yr
- —
Fire risk No data
- Est. fire insurance / yr
- —
Heat risk No data
- Hot days now (above threshold)
- —
- Hot days in 30 yrs
- —
Wind risk No data
- Chance of severe wind over 30 yrs
- —
Air-quality risk No data
- Unhealthy air days now
- —
- Unhealthy air days in 30 yrs
- —
Risk factors via First Street. Map © Google.
Why this score? — see what drove the D grade
The composite is a weighted blend of 9 inputs, each scored 0–100. Each bar is that input's sub-score; the figure is the points it added to the 100-point composite (weight × sub-score).
- Cash flow +11.1/30.0
- ARV discount +7.5/15.0
- Schools +5.0/10.0
- Rent growth +4.1/5.0
- Condition / age +4.0/5.0
- 1% rule +3.3/10.0
- Livability +3.3/5.0
- DSCR +3.2/10.0
- Appreciation +0.0/10.0
$290,000
🖨 Deal sheet (PDF) 📄 Offer letter ✓ Due diligence
Listing remarks
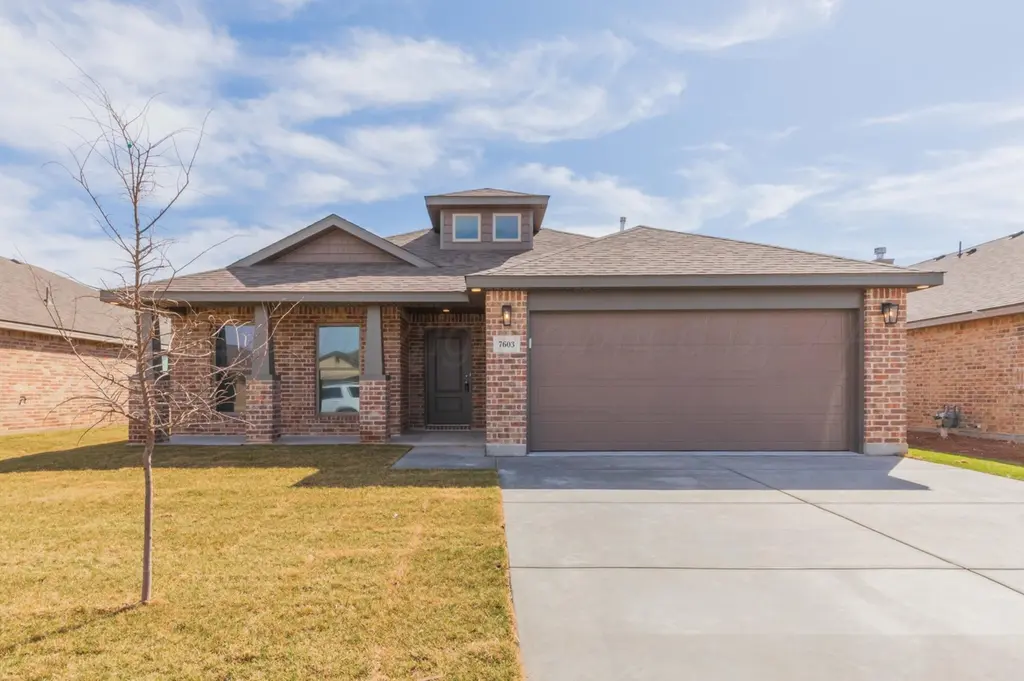
New construction by Betenbough Homes featuring 3-bedrooms, 2-bathrooms, and a 2-car garage. This home offers a functional layout with luxury vinyl plank flooring throughout for durability and easy maintenance. The kitchen includes a gas range and opens to the main living area, creating a comfortable space for daily living. A great opportunity to own a brand-new home with modern finishes and practical design.
Key facts
- 6,325 sq ft lot
- 2 garage spots
- Built 2026
Neighborhood map
What this means for you Summary
Snapshot
- This is a 3-bed/2.0-bath single-family listed at $290k. Condition is rated good.
Deal economics
- At list price, monthly cash flow is $-116 ($-1k/yr) — negative.
- To cash-flow at today's rent, offer at most $273k (5.8% below list).
- To meet the 1% rule (rent ≥ 1% of price), the offer needs to be $239k (17.4% below list).
- Recommended offer: $239k (17.4% below list) — sets the bar for 1% rule.
Location & tenants
- Location reads 66/100 on livability (#624 in TX) — a middle-class / working-renter tenant base. Strengths: cost of living A+, housing A+; Watch: amenities C-, crime F, commute F.
- Canyon ISD (town): math 60% / reading 54% proficiency, ranked #78 of 826 in TX (top 9%) — acceptable for families but not a draw, mixed tenant base, ~2y average lease.
- Zoned schools: Heritage Hills El (402 students, 31% FRL); West Plains J H (math 59% / reading 58%, grade B, #185 of 1,662 statewide, top 12%, 615 students, 33% FRL); West Plains H S (910 students, 31% FRL) — zoned schools at 32% FRL track the district average.
- Market conditions: Rents rising fast (+6.2%/yr); 477 active listings in the ZIP; 13 comparable units currently listed for rent nearby; rentals at typical pace (median 23d on market — plan ~3-4 weeks tenant-placement turnaround); high-income renter base; 45 units permitted in Randall County in 2024 (0 in 5+ unit buildings).
Forward outlook
- Local home prices are declining (-3.0%/yr); year-one equity from $2k of loan paydown is wiped out by about $9k of value loss. Plan a longer hold.
- Randall County population projected at +36% by 2050 — long-run rental-demand tailwind backs the buy-and-hold thesis.
Negotiation context
- It's been on market 18 days — a 2% lower offer ($286k) is reasonable based on typical stale-listing flexibility.
Questions for the listing agent
- What do current leases actually rent for vs. the listed asking? Can we see a recent rent roll and the last 12 months of T-12 income?
- What does the HOA fee cover, when was the last increase, and are there any pending special assessments or reserve-fund shortfalls?
- Is there a deadline driving the sale (1031 exchange, divorce, estate, relocation)? That informs how much negotiation room exists.
- Schools are D-rated, which usually means shorter tenancies and higher turnover. Who's the typical renter profile here, and what's been the actual vacancy rate?
- Crime grade is F in this area — have there been break-ins, vandalism, or insurance claims at this property in the last 3 years? What carrier currently insures it and at what premium?
- The area grade is low — what's the realistic commute time and amenity access for the typical tenant pool here? Any planned neighborhood developments (good or bad) we should know about?
- What's the average days-on-market for RENTAL listings here right now (not sales)? A rising rental-DOM trend means longer vacancies and softer asking-rent achievability than the comps imply.
- What's the recent tenant-quality profile in this submarket — average credit score on applications, eviction rate, late-payment / NSF rate, and stable-employment percentage? A property-management company in the area should have these aggregated.
- How much new for-sale + rental construction is in the pipeline within 1–3 miles? Heavy new supply typically softens prices + rents 12–24 months out; constrained supply supports both.
Investment metrics
- 1% rule
- 0.83% ✗
- Cap rate
- 5.81%
- Cash-on-cash
- -1.71%
- DSCR
- 0.92
- GRM
- 10.1
CMA / ARV
No comps found within radius.
Projected returns pro-forma
-3.0% appreciation · 6.21% rent growth · sell at horizon
- IRR
- -15.6%
- Equity multiple
- 0.43×
- Total profit
- $-46,334
- Equity at exit
- $43,240
- IRR
- -2.3%
- Equity multiple
- 0.82×
- Total profit
- $-14,683
- Equity at exit
- $25,074
Cash invested: $81,200 (down + closing). Projections, not guarantees.
Landlord ↔ Tenant lean methodology
- Overall (STATE)
- 87 Strongly Landlord-Friendly
- State Texas
- 87 Strongly Landlord-Friendly · R+5
- County
- — inherits STATE
- City
- — inherits STATE
ZIP-level market 79119
- Home prices YoY
- -19.1%
- Rents YoY
- 6.2%
- Active inventory
- 477
- Price-to-rent
- 10.1×
Monthly cashflow live
- Estimated rent
- $2,394 high interval (Pro) →
- Mortgage (P&I)
- −$1,521
- Tax est. 1.5%
- −$362 /mo · $4,350/yr
- Insurance
- −$121
- HOA
- −$3
- Vacancy / Maint / Mgmt
- −$503
- Net cashflow
- $-116
Break-even live
Sensitivity live
| Price | -10% $85 | -5% $-15 | +0% $-116 | +5% $-216 | +10% $-316 |
|---|---|---|---|---|---|
| Rent | -10% $-305 | -5% $-210 | +0% $-116 | +5% $-21 | +10% $74 |
| Rate | -1.0pp $30 | -0.5pp $-42 | base $-116 | +0.5pp $-191 | +1.0pp $-267 |
UW: 25.0% down · 7.5% · 30yr · 1.5% tax · 5.0% vac · 8.0% maint · 8.0% mgmt
Financing live
Cash to close
- Down payment
- $72,500
- Closing costs
- $8,700
- Reserves months
- —
- Total cash needed
- —
Loan-product check · same deal, 3 products live
Conventional
25% down · 7.5% · 30yr
- Down + closing
- —
- Monthly P&I
- —
- Monthly cashflow
- —
- DSCR
- —
- Eligible?
- —
Personal DTI + credit; lowest rate.
DSCR
20% down · 8.5% · 30yr
- Down + closing
- —
- Monthly P&I
- —
- Monthly cashflow
- —
- DSCR
- —
- Eligible?
- —
No personal income docs; deal must DSCR.
Hard money
10% down · 12.0% · 12mo
- Down + closing
- —
- Monthly P&I
- —
- Monthly cashflow
- —
- DSCR
- —
- Eligible?
- —
Short-term bridge; refi at stabilization.
Rent comps 13 comps
| Address | Beds | Baths | Sqft | Rent | $/sqft | DOM | Units | Dist |
|---|---|---|---|---|---|---|---|---|
| 7615 Arlo Dr Amarillo, TX | 3.0 | 2.0 | 1702 | $2,500 | $1.47 | 23d | 1 | 0.02mi |
| 7516 Beck Dr Amarillo, TX | 3.0 | 2.0 | 1600 | $2,350 | $1.47 | 23d | 1 | 0.03mi |
| 7514 Beck Dr Amarillo, TX | 3.0 | 2.0 | 1600 | $2,350 | $1.47 | 23d | 1 | 0.03mi |
| 7600 Beck Dr Amarillo, TX | 3.0 | 2.0 | 1600 | $2,350 | $1.47 | 23d | 1 | 0.03mi |
| 7602 Beck Dr Amarillo, TX | 3.0 | 2.0 | 1600 | $2,350 | $1.47 | 23d | 1 | 0.09mi |
| 7506 John Thomas St Amarillo, TX | 4.0 | 2.0 | 1732 | $3,200 | $1.85 | 15d | 1 | 0.16mi |
| 7517 John Thomas St Amarillo, TX | 3.0 | 2.0 | 1642 | $2,400 | $1.46 | 46d | 1 | 0.17mi |
| 7628 S Soncy Rd Amarillo, TX | 1.0–3.0 | 1.0–2.0 | 1105 | $1,750 | $1.58 | 15d | 3 | 0.63mi |
| 7206 Nick St Amarillo, TX | 3.0 | 2.0 | 1939 | $2,200 | $1.13 | 15d | 1 | 0.64mi |
| Mosley St Amarillo, TX | 3.0 | 2.0 | 1636 | $2,000 | $1.22 | 45d | 1 | 0.80mi |
| 6801 Mosley St Amarillo, TX | 2.0 | 2.0 | 1497 | $1,725 | $1.15 | 46d | 1 | 0.90mi |
| Time Sq Amarillo, TX | 3.0 | 2.0 | 1898 | $2,450 | $1.29 | 23d | 1 | 1.30mi |
| 9181 Town Square Blvd #1241 Amarillo, TX | 1.0–3.0 | 1.0–2.0 | 998 | $1,678 | $1.68 | 45d | 25 | 1.41mi |
HOA detail
- Monthly dues
- $3 · $36/yr
- Likely covers
- gas
Listing history 3 events
-
2026-04-08status Pending
-
2026-04-06price $290,000
-
2026-03-21$295,000 Active
ⓘ Source: listings_history table (triggers on properties + properties_extension) + one-shot
backfill from property_details.listing_events for pre-trigger history.
Nearby sold comps map
Loading sold comps map…
Walkable amenities ~0.75 mi
Loading nearby amenities…
Taxation est. · year 1
- Rental income
- $28,732
- − Mortgage interest
- −$16,245
- − Property taxes
- −$4,350
- − Insurance
- −$1,450
- − Repairs & maintenance
- −$2,299
- − Management
- −$2,299
- − HOA
- −$36
- − Depreciation
- −$8,436
- Taxable loss
- −$6,382
- Est. tax savings @ 24.0%
- +$1,532
- After-tax cash flow
- $145/yr
For passive investors: Depreciation is non-cash, so a rental often shows a tax loss while cash-flowing — sheltering income. Rental losses are passive: they offset passive income freely, and up to $25,000/yr can offset ordinary (W-2) income if you actively participate and your MAGI is under $100k (phasing out to $0 by $150k); unused losses carry forward. On sale, claimed depreciation is recaptured at up to 25%, and gains may owe capital-gains tax (a 1031 exchange can defer both). Figures are a year-1 estimate at your 24.0% rate — not tax advice; consult a CPA.
Condition & rehab AI · 12 photos
This brand-new home offers a functional layout with modern finishes and practical design, making it a great opportunity for a new homeowner or investor.
Value-add opportunities
- Both Paint interior walls and trim — Fresh paint can enhance curb appeal and interior aesthetics.
- Both Install smart home devices — Smart home devices can increase home value and appeal to tech-savvy buyers/renters.
- Both Add outdoor lighting — Outdoor lighting can improve safety and curb appeal, making the home more attractive to potential buyers/renters.
- Both Add a small garden or landscaping feature — A small garden or landscaping feature can enhance curb appeal and add value to the property.
Renovation cost estimate screening
Value-add ROI direction
- Both Paint interior walls and trim — Fresh paint can enhance curb appeal and interior aesthetics. ↑
- Both Install smart home devices — Smart home devices can increase home value and appeal to tech-savvy buyers/renters. ↑
- Both Add outdoor lighting — Outdoor lighting can improve safety and curb appeal, making the home more attractive to potential buyers/renters. ↑
- Both Add a small garden or landscaping feature — A small garden or landscaping feature can enhance curb appeal and add value to the property. ↑
ⓘ Cost ranges are severity-bucket heuristics (US national rule-of-thumb). Get contractor quotes + a written scope before underwriting a rehab budget.
Schools (NCES district)
- District
- Canyon ISD
- NCES district ID
- 4812810
- Math proficiency
- 60% ▼ -1.00%
- Reading proficiency
- 54% ▼ -1.00%
- Median HH income
- $65,177
- Composite
- 50.07/100
- National rank
- #1912
- State rank
- #78 of 826 in TX
Livability — Amarillo
- Score
- 66/100
- State rank
- #624
- US rank
- #11876
Category grades
Schools grade is shown separately in the Schools card above.
Census & demographics
- Census place
- Amarillo, TX
- County
- Randall County · 137,351 people
- City population
- 185,802
- Metro
- Amarillo, TX
- Population (ZIP)
- 24,907
- Household income
- $114,432
- Rent vs Own
- Severe rent burden
- 272.0
Population outlook (Randall County) Hauer SSP2
- Today (2025)
- 152,140 people
- By 2030
- 163,107 · +7.2%
- By 2040
- 184,999 · +21.6%
- By 2050
- 206,948 · +36.0%
- By 2075
- 260,204 · +71.0%
- By 2100
- 294,980 · +93.9%
Race, ethnicity, and origin ACS 2023
- Neighborhood character
- Predominantly White (74%)
- Race & ethnicity
- White 74% Hispanic / Latino 17% Two or more races 8% Asian 4% Black 2%
- Hispanic origin (detail)
- Mexican 13%
- Common ancestry
- Italian 4% Slovak 2% Iranian 1%
- Foreign-born
- 6% · Canada, China, Vietnam
- Languages at home
- 90% English-only · Spanish 5% Chinese 1% Other Indo-European 1%
Political lean MEDSL · Randall
- 2024 margin
- Solid R (+60.4) · D 19.4% · R 79.8%
- 2008→2024 swing
- +2.3pp toward D · 2008: -62.7pp · 2024: -60.4pp
- All cycles
- 2024: R+60.4 2020: R+58.8 2016: R+65.1 2012: R+68.2 2008: R+62.7
Not yet ingested
- Civics
- —
Market trends
- HPI YoY
- ▼ -39.08%
- Current HPI
- 165.3226
- Rent YoY
- ▲ 6.21%
- Metro
- Amarillo, TX
- State GDP YoY
- ▲ 3.95%
- F500 in state
- 110
Industry mix (Fortune 500 HQ in TX)
| Industry | F500 HQs | Revenue |
|---|---|---|
| Energy | 16 | $1,198B |
|
||
| Technology | 5 | $198B |
|
||
| Engineering / Construction | 4 | $72B |
|
||
| Energy Services | 3 | $60B |
|
||
| Utilities | 3 | $41B |
|
||
| Healthcare | 2 | $330B |
|
||
Price history
-1.7% since first listed3 events — show timeline
- 2026-04-08 Pending — AARMLS
- 2026-04-06 Price Changed $290,000 AARMLS
- 2026-03-21 Listed $295,000 AARMLS
Cash-flow waterfall
monthlySold comps — $/sqft
last 12 mo · ≤1 miLoading sold comps…