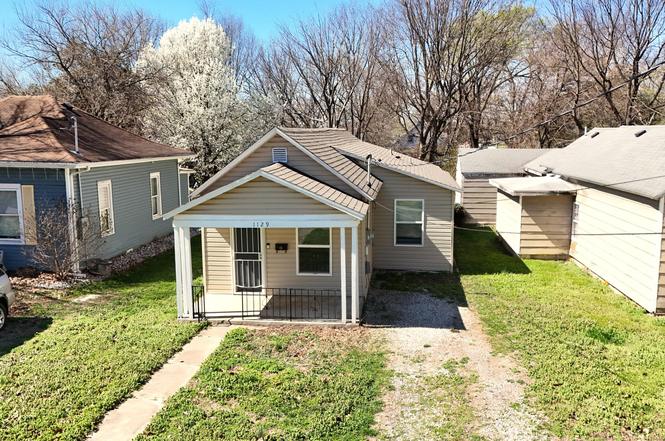
1129 N Rogers Ave · Springfield, MO
Flood risk 1/10 · Minimal
- FEMA flood zone
- X (unshaded)
- Chance of flooding over 30 yrs
- 0.0%
- Est. flood insurance / yr
- $473 – $860
Fire risk 1/10 · Minimal
- Est. fire insurance / yr
- $1,054 – $1,958
Heat risk 5/10 · Moderate
- Hot days now (above 104°F)
- 7 days/yr
- Hot days in 30 yrs
- 18 days/yr
Wind risk 2/10 · Minimal
- Chance of severe wind over 30 yrs
- —
Air-quality risk 2/10 · Minimal
- Unhealthy air days now
- 1 days/yr
- Unhealthy air days in 30 yrs
- 2 days/yr
Risk factors via First Street. Map © Google.
Why this score? — see what drove the B grade
The composite is a weighted blend of 9 inputs, each scored 0–100. Each bar is that input's sub-score; the figure is the points it added to the 100-point composite (weight × sub-score).
- Cash flow +27.1/30.0
- ARV discount +15.0/15.0
- DSCR +9.4/10.0
- 1% rule +6.5/10.0
- Livability +3.8/5.0
- Rent growth +3.7/5.0
- Schools +3.2/10.0
- Condition / age +2.5/5.0
- Appreciation +0.0/10.0
$94,900
🖨 Deal sheet 📄 Offer letter ✓ Due diligence
Listing remarks MLS
Walking distance to Evangel University and OTC! This property is an excellent opportunity for an investor looking for a turn-key rental. There is plenty of room to expand and create multiple bedrooms within. Extra large kitchen and two separate living areas as it is staged now. Recently remodeled including siding, roof, windows, flooring and a full bath. Perfect time to scoop this up with the new school year ahead!
Key facts
- Large kitchen
- 6,098 sq ft lot
- Built 1904
Tags
Neighborhood map
What this means for you Summary
Snapshot
- This is a 3-bed/1.0-bath single-family listed at $95k.
Deal economics
- At list price, monthly cash flow is $269 ($3k/yr) — positive.
- The deal already cash-flows at list — no discount required.
- Meets the 1% rule at list price ($1k rent vs $95k).
- Recommended offer: $92k (3.0% below list) — sets the bar for market timing.
- Cap rate 9.7% vs local median 4.6% in Springfield — top-decile yield for the area; either an underpriced asset or a hidden risk that comps aren't pricing in. Stress-test before assuming the spread holds.
Location & tenants
- Location reads 75/100 on livability (#57 in MO, #4,121 nationally) — a middle-class / working-renter tenant base. Strengths: commute A+, cost of living A+, housing A+; Watch: crime F, employment F.
- Springfield R-XII (urban): math 32% / reading 46% proficiency, ranked #174 of 324 in MO (top 54%) — families likely to look elsewhere, expect single-tenant / working-renter base with shorter leases.
- Zoned schools: Weller Elem. (math 17% / reading 32%, grade F, #879 of 1,115 statewide, top 81%, 297 students, 83% FRL); Central High (math 42% / reading 62%, grade D+, #92 of 521 statewide, top 20%, 1,464 students, 51% FRL) — zoned schools average 67% FRL vs 46% district-wide (21 pts higher); higher-poverty schools than district average — tighter screening recommended.
- Market conditions: Rents rising fast (+4.8%/yr); 512 active listings in the ZIP; 36 comparable units currently listed for rent nearby; rentals at typical pace (median 24d on market — plan ~3-4 weeks tenant-placement turnaround); 42% of comp listings sitting > 30 days — soft ceiling on asking rent; 1,302 units permitted in Greene County in 2024 (250 in 5+ unit buildings).
Forward outlook
- Local home prices are declining (-3.0%/yr); year-one equity from $656 of loan paydown is wiped out by about $3k of value loss. Plan a longer hold.
- Greene County population projected at +25% by 2050 — long-run rental-demand tailwind backs the buy-and-hold thesis.
- At projected returns (-3.0% appreciation + 4.8% rent growth), your $27k cash investment doubles in ~8 years — after that, you're playing with house money.
Negotiation context
- It's been on market 50 days — a 3% lower offer ($92k) is reasonable based on typical stale-listing flexibility.
- 3 sale attempts since 8y ago with the ask held roughly flat each time — persistent listings suggest the price (not the market) is what's stuck; bring a comps-based counter.
Risks & watch-outs
- Watch-outs: built in 1904 — expect roof / HVAC / electrical / plumbing capex.
- Climate carrying-cost: extreme-heat days projected 7→18/yr by 2055 (HVAC capex compounding) — expect insurance premiums to compound above CPI over the hold.
Questions for the listing agent
- It's been on market 50 days. Have you received any prior offers? Is the seller open to a 3% concession, seller financing, or rate buy-down credit?
- Built in 1904 — when were the roof, HVAC, electrical panel, plumbing, and water heater last replaced?
- Is there a deadline driving the sale (1031 exchange, divorce, estate, relocation)? That informs how much negotiation room exists.
- Crime grade is F in this area — have there been break-ins, vandalism, or insurance claims at this property in the last 3 years? What carrier currently insures it and at what premium?
- What's the average days-on-market for RENTAL listings here right now (not sales)? A rising rental-DOM trend means longer vacancies and softer asking-rent achievability than the comps imply.
- What's the recent tenant-quality profile in this submarket — average credit score on applications, eviction rate, late-payment / NSF rate, and stable-employment percentage? A property-management company in the area should have these aggregated.
- How much new for-sale + rental construction is in the pipeline within 1–3 miles? Heavy new supply typically softens prices + rents 12–24 months out; constrained supply supports both.
Investment metrics
- 1% rule
- 1.15% ✓
- Cap rate
- 9.70%
- Cash-on-cash
- 12.16%
- DSCR
- 1.54
- GRM
- 7.3
CMA / ARV
- ARV (on-the-fly)
- $131,130
- Comps found
- 12
Show comp detail 12 sales within ~0.75 mi
| Address | Dist | Beds/Ba | Sqft | Sold | Price | $/sf | Match |
|---|---|---|---|---|---|---|---|
| 1133 N Prospect Ave | 0.09mi | 2/1.0 (-1) | 972 (+4%) | 4mo | $140,000 | $144 | 80 |
| 1341 N Fremont Ave | 0.21mi | 3/2.0 | 984 (+6%) | 1mo | $121,800 | $124 | 75 |
| 1621 E Chestnut St | 0.55mi | 2/1.0 (-1) | 936 (+1%) | 6mo | $140,000 | $150 | 64 |
| 1433 E Division St | 0.40mi | 2/1.0 (-1) | 844 (-9%) | 0mo | $115,000 | $136 | 61 |
| 1627 E Central St | 0.46mi | 3/1.0 | 1,023 (+10%) | 6mo | $139,900 | $137 | 57 |
| 1601 N Rogers Ave | 0.44mi | 2/1.0 (-1) | 840 (-10%) | 3mo | $129,900 | $155 | 56 |
| 1464 N Clay Ave | 0.62mi | 2/1.0 (-1) | 968 (+4%) | 5mo | $145,000 | $150 | 55 |
| 1433 E Commercial St | 0.70mi | 2/1.0 (-1) | 1,008 (+8%) | 1mo | $124,900 | $124 | 47 |
| 1078 E Blaine St | 0.65mi | 2/1.0 (-1) | 841 (-10%) | 3mo | $109,900 | $131 | 46 |
| 1414 N Sherman Ave | 0.50mi | 2/1.0 (-1) | 806 (-13%) | 6mo | $85,000 | $105 | 44 |
| 1604 E Commercial St | 0.74mi | 3/1.0 | 1,050 (+13%) | 4mo | $157,900 | $150 | 41 |
| 1077 E Blaine St | 0.67mi | 2/2.0 (-1) | 1,060 (+14%) | 4mo | $149,000 | $141 | 33 |
Match score weights: distance 35% · size 25% · config 20% · recency 20%. Top-matched comps best support the ARV.
Projected returns pro-forma
-3.0% appreciation · 4.82% rent growth · sell at horizon
- IRR
- 3.6%
- Equity multiple
- 1.14×
- Total profit
- $3,775
- Equity at exit
- $14,150
- IRR
- 14.7%
- Equity multiple
- 2.28×
- Total profit
- $33,902
- Equity at exit
- $8,205
Cash invested: $26,572 (down + closing). Projections, not guarantees.
Landlord ↔ Tenant lean methodology
- Overall (STATE)
- 81 Strongly Landlord-Friendly
- State Missouri
- 81 Strongly Landlord-Friendly · R+10
- County
- — inherits STATE
- City
- — inherits STATE
ZIP-level market 65802
- Home prices YoY
- -31.9%
- Rents YoY
- 4.8%
- Active inventory
- 512
- Price-to-rent
- 7.3×
Monthly cashflow live
- Estimated rent
- $1,087 high interval (Pro) →
- Mortgage (P&I)
- −$498
- Tax from tax record
- −$52 /mo · $623/yr
- Insurance
- −$40
- HOA
- −$0
- Vacancy / Maint / Mgmt
- −$228
- Net cashflow
- $269
Break-even live
UW: 25.0% down · 7.5% · 30yr · 1.5% tax · 5.0% vac · 8.0% maint · 8.0% mgmt
Financing live
Cash to close
- Down payment
- $23,725
- Closing costs
- $2,847
- Reserves months
- —
- Total cash needed
- —
Loan-product check · same deal, 3 products live
Conventional
25% down · 7.5% · 30yr
- Down + closing
- —
- Monthly P&I
- —
- Monthly cashflow
- —
- DSCR
- —
- Eligible?
- —
Personal DTI + credit; lowest rate.
DSCR
20% down · 8.5% · 30yr
- Down + closing
- —
- Monthly P&I
- —
- Monthly cashflow
- —
- DSCR
- —
- Eligible?
- —
No personal income docs; deal must DSCR.
Hard money
10% down · 12.0% · 12mo
- Down + closing
- —
- Monthly P&I
- —
- Monthly cashflow
- —
- DSCR
- —
- Eligible?
- —
Short-term bridge; refi at stabilization.
Rent comps 36 comps
| Address | Beds | Baths | Sqft | Rent | $/sqft | DOM | Units | Dist |
|---|---|---|---|---|---|---|---|---|
| 1306 N Frisco Ave Apt A Springfield, MO | 2.0 | 1.5–2.0 | 970 | $995 | $1.03 | 14d | 19 | 0.31mi |
| 1529 N Weller Ave Springfield, MO | 2.0 | 1.0 | 870 | $995 | $1.14 | 23d | 1 | 0.46mi |
| 1112 E Locust St Springfield, MO | 2.0 | 1.0 | 840 | $945 | $1.12 | 23d | 1 | 0.46mi |
| 1636 N National Ave Springfield, MO | 3.0 | 1.5 | 1000 | $995 | $0.99 | 44d | 1 | 0.52mi |
| 1501 E Blaine St Springfield, MO | 2.0 | 1.0 | 958 | $695 | $0.73 | 23d | 1 | 0.66mi |
| 716 E Locust St Unit A Springfield, MO | 2.0 | 1.0 | 915 | $850 | $0.93 | 23d | 1 | 0.70mi |
| 1409 N Washington Ave Springfield, MO | 2.0 | 1.0 | 839 | $1,405 | $1.67 | 14d | 2 | 0.75mi |
| 1710 E Commercial St Unit B Springfield, MO | 2.0 | 1.0 | 950 | $775 | $0.82 | 44d | 1 | 0.84mi |
| 2054 N Rogers Ave Springfield, MO | 2.0 | 1.0 | 888 | $925 | $1.04 | 14d | 1 | 0.96mi |
| 805 E Garfield St Springfield, MO | 2.0 | 1.0 | 950 | $950 | $1.00 | 14d | 1 | 1.03mi |
| 1530 N Robberson Ave Springfield, MO | 3.0 | 2.0 | 1122 | $1,425 | $1.27 | 44d | 1 | 1.04mi |
| 1138 E Walnut St Unit 3 Springfield, MO | 2.0 | 1.0 | 600 | $940 | $1.57 | 44d | 1 | 1.04mi |
| 1333 E Elm St Springfield, MO | 1.0–2.0 | 1.0 | 830 | $980 | $1.18 | 44d | 1 | 1.07mi |
| 1147 E Elm St Unit 3 Springfield, MO | 2.0 | 1.0 | 780 | $975 | $1.25 | 14d | 1 | 1.09mi |
| 1435 E Elm St Springfield, MO | 2.0 | 1.0 | 702 | $995 | $1.42 | 23d | 1 | 1.09mi |
| 926 E Walnut St Unit 11 Springfield, MO | 2.0 | 2.0 | 990 | $1,075 | $1.09 | 44d | 1 | 1.11mi |
| 2034 N Washington Ave Springfield, MO | 2.0 | 1.0 | 800 | $875 | $1.09 | 44d | 1 | 1.14mi |
| 937 E Elm St Unit 07 Springfield, MO | 2.0 | 1.0 | 893 | $1,025 | $1.15 | 44d | 1 | 1.15mi |
| 317 E Chase St Springfield, MO | 2.0 | 2.0 | 915 | $1,100 | $1.20 | 44d | 1 | 1.18mi |
| 1210 E Cherry St Springfield, MO | 2.0 | 2.0 | 750 | $800 | $1.07 | 44d | 1 | 1.23mi |
| 203 W Commercial St Unit 2F Springfield, MO | 2.0 | 1.0 | 1000 | $1,150 | $1.15 | 21d | 1 | 1.23mi |
| 1447 E Oakwood Ln Springfield, MO | 2.0 | 2.0 | 982 | $1,395 | $1.42 | 44d | 1 | 1.24mi |
| 2313 N Rogers Ave Unit 1 Springfield, MO | 2.0 | 2.0 | 882 | $950 | $1.08 | 14d | 1 | 1.26mi |
| 2337 N Delaware Ave Springfield, MO | 2.0 | 1.0 | 876 | $1,195 | $1.36 | 44d | 1 | 1.30mi |
| 2337 N Ramsey Ave Springfield, MO | 2.0 | 1.0 | 882 | $875 | $0.99 | 14d | 1 | 1.30mi |
| 2345 N Prospect Ave Springfield, MO | 2.0 | 1.0 | 792 | $850 | $1.07 | 14d | 1 | 1.31mi |
| 407 E Dale St Apt B Springfield, MO | 2.0 | 1.0 | 720 | $795 | $1.10 | 14d | 1 | 1.31mi |
| 309 S Jefferson Ave Unit 211 Springfield, MO | 2.0 | 2.0 | 762 | $767 | $1.01 | 44d | 1 | 1.32mi |
| 138 Park Central Sq Springfield, MO | 1.0–2.0 | 1.0–2.0 | 1083 | $2,489 | $2.30 | 14d | 8 | 1.36mi |
| 603 W Division St Springfield, MO | 2.0 | 1.0 | 816 | $995 | $1.22 | 14d | 1 | 1.37mi |
| 647 W Central St Springfield, MO | 3.0 | 1.0 | 882 | $1,050 | $1.19 | 23d | 1 | 1.40mi |
| 815 N Grant Ave Unit A Springfield, MO | 2.0 | 1.0 | 801 | $625 | $0.78 | 44d | 1 | 1.45mi |
| 726 S Kentwood Ave Springfield, MO | 2.0 | 1.0 | 1116 | $1,295 | $1.16 | 14d | 1 | 1.47mi |
| 2154 E Cairo St Springfield, MO | 3.0 | 2.0 | 1100 | $1,395 | $1.27 | 44d | 1 | 1.47mi |
| 235 N Market Ave Springfield, MO | 1.0–4.0 | 1.0–2.0 | 1350 | $1,383 | $1.02 | 14d | 4 | 1.48mi |
| 235 N Market Ave Springfield, MO | 1.0–4.0 | 1.0–2.0 | 1350 | $1,383 | $1.02 | 23d | 5 | 1.48mi |
Listing history 10 events
-
2026-04-22status Pending
-
2026-04-15price $94,900
-
2026-03-03$99,000 Active
-
2022-12-27soldstatus
-
2021-08-09soldstatus
-
2021-08-06soldstatus 418-char remark
Show marketing remark (418 chars)
Walking distance to Evangel University and OTC! This property is an excellent opportunity for an investor looking for a turn-key rental. There is plenty of room to expand and create multiple bedrooms within. Extra large kitchen and two separate living areas as it is staged now. Recently remodeled including siding, roof, windows, flooring and a full bath. Perfect time to scoop this up with the new school year ahead!
-
2021-07-17$74,900 418-char remark
Show marketing remark (418 chars)
Walking distance to Evangel University and OTC! This property is an excellent opportunity for an investor looking for a turn-key rental. There is plenty of room to expand and create multiple bedrooms within. Extra large kitchen and two separate living areas as it is staged now. Recently remodeled including siding, roof, windows, flooring and a full bath. Perfect time to scoop this up with the new school year ahead!
-
2019-06-05soldstatus
-
2019-06-04soldstatus 333-char remark
Show marketing remark (333 chars)
Price reduction. Investment opportunity; rental or fix and flip. Shot gun style floor plan. One bedroom with closet could be two additional non conforming bedrooms, now two living areas plus out building, Alley access. Very large kitchen. No utilities will be turned for inspections. Closing to be at Hogan Land Title on Republic Rd.
-
2018-11-16$17,900 333-char remark
Show marketing remark (333 chars)
Price reduction. Investment opportunity; rental or fix and flip. Shot gun style floor plan. One bedroom with closet could be two additional non conforming bedrooms, now two living areas plus out building, Alley access. Very large kitchen. No utilities will be turned for inspections. Closing to be at Hogan Land Title on Republic Rd.
ⓘ Source: listings_history table (triggers on properties + properties_extension) + one-shot
backfill from property_details.listing_events for pre-trigger history.
Tax reassessment forecast MO · Resets to sale price
- Current annual tax
- $623 · $52/mo
- Projected year-2 tax
- $921 · $77/mo
- Expected delta
- +$297/yr (+$25/mo · 47.7%)
ⓘ Screening estimate from a state-policy table — verify with the county assessor before closing.
Climate risk First Street
- Flood 1/10 Low FEMA zone X (unshaded) · 0% chance over 30 yrs
- Wildfire 1/10 Low
- Heat 5/10 Major 7 d/yr ≥104°F today · 18 d/yr by 30 yrs out
- Wind 2/10 Low
- Air quality 2/10 Low 1 unhealthy d/yr today · 2 by 30 yrs out
Nearby sold comps map
Loading sold comps map…
Walkable amenities ~0.75 mi
Loading nearby amenities…
Taxation est. · year 1
- Rental income
- $13,040
- − Mortgage interest
- −$5,316
- − Property taxes
- −$623
- − Insurance
- −$474
- − Repairs & maintenance
- −$1,043
- − Management
- −$1,043
- − Depreciation
- −$2,761
- Taxable income
- $1,779
- Est. tax owed @ 24.0%
- −$427
- After-tax cash flow
- $2,805/yr
For passive investors: Depreciation is non-cash, so a rental often shows a tax loss while cash-flowing — sheltering income. Rental losses are passive: they offset passive income freely, and up to $25,000/yr can offset ordinary (W-2) income if you actively participate and your MAGI is under $100k (phasing out to $0 by $150k); unused losses carry forward. On sale, claimed depreciation is recaptured at up to 25%, and gains may owe capital-gains tax (a 1031 exchange can defer both). Figures are a year-1 estimate at your 24.0% rate — not tax advice; consult a CPA.
Schools (NCES district)
- District
- Springfield R-XII
- NCES district ID
- 2928860
- Math proficiency
- 32% ▼ -2.00%
- Reading proficiency
- 46% ▼ -3.00%
- Median HH income
- $37,886
- Composite
- 32.45/100
- National rank
- #5717
- State rank
- #174 of 324 in MO
Livability — Springfield
- Score
- 75/100
- State rank
- #57
- US rank
- #4121
Category grades
Schools grade is shown separately in the Schools card above.
Census & demographics
- Census place
- Springfield, MO
- County
- Greene County · 244,327 people
- City population
- 223,044
- Metro
- Springfield, MO
- Population (ZIP)
- 46,739
- Household income
- $55,019
- Rent vs Own
- Severe rent burden
- 1818.0
Population outlook (Greene County) Hauer SSP2
- Today (2025)
- 319,054 people
- By 2030
- 335,135 · +5.0%
- By 2040
- 366,186 · +14.8%
- By 2050
- 397,431 · +24.6%
- By 2075
- 477,035 · +49.5%
- By 2100
- 520,828 · +63.2%
Race, ethnicity, and origin ACS 2023
- Neighborhood character
- Predominantly White (81%)
- Race & ethnicity
- White 81% Two or more races 8% Hispanic / Latino 5% Black 4% Asian 2%
- Common ancestry
- Slovak 2% Lithuanian 2% Italian 2%
- Foreign-born
- 3% · Canada, Vietnam
- Languages at home
- 95% English-only · Spanish 2% Vietnamese 1% Other Indo-European 1%
Political lean MEDSL · Greene
- 2024 margin
- Strong R (+20.8) · D 38.9% · R 59.7% · Other 1.4%
- 2008→2024 swing
- -5.0pp toward R · 2008: -15.8pp · 2024: -20.8pp
- All cycles
- 2024: R+20.8 2020: R+20.1 2016: R+27.4 2012: R+24.4 2008: R+15.8
Not yet ingested
- Civics
- —
Market trends
- HPI YoY
- ▼ -99.72%
- Current HPI
- 212.9826
- Rent YoY
- ▲ 4.82%
- Metro
- Springfield, MO
- State GDP YoY
- ▲ 1.84%
- F500 in state
- 20
Industry mix (Fortune 500 HQ in MO)
| Industry | F500 HQs | Revenue |
|---|---|---|
| Healthcare | 1 | $163B |
|
||
| Insurance | 1 | $21B |
|
||
| Industrial Technology | 1 | $17B |
|
||
| Retail | 1 | $16B |
|
||
| Industrial Distribution | 1 | $10B |
|
||
| Utilities | 1 | $9B |
|
||
Price history
+430.2% since first listed10 events — show timeline
- 2026-04-22 Pending — SOMO
- 2026-04-15 Price Changed $94,900 SOMO
- 2026-03-03 Listed $99,000 SOMO
- 2022-12-27 Sold (Public Records) — Public Records
- 2021-08-09 Sold (Public Records) — Public Records
- 2021-08-06 Sold (MLS) — SOMO
- 2021-07-17 Listed $74,900 SOMO
- 2019-06-05 Sold (Public Records) — Public Records
- 2019-06-04 Sold (MLS) — SOMO
- 2018-11-16 Listed $17,900 SOMO
Property tax history
+10.8%/yrLatest (2025): $623 · +148.7% YoY. Source: county tax records.
Cash-flow waterfall
monthlySold comps — $/sqft
last 12 mo · ≤1 miLoading sold comps…