 🏗️ New Construction
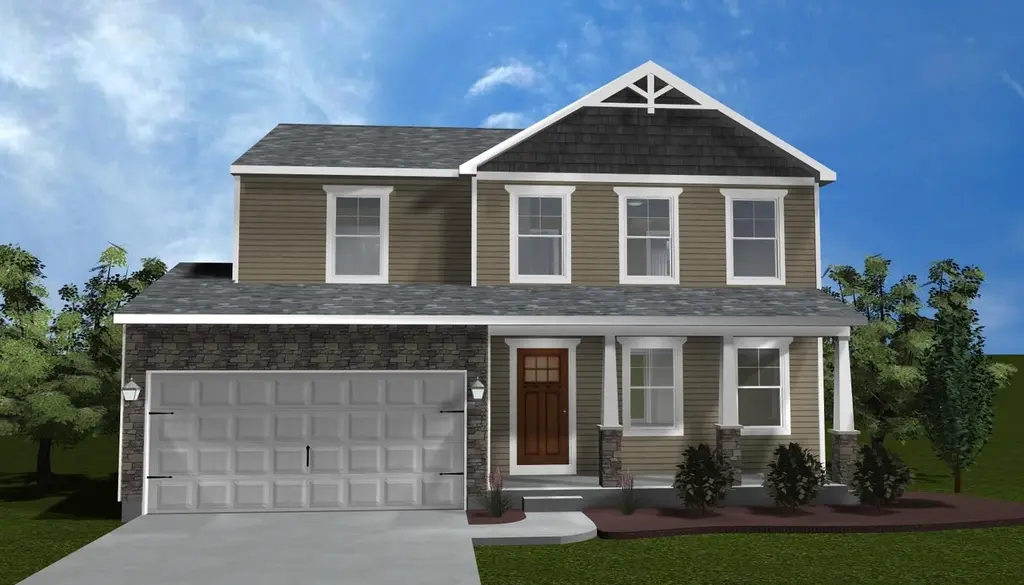
Portland - Build on Your Lot Plan · Lebanon, OH
Flood risk 1/10 · Minimal
- FEMA flood zone
- X (unshaded)
- Chance of flooding over 30 yrs
- 0.0%
- Est. flood insurance / yr
- $473 – $860
Fire risk 1/10 · Minimal
- Est. fire insurance / yr
- $713 – $1,323
Heat risk 4/10 · Minor
- Hot days now (above 101°F)
- 7 days/yr
- Hot days in 30 yrs
- 19 days/yr
Wind risk 2/10 · Minimal
- Chance of severe wind over 30 yrs
- 1.0%
Air-quality risk 3/10 · Minor
- Unhealthy air days now
- 2 days/yr
- Unhealthy air days in 30 yrs
- 3 days/yr
Risk factors via First Street. Map © Google.
Why this score? — see what drove the D- grade
The composite is a weighted blend of 9 inputs, each scored 0–100. Each bar is that input's sub-score; the figure is the points it added to the 100-point composite (weight × sub-score).
- ARV discount +7.5/15.0
- Cash flow +6.9/30.0
- Schools +5.9/10.0
- Condition / age +4.8/5.0
- Rent growth +4.6/5.0
- Livability +3.5/5.0
- 1% rule +1.8/10.0
- DSCR +1.1/10.0
- Appreciation +0.0/10.0
$265,000
🖨 Deal sheet (PDF) 📄 Offer letter ✓ Due diligence
Listing remarks MLS
The Portland features an open first floorplan, 3 bedrooms, and 2-1/2 Baths
Key facts
- 2-1/2 baths
- 3 bedrooms
- Open first floorplan
Tags
Neighborhood map
What this means for you Summary
Snapshot
- This is a 3-bed/2.5-bath single-family listed at $265k. Condition is rated excellent.
Deal economics
- At list price, monthly cash flow is $-531 ($-6k/yr) — negative.
- The deal already cash-flows at list — no discount required.
- To meet the 1% rule (rent ≥ 1% of price), the offer needs to be $239k (9.7% below list).
- Recommended offer: $233k (12.0% below list) — sets the bar for market timing.
- Cap rate 4.5% vs local median 2.7% in Lebanon — top-decile yield for the area; either an underpriced asset or a hidden risk that comps aren't pricing in. Stress-test before assuming the spread holds.
Location & tenants
- Location reads 70/100 on livability (#457 in OH) — a middle-class / working-renter tenant base. Strengths: cost of living A+, housing A+, crime A; Watch: amenities F, commute F, health & safety F.
- Lebanon City (suburban): math 67% / reading 69% proficiency, ranked #151 of 656 in OH (top 23%) — acceptable for families but not a draw, mixed tenant base, ~2y average lease.
- Zoned schools: Bowman Primary School (1,203 students, 24% FRL); Lebanon Junior High (math 67% / reading 72%, grade A, #143 of 654 statewide, top 23%, 878 students, 24% FRL); Lebanon High School (math 52% / reading 68%, grade C+, #239 of 781 statewide, top 31%, 1,628 students, 17% FRL) — zoned schools at 22% FRL track the district average.
- Market conditions: Rents rising fast (+8.3%/yr); 289 active listings in the ZIP; 3 comparable units currently listed for rent nearby; rentals leasing fast (median 3d on market — plan ~1-2 weeks tenant-placement turnaround); solid renter incomes; 1,224 units permitted in Warren County in 2024 (474 in 5+ unit buildings).
Forward outlook
- Local home prices are declining (-3.0%/yr); year-one equity from $2k of loan paydown is wiped out by about $11k of value loss. Plan a longer hold.
- Warren County population projected at +16% by 2050 — long-run rental-demand tailwind backs the buy-and-hold thesis.
Negotiation context
- It's been on market 734 days — a 12% lower offer ($233k) is reasonable based on typical stale-listing flexibility.
Questions for the listing agent
- What do current leases actually rent for vs. the listed asking? Can we see a recent rent roll and the last 12 months of T-12 income?
- It's been on market 734 days. Have you received any prior offers? Is the seller open to a 12% concession, seller financing, or rate buy-down credit?
- Why hasn't it sold? Are there any deal-killer items the seller is aware of (foundation, flood, title, zoning, code violations)?
- Is there a deadline driving the sale (1031 exchange, divorce, estate, relocation)? That informs how much negotiation room exists.
- Schools are B-rated — typically a magnet for longer-tenancy family renters. What's the average tenant stay here, and is there a school-zone premium baked into asking?
- The area grade is low — what's the realistic commute time and amenity access for the typical tenant pool here? Any planned neighborhood developments (good or bad) we should know about?
- What's the average days-on-market for RENTAL listings here right now (not sales)? A rising rental-DOM trend means longer vacancies and softer asking-rent achievability than the comps imply.
- What's the recent tenant-quality profile in this submarket — average credit score on applications, eviction rate, late-payment / NSF rate, and stable-employment percentage? A property-management company in the area should have these aggregated.
- How much new for-sale + rental construction is in the pipeline within 1–3 miles? Heavy new supply typically softens prices + rents 12–24 months out; constrained supply supports both.
Investment metrics
- 1% rule
- 0.68% ✗
- Cap rate
- 4.47%
- Cash-on-cash
- -6.50%
- DSCR
- 0.71
- GRM
- 12.2
CMA / ARV
- ARV (median comp)
- $350,524
- List price
- $265,000
- Delta
- -24.40%
- Verdict
- UNDERPRICED
- Comps
- 20 within 1.0 mi
Show comp detail 12 sales within ~0.75 mi
| Address | Dist | Beds/Ba | Sqft | Sold | Price | $/sf | Match |
|---|---|---|---|---|---|---|---|
| 1200 Bugle Bluff Ct | 0.20mi | 3/2.5 | 1,820 (+3%) | 3mo | $300,000 | $165 | 83 |
| 1644 Cantebury Ln | 0.17mi | 3/2.5 | 1,800 (+2%) | 8mo | $363,000 | $202 | 82 |
| 270 Ludlow Ct | 0.25mi | 3/2.5 | 1,656 (-6%) | 1mo | $380,000 | $229 | 78 |
| 513 Heritage Trce | 0.28mi | 3/3.0 | 1,725 (-2%) | 5mo | $310,000 | $180 | 78 |
| 274 Birmingham Ct | 0.18mi | 3/2.5 | 1,632 (-7%) | 6mo | $373,500 | $229 | 74 |
| 1136 Reveres Run | 0.12mi | 4/2.5 (+1) | 1,920 (+9%) | 1mo | $353,000 | $184 | 74 |
| 1536 Barrington Ct | 0.46mi | 3/2.5 | 1,782 (+1%) | 4mo | $359,000 | $201 | 73 |
| 1542 Barrington Ct | 0.44mi | 3/2.5 | 1,680 (-4%) | 0mo | $349,000 | $208 | 72 |
| 1130 Silversmith Way | 0.14mi | 3/2.0 | 1,937 (+10%) | 7mo | $382,000 | $197 | 69 |
| 456 N Church Dr | 0.24mi | 3/2.0 | 1,567 (-11%) | 1mo | $380,000 | $243 | 68 |
| 291 Portland Blvd | 0.35mi | 3/2.5 | 1,936 (+10%) | 4mo | $330,000 | $170 | 64 |
| 901 Katherine Ave | 0.67mi | 4/2.0 (+1) | 1,508 (-14%) | 8mo | $285,000 | $189 | 31 |
Match score weights: distance 35% · size 25% · config 20% · recency 20%. Top-matched comps best support the ARV.
Projected returns pro-forma
-3.0% appreciation · 8.0% rent growth · sell at horizon
- IRR
- -22.1%
- Equity multiple
- 0.21×
- Total profit
- $-77,966
- Equity at exit
- $52,264
- IRR
- -7.1%
- Equity multiple
- 0.45×
- Total profit
- $-53,760
- Equity at exit
- $30,307
Cash invested: $98,147 (down + closing). Projections, not guarantees.
Landlord ↔ Tenant lean methodology
- Overall (STATE)
- 73 Landlord-Friendly
- State Ohio
- 73 Landlord-Friendly · R+6
- County
- — inherits STATE
- City
- — inherits STATE
ZIP-level market 45036
- Rents YoY
- 8.3%
- Active inventory
- 289
- Price-to-rent
- 9.2×
Monthly cashflow live
- Estimated rent
- $2,394 medium interval (Pro) →
- Mortgage (P&I)
- −$1,838
- Tax est. 1.5%
- −$438 /mo · $5,258/yr
- Insurance
- −$146
- HOA
- −$0
- Vacancy / Maint / Mgmt
- −$503
- Net cashflow
- $-531
Break-even live
Sensitivity live
| Price | -10% $-289 | -5% $-410 | +0% $-531 | +5% $-653 | +10% $-774 |
|---|---|---|---|---|---|
| Rent | -10% $-721 | -5% $-626 | +0% $-531 | +5% $-437 | +10% $-342 |
| Rate | -1.0pp $-355 | -0.5pp $-442 | base $-531 | +0.5pp $-622 | +1.0pp $-715 |
UW: 25.0% down · 7.5% · 30yr · 1.5% tax · 5.0% vac · 8.0% maint · 8.0% mgmt
Financing live
Cash to close
- Down payment
- $87,631
- Closing costs
- $10,516
- Reserves months
- —
- Total cash needed
- —
Loan-product check · same deal, 3 products live
Conventional
25% down · 7.5% · 30yr
- Down + closing
- —
- Monthly P&I
- —
- Monthly cashflow
- —
- DSCR
- —
- Eligible?
- —
Personal DTI + credit; lowest rate.
DSCR
20% down · 8.5% · 30yr
- Down + closing
- —
- Monthly P&I
- —
- Monthly cashflow
- —
- DSCR
- —
- Eligible?
- —
No personal income docs; deal must DSCR.
Hard money
10% down · 12.0% · 12mo
- Down + closing
- —
- Monthly P&I
- —
- Monthly cashflow
- —
- DSCR
- —
- Eligible?
- —
Short-term bridge; refi at stabilization.
Rent comps 3 comps
| Address | Beds | Baths | Sqft | Rent | $/sqft | DOM | Units | Dist |
|---|---|---|---|---|---|---|---|---|
| 1200 Bugle Bluff Ct Lebanon, OH | 3.0 | 2.5 | 1820 | $2,500 | $1.37 | 3d | 1 | 0.19mi |
| 1616 Hastings Ct Lebanon, OH | 3.0 | 2.5 | 1760 | $1,966 | $1.12 | 3d | 1 | 0.33mi |
| 935 Grandstone Ct Lebanon, OH | 4.0 | 2.5 | 2150 | $2,516 | $1.17 | 45d | 1 | 0.86mi |
Listing history 15 events
-
2026-06-21days on market $265,000 Active 734 DOM
-
2026-06-18days on market $265,000 Active 731 DOM
-
2026-06-17days on market $265,000 Active 730 DOM
-
2026-06-16days on market $265,000 Active 729 DOM
-
2026-06-15days on market $265,000 Active 728 DOM
-
2026-06-13days on market $265,000 Active 726 DOM
-
2026-06-13days on market $265,000 Active 725 DOM
-
2026-06-09days on market $265,000 Active 722 DOM
-
2026-06-08days on market $265,000 Active 721 DOM
-
2026-06-07days on market $265,000 Active 720 DOM
-
2026-06-03days on market $265,000 Active 716 DOM
-
2026-06-02days on market $265,000 Active 715 DOM
-
2026-06-01days on market $265,000 Active 714 DOM
-
2026-05-31days on market $265,000 Active 713 DOM
-
2024-06-18$265,000 Active 74-char remark
Show marketing remark (74 chars)
The Portland features an open first floorplan, 3 bedrooms, and 2-1/2 Baths
ⓘ Source: listings_history table (triggers on properties + properties_extension) + one-shot
backfill from property_details.listing_events for pre-trigger history.
Climate risk First Street
- Flood 1/10 Low FEMA zone X (unshaded) · 0% chance over 30 yrs
- Wildfire 1/10 Low
- Heat 4/10 Moderate 7 d/yr ≥101°F today · 19 d/yr by 30 yrs out
- Wind 2/10 Low 100% chance of damaging wind over 30 yrs
- Air quality 3/10 Moderate 2 unhealthy d/yr today · 3 by 30 yrs out
Nearby sold comps map
Loading sold comps map…
Walkable amenities ~0.75 mi
Loading nearby amenities…
Taxation est. · year 1
- Rental income
- $28,723
- − Mortgage interest
- −$19,635
- − Property taxes
- −$5,258
- − Insurance
- −$1,753
- − Repairs & maintenance
- −$2,298
- − Management
- −$2,298
- − Depreciation
- −$10,197
- Taxable loss
- −$12,715
- Est. tax savings @ 24.0%
- +$3,052
- After-tax cash flow
- $-3,326/yr
For passive investors: Depreciation is non-cash, so a rental often shows a tax loss while cash-flowing — sheltering income. Rental losses are passive: they offset passive income freely, and up to $25,000/yr can offset ordinary (W-2) income if you actively participate and your MAGI is under $100k (phasing out to $0 by $150k); unused losses carry forward. On sale, claimed depreciation is recaptured at up to 25%, and gains may owe capital-gains tax (a 1031 exchange can defer both). Figures are a year-1 estimate at your 24.0% rate — not tax advice; consult a CPA.
Condition & rehab AI · 1 photo
This single-family home is in excellent condition with no visible repairs or maintenance needed. It offers a good investment opportunity with potential for minor updates to enhance its resale and rental value.
Value-add opportunities
- Both Painting exterior and interior — Enhances curb appeal and interior aesthetics
- Both Landscaping improvements — Enhances curb appeal and adds value
- Both New flooring in bathrooms — Improves aesthetics and functionality
- Both New kitchen appliances — Enhances functionality and appeal
Renovation cost estimate screening
Value-add ROI direction
- Both Painting exterior and interior — Enhances curb appeal and interior aesthetics ↑
- Both Landscaping improvements — Enhances curb appeal and adds value ↑
- Both New flooring in bathrooms — Improves aesthetics and functionality ↑
- Both New kitchen appliances — Enhances functionality and appeal ↑
ⓘ Cost ranges are severity-bucket heuristics (US national rule-of-thumb). Get contractor quotes + a written scope before underwriting a rehab budget.
Schools (NCES district)
- District
- Lebanon City
- NCES district ID
- 3904421
- Math proficiency
- 67% ▼ -2.00%
- Reading proficiency
- 69% ▼ -3.00%
- Median HH income
- $66,118
- Composite
- 59.25/100
- National rank
- #936
- State rank
- #151 of 656 in OH
Livability — Lebanon
- Score
- 70/100
- State rank
- #457
- US rank
- #7561
Category grades
Schools grade is shown separately in the Schools card above.
Census & demographics
- Census place
- Lebanon, OH
- County
- Warren County · 196,906 people
- City population
- 42,204
- Metro
- Cincinnati, OH-KY-IN
- Population (ZIP)
- 42,204
- Household income
- $99,128
- Rent vs Own
- Severe rent burden
- 904.0
Population outlook (Warren County) Hauer SSP2
- Today (2025)
- 248,603 people
- By 2030
- 259,345 · +4.3%
- By 2040
- 277,666 · +11.7%
- By 2050
- 289,599 · +16.5%
- By 2075
- 311,681 · +25.4%
- By 2100
- 302,738 · +21.8%
Race, ethnicity, and origin ACS 2023
- Neighborhood character
- Predominantly White (84%)
- Race & ethnicity
- White 84% Black 8% Two or more races 3% Asian 3% Hispanic / Latino 2%
- Common ancestry
- Slovak 2% Romanian 2% Italian 2%
- Foreign-born
- 3% · Canada
- Languages at home
- 97% English-only · Spanish 1% Other Asian/Pacific 1% Other Indo-European 1%
Political lean MEDSL · Warren
- 2024 margin
- Solid R (+31.5) · D 33.8% · R 65.3%
- 2008→2024 swing
- +4.5pp toward D · 2008: -36.1pp · 2024: -31.5pp
- All cycles
- 2024: R+31.5 2020: R+30.8 2016: R+37.6 2012: R+39.5 2008: R+36.1
Not yet ingested
- Civics
- —
Market trends
- HPI YoY
- ▼ -165.95%
- Current HPI
- 239.4833
- Rent YoY
- ▲ 8.33%
- Metro
- Cincinnati, OH-KY-IN
- State GDP YoY
- ▲ 1.98%
- F500 in state
- 48
Industry mix (Fortune 500 HQ in OH)
| Industry | F500 HQs | Revenue |
|---|---|---|
| Insurance | 3 | $145B |
|
||
| Industrial Machinery | 3 | $49B |
|
||
| Financial Services | 3 | $24B |
|
||
| Consumer Goods | 2 | $93B |
|
||
| Aerospace / Defense | 2 | $47B |
|
||
| Utilities | 2 | $33B |
|
||
Price history
1 event — show timeline
- 2024-06-18 Listed $265,000 Zillow
Cash-flow waterfall
monthlySold comps — $/sqft
last 12 mo · ≤1 miLoading sold comps…