257 Robin Ln · Shell Knob, MO
Flood risk 1/10 · Minimal
- FEMA flood zone
- X (unshaded)
- Chance of flooding over 30 yrs
- 0.0%
- Est. flood insurance / yr
- $507 – $1,088
Fire risk 3/10 · Minor
- Est. fire insurance / yr
- $1,054 – $1,958
Heat risk 4/10 · Minor
- Hot days now (above 105°F)
- 7 days/yr
- Hot days in 30 yrs
- 20 days/yr
Wind risk 2/10 · Minimal
- Chance of severe wind over 30 yrs
- 1.0%
Air-quality risk 2/10 · Minimal
- Unhealthy air days now
- 0 days/yr
- Unhealthy air days in 30 yrs
- 1 days/yr
Risk factors via First Street. Map © Google.
Why this score? — see what drove the B grade
The composite is a weighted blend of 9 inputs, each scored 0–100. Each bar is that input's sub-score; the figure is the points it added to the 100-point composite (weight × sub-score).
- Cash flow +30.0/30.0
- 1% rule +10.0/10.0
- DSCR +10.0/10.0
- ARV discount +7.5/15.0
- Schools +3.7/10.0
- Livability +3.3/5.0
- Rent growth +2.5/5.0
- Condition / age +2.5/5.0
- Appreciation +1.7/10.0
$28,000
🖨 Deal sheet (PDF) 📄 Offer letter ✓ Due diligence
Listing remarks
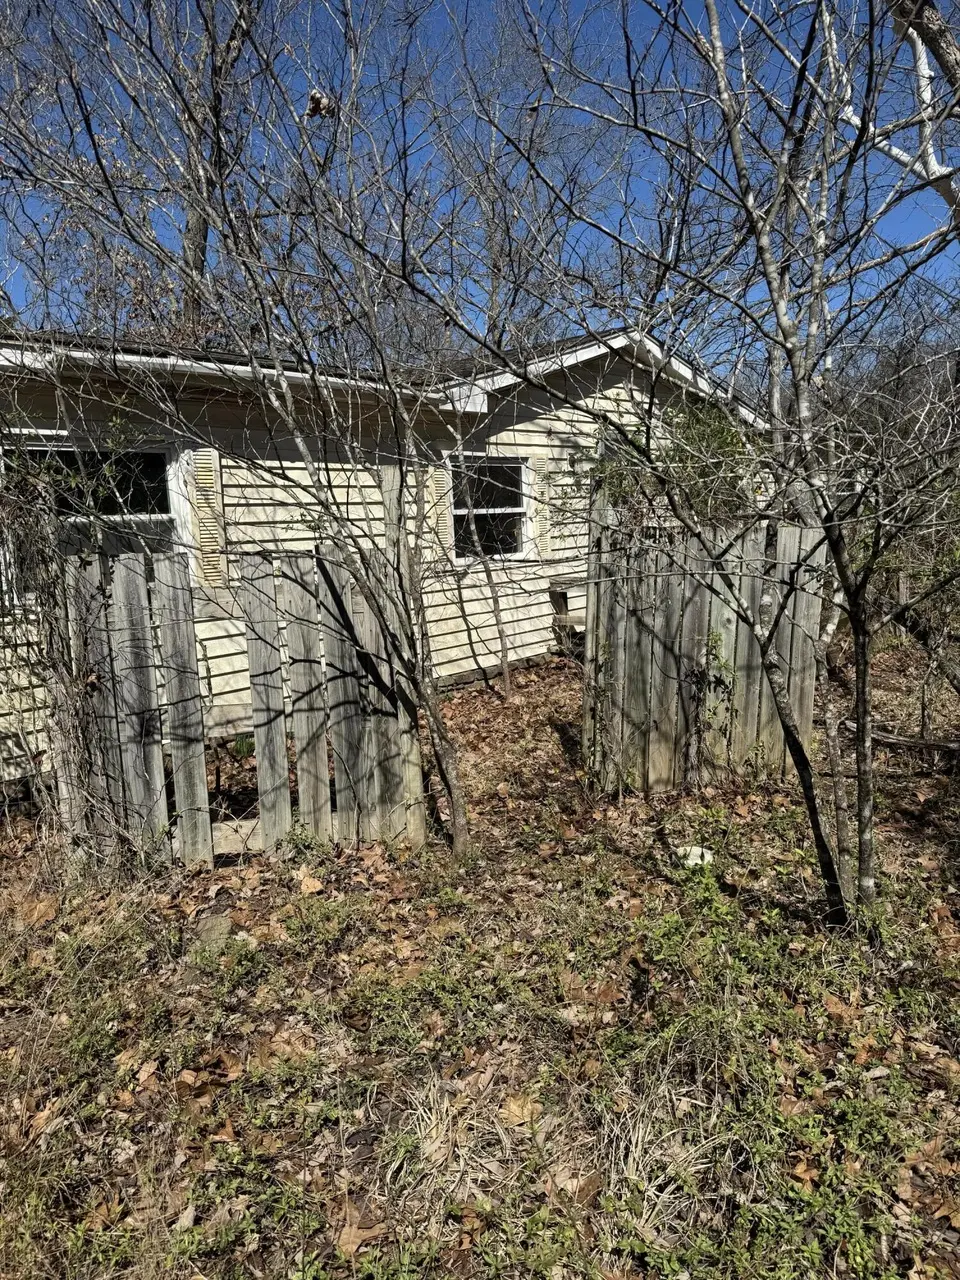
Investment opportunity on three lots with existing infrastructure. Property includes a 3-bedroom, 2-bath manufactured home that will require significant renovation or removal. Utilities already in place, including septic, electricity, and public water--offering a strong foundation for redevelopment or new construction. Due to condition of the property, please use caution in or around the property. Visitors assume full responsibility for their safety while on the premises. The property owner and broker shall not be held liable for any injuries or accidents occurring on the property.
Key facts
- Lake home
- Getaway cabin
- 0.52 acre lot
Tags
Property features AI
Finance
- Other: Property type: Residential; Property sub-type: Manufactured on land
- Financial info: Financial details not provided
- HOA & community: Subdivision: Tomahawk Heights
Exterior
- Parking: Parking details not specified
- Security: Security details not specified
- Utilities: Public water; Septic tank; Propane service
- Home design: Manufactured home on land; One story
- Construction: Vinyl siding; Composition roof; Built as a manufactured house
- Exterior features: Partial fencing; Gravel road frontage on a county road; Lot approximately 0.52 acres (225 x 100)
Interior
- Kitchen: Laminate counters (kitchen)
- Bedrooms: Bedrooms information not specified
- Flooring: Flooring: see remarks
- Bathrooms: 2 full bathrooms
- Heating & cooling: Central heating; Propane heating; Fireplace heating; Central air conditioning
- Interior features: Laminate countertops; Walk-in closet(s); Masonry fireplace
- Laundry & utility: Laundry on the main level
Neighborhood map
What this means for you Summary
Snapshot
- This is a 3-bed/2.0-bath manufactured listed at $28k.
Deal economics
- At list price, monthly cash flow is $710 ($9k/yr) — positive.
- The deal already cash-flows at list — no discount required.
- Meets the 1% rule at list price ($1k rent vs $28k).
- Cap rate 36.7% vs local median 1.1% in Shell Knob — top-decile yield for the area; either an underpriced asset or a hidden risk that comps aren't pricing in. Stress-test before assuming the spread holds.
Location & tenants
- Location reads 66/100 on livability (#254 in MO) — a middle-class / working-renter tenant base. Strengths: crime A+, cost of living A+, housing B; Watch: health & safety C-, employment D, schools D-.
- Blue Eye R-V (rural): math 41% / reading 47% proficiency, ranked #107 of 324 in MO (top 33%) — families likely to look elsewhere, expect single-tenant / working-renter base with shorter leases.
- Market conditions: 232 active listings in the ZIP; 191 units permitted in Stone County in 2024 (0 in 5+ unit buildings).
Forward outlook
- Local home prices are declining (-3.0%/yr); year-one equity from $194 of loan paydown is wiped out by about $840 of value loss. Plan a longer hold.
- Stone County population projected at -30% by 2050 — secular population decline; favor cash flow + early exit over multi-decade hold.
- At projected returns (-3.0% appreciation + 3.0% rent growth), your $8k cash investment doubles in ~1 year — after that, you're playing with house money.
Negotiation context
- Only 7 days on market — expect competitive offers; lowballing is unlikely to land.
- 2 sale attempts with the ask held roughly flat each time — persistent listings suggest the price (not the market) is what's stuck; bring a comps-based counter.
Questions for the listing agent
- Is there a deadline driving the sale (1031 exchange, divorce, estate, relocation)? That informs how much negotiation room exists.
- Schools are D-rated, which usually means shorter tenancies and higher turnover. Who's the typical renter profile here, and what's been the actual vacancy rate?
- What's the average days-on-market for RENTAL listings here right now (not sales)? A rising rental-DOM trend means longer vacancies and softer asking-rent achievability than the comps imply.
- What's the recent tenant-quality profile in this submarket — average credit score on applications, eviction rate, late-payment / NSF rate, and stable-employment percentage? A property-management company in the area should have these aggregated.
- How much new for-sale + rental construction is in the pipeline within 1–3 miles? Heavy new supply typically softens prices + rents 12–24 months out; constrained supply supports both.
Investment metrics
- 1% rule
- 3.99% ✓
- Cap rate
- 36.71%
- Cash-on-cash
- 108.63%
- DSCR
- 5.83
- GRM
- 2.1
CMA / ARV
- ARV (median comp)
- $110,632
- List price
- $28,000
- Delta
- -63.84%
- Verdict
- UNDERPRICED
- Comps
- 3 within 1.0 mi
Projected returns pro-forma
-3.0% appreciation · 3.0% rent growth · sell at horizon
- IRR
- —
- Equity multiple
- 6.19×
- Total profit
- $40,668
- Equity at exit
- $4,175
- IRR
- —
- Equity multiple
- 12.94×
- Total profit
- $93,631
- Equity at exit
- $2,421
Cash invested: $7,840 (down + closing). Projections, not guarantees.
Landlord ↔ Tenant lean methodology
- Overall (STATE)
- 81 Strongly Landlord-Friendly
- State Missouri
- 81 Strongly Landlord-Friendly · R+10
- County
- — inherits STATE
- City
- — inherits STATE
ZIP-level market 65747
- Home prices YoY
- -2.5%
- Active inventory
- 232
- Price-to-rent
- 2.1×
Monthly cashflow live
- Estimated rent
- $1,116 medium interval (Pro) →
- Mortgage (P&I)
- −$147
- Tax from tax record
- −$13 /mo · $162/yr
- Insurance
- −$12
- HOA
- −$0
- Vacancy / Maint / Mgmt
- −$234
- Net cashflow
- $710
Break-even live
Sensitivity live
| Price | -10% $726 | -5% $718 | +0% $710 | +5% $702 | +10% $694 |
|---|---|---|---|---|---|
| Rent | -10% $622 | -5% $666 | +0% $710 | +5% $754 | +10% $798 |
| Rate | -1.0pp $724 | -0.5pp $717 | base $710 | +0.5pp $702 | +1.0pp $695 |
UW: 25.0% down · 7.5% · 30yr · 1.5% tax · 5.0% vac · 8.0% maint · 8.0% mgmt
Financing live
Cash to close
- Down payment
- $7,000
- Closing costs
- $840
- Reserves months
- —
- Total cash needed
- —
Loan-product check · same deal, 3 products live
Conventional
25% down · 7.5% · 30yr
- Down + closing
- —
- Monthly P&I
- —
- Monthly cashflow
- —
- DSCR
- —
- Eligible?
- —
Personal DTI + credit; lowest rate.
DSCR
20% down · 8.5% · 30yr
- Down + closing
- —
- Monthly P&I
- —
- Monthly cashflow
- —
- DSCR
- —
- Eligible?
- —
No personal income docs; deal must DSCR.
Hard money
10% down · 12.0% · 12mo
- Down + closing
- —
- Monthly P&I
- —
- Monthly cashflow
- —
- DSCR
- —
- Eligible?
- —
Short-term bridge; refi at stabilization.
Listing history 10 events
-
2026-06-19days on market $28,000 Active 7 DOM
-
2026-06-18days on market $28,000 Active 6 DOM
-
2026-06-17days on market $28,000 Active 5 DOM
-
2026-06-16days on market $28,000 Active 4 DOM
-
2026-06-15days on market $28,000 Active 3 DOM
-
2026-06-12pricedays on market $28,000 Active 1 DOM
-
2026-05-31days on market $40,000 Active 68 DOM
-
2026-05-30days on market $40,000 Active 67 DOM
-
2026-05-14price $40,000 588-char remark
-
2026-03-24$60,000 Active 588-char remark
ⓘ Source: listings_history table (triggers on properties + properties_extension) + one-shot
backfill from property_details.listing_events for pre-trigger history.
Tax reassessment forecast MO · Resets to sale price
- Current annual tax
- $162 · $13/mo
- Projected year-2 tax
- $272 · $23/mo
- Expected delta
- +$110/yr (+$9/mo · 67.8%)
ⓘ Screening estimate from a state-policy table — verify with the county assessor before closing.
Climate risk First Street
- Flood 1/10 Low FEMA zone X (unshaded) · 0% chance over 30 yrs
- Wildfire 3/10 Moderate
- Heat 4/10 Moderate 7 d/yr ≥105°F today · 20 d/yr by 30 yrs out
- Wind 2/10 Low 100% chance of damaging wind over 30 yrs
- Air quality 2/10 Low 0 unhealthy d/yr today · 1 by 30 yrs out
Nearby sold comps map
Loading sold comps map…
Walkable amenities ~0.75 mi
Loading nearby amenities…
Taxation est. · year 1
- Rental income
- $13,393
- − Mortgage interest
- −$1,568
- − Property taxes
- −$162
- − Insurance
- −$140
- − Repairs & maintenance
- −$1,071
- − Management
- −$1,071
- − Depreciation
- −$815
- Taxable income
- $8,565
- Est. tax owed @ 24.0%
- −$2,056
- After-tax cash flow
- $6,461/yr
For passive investors: Depreciation is non-cash, so a rental often shows a tax loss while cash-flowing — sheltering income. Rental losses are passive: they offset passive income freely, and up to $25,000/yr can offset ordinary (W-2) income if you actively participate and your MAGI is under $100k (phasing out to $0 by $150k); unused losses carry forward. On sale, claimed depreciation is recaptured at up to 25%, and gains may owe capital-gains tax (a 1031 exchange can defer both). Figures are a year-1 estimate at your 24.0% rate — not tax advice; consult a CPA.
Schools (NCES district)
- District
- Blue Eye R-V
- NCES district ID
- 2905280
- Math proficiency
- 41% ▲ 3.00%
- Reading proficiency
- 47% ▼ -5.00%
- Median HH income
- $42,591
- Composite
- 37.08/100
- National rank
- #4500
- State rank
- #107 of 324 in MO
Livability — Shell Knob
- Score
- 66/100
- State rank
- #254
- US rank
- #12290
Category grades
Schools grade is shown separately in the Schools card above.
Census & demographics
- City population
- 3,957
- Population (ZIP)
- 3,957
Population outlook (Stone County) Hauer SSP2
- Today (2025)
- 28,147 people
- By 2030
- 26,405 · -6.2%
- By 2040
- 22,762 · -19.1%
- By 2050
- 19,706 · -30.0%
- By 2075
- 14,742 · -47.6%
- By 2100
- 10,832 · -61.5%
Race, ethnicity, and origin ACS 2023
- Neighborhood character
- Predominantly White (79%)
- Race & ethnicity
- White 79% Two or more races 17% Hispanic / Latino 12% Native American 3%
- Hispanic origin (detail)
- Mexican 6%
- Common ancestry
- Lithuanian 5% Italian 3% Iranian 3%
- Foreign-born
- 3% · Canada
- Languages at home
- 92% English-only · Spanish 8%
Political lean MEDSL · Stone
- 2024 margin
- Solid R (+61.4) · D 18.9% · R 80.3%
- 2008→2024 swing
- -24.1pp toward R · 2008: -37.3pp · 2024: -61.4pp
- All cycles
- 2024: R+61.4 2020: R+61.1 2016: R+62.1 2012: R+49.2 2008: R+37.3
Not yet ingested
- Civics
- —
Market trends
- HPI YoY
- ▼ -6.62%
- Current HPI
- 252.5383
- Rent YoY
- —
- Metro
- —
- State GDP YoY
- ▲ 1.84%
- F500 in state
- 20
Industry mix (Fortune 500 HQ in MO)
| Industry | F500 HQs | Revenue |
|---|---|---|
| Healthcare | 1 | $163B |
|
||
| Insurance | 1 | $21B |
|
||
| Industrial Technology | 1 | $17B |
|
||
| Retail | 1 | $16B |
|
||
| Industrial Distribution | 1 | $10B |
|
||
| Utilities | 1 | $9B |
|
||
Price history
-53.3% since first listed4 events — show timeline
- 2026-06-19 Pending — SOMO
- 2026-06-11 Listed $28,000 SOMO
- 2026-05-14 Price Changed $40,000 SOMO
- 2026-03-24 Listed $60,000 SOMO
Property tax history
-2.9%/yrLatest (2025): $162 · +0.9% YoY. Source: county tax records.
Cash-flow waterfall
monthlySold comps — $/sqft
last 12 mo · ≤1 miLoading sold comps…