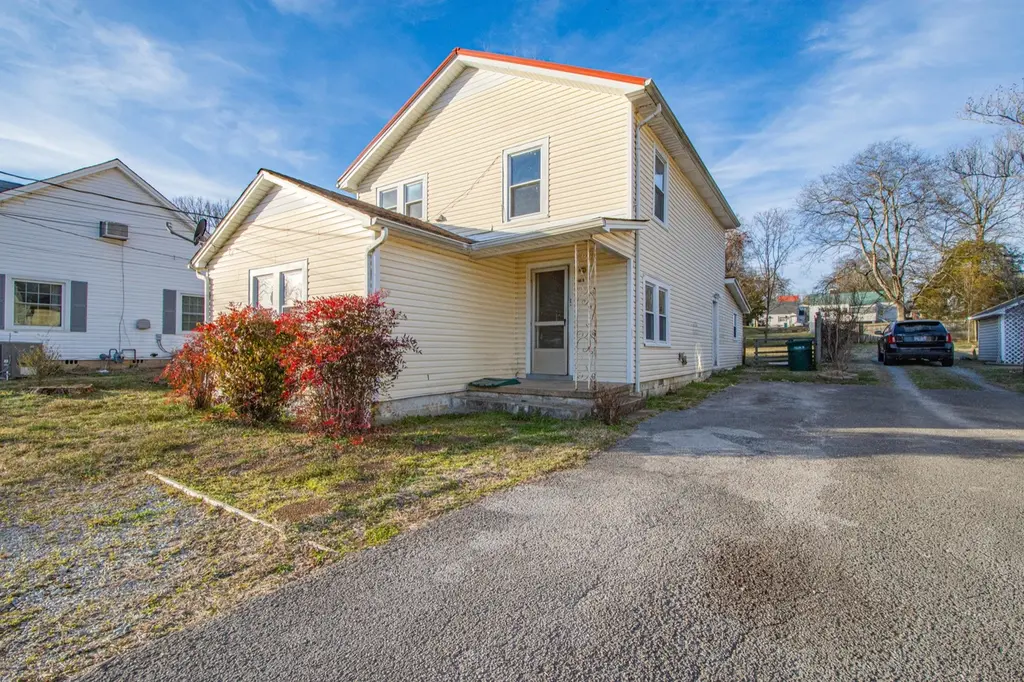
632 E Madison St · Pulaski, TN
Flood risk 1/10 · Minimal
- FEMA flood zone
- X (unshaded)
- Chance of flooding over 30 yrs
- 0.0%
- Est. flood insurance / yr
- $473 – $860
Fire risk 3/10 · Minor
- Est. fire insurance / yr
- $949 – $1,763
Heat risk 5/10 · Moderate
- Hot days now (above 105°F)
- 7 days/yr
- Hot days in 30 yrs
- 20 days/yr
Wind risk 4/10 · Minor
- Chance of severe wind over 30 yrs
- 16.0%
Air-quality risk 2/10 · Minimal
- Unhealthy air days now
- 0 days/yr
- Unhealthy air days in 30 yrs
- 1 days/yr
Risk factors via First Street. Map © Google.
Why this score? — see what drove the C- grade
The composite is a weighted blend of 9 inputs, each scored 0–100. Each bar is that input's sub-score; the figure is the points it added to the 100-point composite (weight × sub-score).
- Cash flow +17.5/30.0
- ARV discount +15.0/15.0
- DSCR +5.5/10.0
- 1% rule +3.7/10.0
- Livability +3.2/5.0
- Rent growth +2.5/5.0
- Condition / age +2.5/5.0
- Schools +1.9/10.0
- Appreciation +0.0/10.0
$169,900
🖨 Deal sheet 📄 Offer letter ✓ Due diligence
Listing remarks
Duplex Near Downtown Pulaski’s Square! (could be used as a single family) 📍 Prime Location – Only a few blocks from the Square in Pulaski ✨ Property Features: ▪️ Duplex – Both Units 2 Bedrooms / 1 Bath ▪️ Conveniently Located ▪️ Large, Easy-to-Maintain Yard ▪️ Great Opportunity to Improve & Add Value ▪️ No Tenants – Remodel & Lease from Day One! 💼 Perfect investment opportunity or house-hack potential! 📞 Call Today to Schedule Your Showing!
Key facts
- 0.26 acre lot
- Built 1948
- Listed 120 days
Neighborhood map
What this means for you Summary
Snapshot
- This is a 4-bed/2.0-bath single-family listed at $170k.
Deal economics
- At list price, monthly cash flow is $130 ($2k/yr) — positive.
- The deal already cash-flows at list — no discount required.
- To meet the 1% rule (rent ≥ 1% of price), the offer needs to be $148k (13.0% below list).
- Recommended offer: $148k (13.0% below list) — sets the bar for 1% rule.
- Cap rate 7.2% vs local median 2.7% in Pulaski — top-decile yield for the area; either an underpriced asset or a hidden risk that comps aren't pricing in. Stress-test before assuming the spread holds.
Location & tenants
- Location reads 64/100 on livability (#174 in TN) — a middle-class / working-renter tenant base. Strengths: cost of living A+, housing A+; Watch: health & safety C-, schools F, crime F.
- Giles County (rural): math 20% / reading 24% proficiency, ranked #105 of 139 in TN (top 76%) — low school quality limits family demand, transient renter base, plan for 1-2y turnover.
- Market conditions: 186 active listings in the ZIP; 73 units permitted in Giles County in 2024 (0 in 5+ unit buildings).
Forward outlook
- Local home prices are declining (-3.0%/yr); year-one equity from $1k of loan paydown is wiped out by about $5k of value loss. Plan a longer hold.
- Giles County population projected at -10% by 2050 — secular population decline; favor cash flow + early exit over multi-decade hold.
Negotiation context
- It's been on market 120 days — a 9% lower offer ($155k) is reasonable based on typical stale-listing flexibility.
- 2 sale attempts with the ask held roughly flat each time — persistent listings suggest the price (not the market) is what's stuck; bring a comps-based counter.
- Current owner paid $45k; list at $170k implies a 278% gain — meaningful room to come down on a strong offer.
Risks & watch-outs
- Watch-outs: built in 1948 — expect roof / HVAC / electrical / plumbing capex.
- Climate carrying-cost: extreme-heat days projected 7→20/yr by 2055 (HVAC capex compounding) — expect insurance premiums to compound above CPI over the hold.
Questions for the listing agent
- It's been on market 120 days. Have you received any prior offers? Is the seller open to a 13% concession, seller financing, or rate buy-down credit?
- Built in 1948 — when were the roof, HVAC, electrical panel, plumbing, and water heater last replaced?
- Why hasn't it sold? Are there any deal-killer items the seller is aware of (foundation, flood, title, zoning, code violations)?
- Is there a deadline driving the sale (1031 exchange, divorce, estate, relocation)? That informs how much negotiation room exists.
- Schools are F-rated, which usually means shorter tenancies and higher turnover. Who's the typical renter profile here, and what's been the actual vacancy rate?
- Crime grade is F in this area — have there been break-ins, vandalism, or insurance claims at this property in the last 3 years? What carrier currently insures it and at what premium?
- What's the average days-on-market for RENTAL listings here right now (not sales)? A rising rental-DOM trend means longer vacancies and softer asking-rent achievability than the comps imply.
- What's the recent tenant-quality profile in this submarket — average credit score on applications, eviction rate, late-payment / NSF rate, and stable-employment percentage? A property-management company in the area should have these aggregated.
- How much new for-sale + rental construction is in the pipeline within 1–3 miles? Heavy new supply typically softens prices + rents 12–24 months out; constrained supply supports both.
Investment metrics
- 1% rule
- 0.87% ✗
- Cap rate
- 7.21%
- Cash-on-cash
- 3.28%
- DSCR
- 1.15
- GRM
- 9.6
CMA / ARV
- ARV (median comp)
- $208,648
- List price
- $169,900
- Delta
- -18.57%
- Verdict
- UNDERPRICED
- Comps
- 20 within 1.0 mi
Show comp detail 12 sales within ~0.75 mi
| Address | Dist | Beds/Ba | Sqft | Sold | Price | $/sf | Match |
|---|---|---|---|---|---|---|---|
| 614 Yokley Ln | 0.25mi | 4/2.0 | 2,142 (+2%) | 2mo | $210,000 | $98 | 82 |
| 538 E Madison St | 0.15mi | 3/2.0 (-1) | 2,056 (-2%) | 10mo | $195,000 | $95 | 77 |
| 635 Cleveland St | 0.37mi | 4/2.0 | 2,180 (+4%) | 3mo | $175,000 | $80 | 73 |
| 221 Pine St | 0.26mi | 3/2.5 (-1) | 2,148 (+3%) | 12mo | $298,500 | $139 | 66 |
| 439 E Madison St | 0.33mi | 4/2.5 | 2,254 (+8%) | 4mo | $342,000 | $152 | 66 |
| 442 Longmeadow Cir | 0.38mi | 4/2.0 | 1,899 (-9%) | 2mo | $242,000 | $127 | 66 |
| 420 Madison St E | 0.35mi | 4/2.0 | 2,065 (-1%) | 22mo | $349,800 | $169 | 63 |
| 265 Mimosa Dr | 0.49mi | 4/2.0 | 1,970 (-6%) | 13mo | $187,500 | $95 | 57 |
| 555 E College St | 0.24mi | 3/2.0 (-1) | 1,964 (-6%) | 22mo | $200,000 | $102 | 56 |
| 801 Yokley Ln | 0.23mi | 3/2.0 (-1) | 1,934 (-7%) | 19mo | $350,000 | $181 | 56 |
| 434 Highland Ave | 0.32mi | 3/2.0 (-1) | 2,363 (+13%) | 16mo | $415,000 | $176 | 45 |
| 540 Cleveland St | 0.37mi | 4/1.0 | 1,788 (-14%) | 13mo | $239,000 | $134 | 44 |
Match score weights: distance 35% · size 25% · config 20% · recency 20%. Top-matched comps best support the ARV.
Projected returns pro-forma
-3.0% appreciation · 3.0% rent growth · sell at horizon
- IRR
- -11.2%
- Equity multiple
- 0.59×
- Total profit
- $-19,308
- Equity at exit
- $25,333
- IRR
- -2.0%
- Equity multiple
- 0.87×
- Total profit
- $-6,396
- Equity at exit
- $14,690
Cash invested: $47,572 (down + closing). Projections, not guarantees.
Landlord ↔ Tenant lean methodology
- Overall (STATE)
- 87 Strongly Landlord-Friendly
- State Tennessee
- 87 Strongly Landlord-Friendly · R+13
- County
- — inherits STATE
- City
- — inherits STATE
ZIP-level market 38478
- Home prices YoY
- -12.7%
- Active inventory
- 186
- Price-to-rent
- 9.6×
Monthly cashflow live
- Estimated rent
- $1,478 medium interval (Pro) →
- Mortgage (P&I)
- −$891
- Tax from tax record
- −$76 /mo · $907/yr
- Insurance
- −$71
- HOA
- −$0
- Vacancy / Maint / Mgmt
- −$310
- Net cashflow
- $130
Break-even live
UW: 25.0% down · 7.5% · 30yr · 1.5% tax · 5.0% vac · 8.0% maint · 8.0% mgmt
Financing live
Cash to close
- Down payment
- $42,475
- Closing costs
- $5,097
- Reserves months
- —
- Total cash needed
- —
Loan-product check · same deal, 3 products live
Conventional
25% down · 7.5% · 30yr
- Down + closing
- —
- Monthly P&I
- —
- Monthly cashflow
- —
- DSCR
- —
- Eligible?
- —
Personal DTI + credit; lowest rate.
DSCR
20% down · 8.5% · 30yr
- Down + closing
- —
- Monthly P&I
- —
- Monthly cashflow
- —
- DSCR
- —
- Eligible?
- —
No personal income docs; deal must DSCR.
Hard money
10% down · 12.0% · 12mo
- Down + closing
- —
- Monthly P&I
- —
- Monthly cashflow
- —
- DSCR
- —
- Eligible?
- —
Short-term bridge; refi at stabilization.
Listing history 17 events
-
2026-06-18days on market $169,900 Active 120 DOM
-
2026-06-17days on market $169,900 Active 119 DOM
-
2026-06-16days on market $169,900 Active 118 DOM
-
2026-06-15days on market $169,900 Active 117 DOM
-
2026-06-13days on market $169,900 Active 115 DOM
-
2026-06-12days on market $169,900 Active 114 DOM
-
2026-06-09days on market $169,900 Active 111 DOM
-
2026-06-09status $169,900 Active 110 DOM
-
2026-06-08days on market $169,900 Active Under Contract 110 DOM
-
2026-06-08days on market $169,900 Active Under Contract 109 DOM
-
2026-06-03days on market $169,900 Active Under Contract 105 DOM
-
2026-06-02days on market $169,900 Active Under Contract 104 DOM
-
2026-06-01days on market $169,900 Active Under Contract 103 DOM
-
2026-05-31days on market $169,900 Active Under Contract 102 DOM
-
2026-02-18$169,900 Active
-
2026-02-18$169,900 Active
-
2000-02-29soldstatus $45,000
ⓘ Source: listings_history table (triggers on properties + properties_extension) + one-shot
backfill from property_details.listing_events for pre-trigger history.
Tax reassessment forecast TN · Resets to sale price
- Current annual tax
- $907 · $76/mo
- Projected year-2 tax
- $1,206 · $101/mo
- Expected delta
- +$299/yr (+$25/mo · 33.0%)
ⓘ Screening estimate from a state-policy table — verify with the county assessor before closing.
Climate risk First Street
- Flood 1/10 Low FEMA zone X (unshaded) · 0% chance over 30 yrs
- Wildfire 3/10 Moderate
- Heat 5/10 Major 7 d/yr ≥105°F today · 20 d/yr by 30 yrs out
- Wind 4/10 Moderate 16% chance of damaging wind over 30 yrs
- Air quality 2/10 Low 0 unhealthy d/yr today · 1 by 30 yrs out
Nearby sold comps map
Loading sold comps map…
Walkable amenities ~0.75 mi
Loading nearby amenities…
Taxation est. · year 1
- Rental income
- $17,733
- − Mortgage interest
- −$9,517
- − Property taxes
- −$907
- − Insurance
- −$850
- − Repairs & maintenance
- −$1,419
- − Management
- −$1,419
- − Depreciation
- −$4,943
- Taxable loss
- −$1,320
- Est. tax savings @ 24.0%
- +$317
- After-tax cash flow
- $1,878/yr
For passive investors: Depreciation is non-cash, so a rental often shows a tax loss while cash-flowing — sheltering income. Rental losses are passive: they offset passive income freely, and up to $25,000/yr can offset ordinary (W-2) income if you actively participate and your MAGI is under $100k (phasing out to $0 by $150k); unused losses carry forward. On sale, claimed depreciation is recaptured at up to 25%, and gains may owe capital-gains tax (a 1031 exchange can defer both). Figures are a year-1 estimate at your 24.0% rate — not tax advice; consult a CPA.
Schools (NCES district)
- District
- Giles County
- NCES district ID
- 4701410
- Math proficiency
- 20% ▼ -18.00%
- Reading proficiency
- 24% ▼ -7.00%
- Median HH income
- $40,318
- Composite
- 18.63/100
- National rank
- #8895
- State rank
- #105 of 139 in TN
Livability — Pulaski
- Score
- 64/100
- State rank
- #174
- US rank
- #14586
Category grades
Schools grade is shown separately in the Schools card above.
Census & demographics
- Census place
- Pulaski, TN
- Population (ZIP)
- 18,756
Population outlook (Giles County) Hauer SSP2
- Today (2025)
- 28,505 people
- By 2030
- 27,960 · -1.9%
- By 2040
- 26,740 · -6.2%
- By 2050
- 25,665 · -10.0%
- By 2075
- 24,798 · -13.0%
- By 2100
- 25,524 · -10.5%
Race, ethnicity, and origin ACS 2023
- Neighborhood character
- Predominantly White (77%)
- Race & ethnicity
- White 77% Black 11% Two or more races 7% Hispanic / Latino 4%
- Common ancestry
- Serbian 3% Slovak 2% Lithuanian 1%
- Foreign-born
- 1% · Canada
- Languages at home
- 96% English-only · Spanish 3% German/W. Germanic 1%
Political lean MEDSL · Giles
- 2024 margin
- Solid R (+55.0) · D 22.1% · R 77.1%
- 2008→2024 swing
- -35.4pp toward R · 2008: -19.6pp · 2024: -55.0pp
- All cycles
- 2024: R+55.0 2020: R+49.1 2016: R+45.4 2012: R+29.2 2008: R+19.6
Not yet ingested
- Civics
- —
Market trends
- HPI YoY
- ▼ -46.60%
- Current HPI
- 319.6315
- Rent YoY
- —
- Metro
- —
- State GDP YoY
- ▲ 2.78%
- F500 in state
- 22
Industry mix (Fortune 500 HQ in TN)
| Industry | F500 HQs | Revenue |
|---|---|---|
| Healthcare | 3 | $91B |
|
||
| Retail | 3 | $72B |
|
||
| Transportation / Logistics | 1 | $88B |
|
||
| Paper / Packaging | 1 | $19B |
|
||
| Insurance | 1 | $13B |
|
||
| Energy | 1 | $12B |
|
||
Price history
+277.6% since first listed3 events — show timeline
- 2026-02-18 Listed $169,900 REALTRACS as Distributed by MLS Grid
- 2026-02-18 Listed $169,900 REALTRACS as Distributed by MLS Grid
- 2000-02-29 Sold (Public Records) $45,000 Public Records
Property tax history
+4.9%/yrLatest (2025): $907 · +13.4% YoY. Source: county tax records.
Cash-flow waterfall
monthlySold comps — $/sqft
last 12 mo · ≤1 miLoading sold comps…