 Duplex
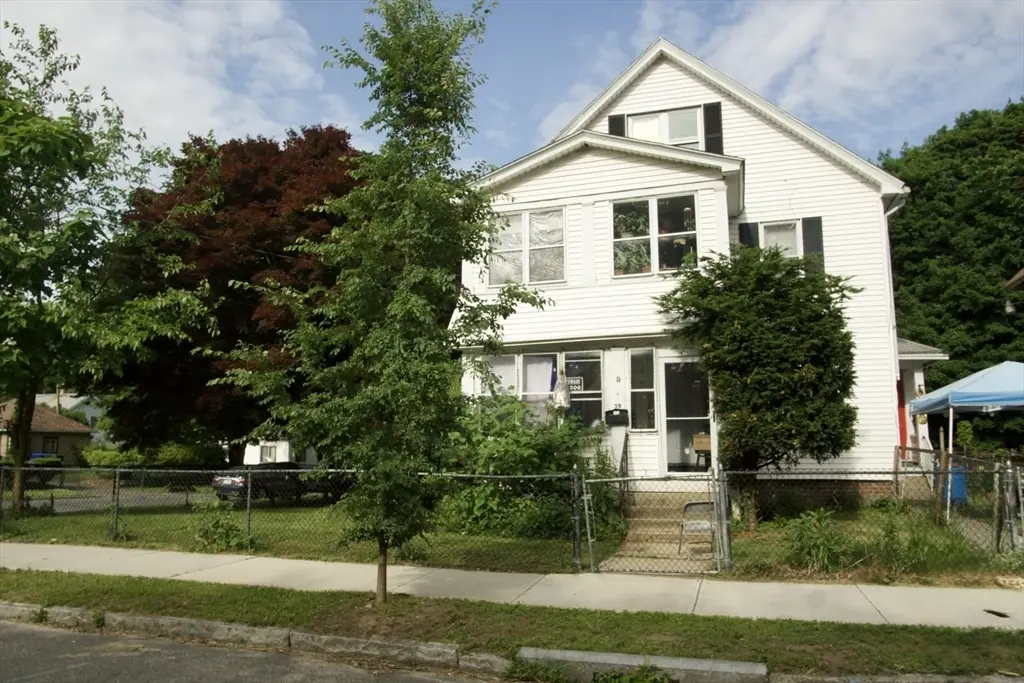
59-61 Carlisle St · Springfield, MA
Flood risk No data
- FEMA flood zone
- —
- Chance of flooding over 30 yrs
- —
- Est. flood insurance / yr
- —
Fire risk No data
- Est. fire insurance / yr
- —
Heat risk No data
- Hot days now (above threshold)
- —
- Hot days in 30 yrs
- —
Wind risk No data
- Chance of severe wind over 30 yrs
- —
Air-quality risk No data
- Unhealthy air days now
- —
- Unhealthy air days in 30 yrs
- —
Risk factors via First Street. Map © Google.
Why this score? — see what drove the D+ grade
The composite is a weighted blend of 9 inputs, each scored 0–100. Each bar is that input's sub-score; the figure is the points it added to the 100-point composite (weight × sub-score).
- Cash flow +22.8/30.0
- DSCR +7.3/10.0
- 1% rule +5.4/10.0
- Livability +3.7/5.0
- Rent growth +2.5/5.0
- Condition / age +2.5/5.0
- Schools +1.6/10.0
- ARV discount +0.0/15.0
- Appreciation +0.0/10.0
$399,900
🖨 Deal sheet 📄 Offer letter ✓ Due diligence
Multi-family units
County records classify this as Multi-Family (2-4 Unit). Listing-text estimate: 2 units. confirmed
Listing remarks MLS
Two family dwelling with large spacious rooms. 2 BR each apartment, Full walkup attic area. Two car garage detached, Corner lot, fenced in yard. Fannie Mae Homepath Property, Approved for Homepath Renovation Mortgage.
Key facts
- Separate utilities
- Access to route 91
- Multi-family home
Tags
Property features AI
Finance
- Other: Building total area approximately 3,351; Lot about 0.14 acres
- Financial info: $4,701 annual property tax (2025)
- HOA & community: Nearby public transportation; Close to shopping
Exterior
- Parking: 2-car garage (covered); 2 covered spaces; 4 open parking spaces; Total of 6 parking spaces; Off-street parking
- Utilities: Public water; Public sewer; Electric with circuit breakers
- Home design: Multi-family property; 3 stories; 3 total levels
- Construction: Stone foundation; Approximate year built (public records)
- Exterior features: Porch; Corner lot; Public road frontage
Interior
- Flooring: Varied flooring
- Bathrooms: 3 full bathrooms
- Heating & cooling: Wall unit cooling
- Interior features: Living room; Kitchen; Insulated windows; Full basement; 15 total rooms
Neighborhood map
What this means for you Summary
Snapshot
- This is a 2 × 3-bed/1.5-bath units multifamily listed at $400k.
Deal economics
- At list price, monthly cash flow is $697 ($8k/yr) — positive. Per door: $349/mo.
- The deal already cash-flows at list — no discount required.
- Meets the 1% rule at list price ($4k rent vs $400k).
- Cap rate 8.4% vs local median 5.1% in Springfield — top-decile yield for the area; either an underpriced asset or a hidden risk that comps aren't pricing in. Stress-test before assuming the spread holds.
Location & tenants
- Location reads 73/100 on livability (#97 in MA) — a middle-class / working-renter tenant base. Strengths: commute A+, health & safety A+, amenities A; Watch: schools D, crime F, employment D-.
- Springfield (urban): math 13% / reading 25% proficiency, ranked #296 of 302 in MA (top 98%) — low school quality limits family demand, transient renter base, plan for 1-2y turnover; 81% free/reduced lunch — lower-income household profile, screen leases tightly.
- Market conditions: 32 active listings in the ZIP; 453 units permitted in Hampden County in 2024 (116 in 5+ unit buildings).
- At $4,165/mo this rent would consume 103% of the median local household income ($48k/yr) (locally 1322% of renters already pay >50% of income on rent) — very limited rent-growth headroom before tenants either downsize or default.
Forward outlook
- Local home prices are declining (-3.0%/yr); year-one equity from $3k of loan paydown is wiped out by about $12k of value loss. Plan a longer hold.
- Hampden County population projected at +5% by 2050 — modest demand growth; plan on rents tracking national, not racing it.
Negotiation context
- Only 7 days on market — expect competitive offers; lowballing is unlikely to land.
- 3 sale attempts since 24y ago with the ask held roughly flat each time — persistent listings suggest the price (not the market) is what's stuck; bring a comps-based counter.
- Current owner paid $64k; list at $400k implies a 520% gain — meaningful room to come down on a strong offer.
Risks & watch-outs
- Watch-outs: built in 1926 — expect roof / HVAC / electrical / plumbing capex.
Questions for the listing agent
- Can we see the unit-by-unit rent roll, current vacancy, and any below-market leases? What's the average tenancy length?
- What capital expenditures (roof, boiler, parking lot, exteriors) have been made in the last 5 years, and what's planned in the next 2?
- Built in 1926 — when were the roof, HVAC, electrical panel, plumbing, and water heater last replaced?
- Is there a deadline driving the sale (1031 exchange, divorce, estate, relocation)? That informs how much negotiation room exists.
- Schools are D-rated, which usually means shorter tenancies and higher turnover. Who's the typical renter profile here, and what's been the actual vacancy rate?
- Crime grade is F in this area — have there been break-ins, vandalism, or insurance claims at this property in the last 3 years? What carrier currently insures it and at what premium?
- The area grade is low — what's the realistic commute time and amenity access for the typical tenant pool here? Any planned neighborhood developments (good or bad) we should know about?
- What's the average days-on-market for RENTAL listings here right now (not sales)? A rising rental-DOM trend means longer vacancies and softer asking-rent achievability than the comps imply.
- What's the recent tenant-quality profile in this submarket — average credit score on applications, eviction rate, late-payment / NSF rate, and stable-employment percentage? A property-management company in the area should have these aggregated.
- How much new apartment / multifamily construction is in the pipeline within 1–3 miles? Heavy new supply (>2% of stock underway) typically softens rents 12–24 months out; light construction supports rent growth.
Investment metrics
- 1% rule
- 1.04% ✓
- Cap rate
- 8.39%
- Cash-on-cash
- 7.47%
- DSCR
- 1.33
- GRM
- 8.0
CMA / ARV
- ARV (on-the-fly)
- $268,221
- Comps found
- 11
Show comp detail 11 sales within ~0.75 mi
| Address | Dist | Beds/Ba | Sqft | Sold | Price | $/sf | Match |
|---|---|---|---|---|---|---|---|
| 283 Wilbraham Rd | 0.26mi | 6/3.0 (+1) | 3,073 (-0%) | 1mo | $240,000 | $78 | 82 |
| 35-37 Suffolk St | 0.16mi | 6/2.0 (+1) | 3,082 (-0%) | 12mo | $420,000 | $136 | 73 |
| 98-100 Fenwick St | 0.16mi | 4/3.0 (-1) | 2,772 (-10%) | 9mo | $365,000 | $132 | 63 |
| 157-159 Massachusetts Ave | 0.50mi | 5/2.0 | 3,060 (-1%) | 12mo | $245,000 | $80 | 62 |
| 68-70 Massachusetts Ave | 0.49mi | 6/3.0 (+1) | 3,153 (+2%) | 11mo | $406,000 | $129 | 59 |
| 140 Northampton Ave | 0.62mi | 6/3.0 (+1) | 2,976 (-4%) | 4mo | $215,000 | $72 | 56 |
| 188-190 Northampton Ave | 0.66mi | 6/3.0 (+1) | 2,879 (-7%) | 8mo | $250,000 | $87 | 47 |
| 88 Massachusetts Ave | 0.49mi | 6/4.0 (+1) | 3,318 (+8%) | 12mo | $276,000 | $83 | 45 |
| 118-120 Westford Cir | 0.35mi | 6/2.0 (+1) | 2,673 (-13%) | 10mo | $400,000 | $150 | 44 |
| 95-97 Northampton Ave | 0.58mi | 4/2.0 (-1) | 3,168 (+3%) | 20mo | $200,000 | $63 | 43 |
| 154 Cambridge St | 0.72mi | 6/3.0 (+1) | 3,328 (+8%) | 19mo | $390,000 | $117 | 32 |
Match score weights: distance 35% · size 25% · config 20% · recency 20%. Top-matched comps best support the ARV.
Projected returns pro-forma
-3.0% appreciation · 3.0% rent growth · sell at horizon
- IRR
- -4.9%
- Equity multiple
- 0.82×
- Total profit
- $-20,433
- Equity at exit
- $59,626
- IRR
- 4.8%
- Equity multiple
- 1.35×
- Total profit
- $39,221
- Equity at exit
- $34,576
Cash invested: $111,972 (down + closing). Projections, not guarantees.
Landlord ↔ Tenant lean methodology
- Overall (STATE)
- 20 Strongly Tenant-Friendly
- State Massachusetts
- 20 Strongly Tenant-Friendly · D+15
- County
- — inherits STATE
- City
- — inherits STATE
ZIP-level market 01109
- Home prices YoY
- -22.8%
- Active inventory
- 32
- Price-to-rent
- 16.0×
Monthly cashflow live
- Estimated rent
- $4,165 high interval (Pro) →
- Mortgage (P&I)
- −$2,097
- Tax from tax record
- −$329 /mo · $3,952/yr
- Insurance
- −$167
- HOA
- −$0
- Vacancy / Maint / Mgmt
- −$875
- Net cashflow
- $697
Break-even live
2-unit breakdown (identical units grouped — click to expand)
| Units | Beds | Baths | Est. rent |
|---|---|---|---|
| 2× units | 3 | 1.5 | $4,164 |
| #1 | 3 | 1.5 | $2,082 |
| #2 | 3 | 1.5 | $2,082 |
| Total (2 units) | $4,165 | ||
UW: 25.0% down · 7.5% · 30yr · 1.5% tax · 5.0% vac · 8.0% maint · 8.0% mgmt
Financing live
Cash to close
- Down payment
- $99,975
- Closing costs
- $11,997
- Reserves months
- —
- Total cash needed
- —
Loan-product check · same deal, 3 products live
Conventional
25% down · 7.5% · 30yr
- Down + closing
- —
- Monthly P&I
- —
- Monthly cashflow
- —
- DSCR
- —
- Eligible?
- —
Personal DTI + credit; lowest rate.
DSCR
20% down · 8.5% · 30yr
- Down + closing
- —
- Monthly P&I
- —
- Monthly cashflow
- —
- DSCR
- —
- Eligible?
- —
No personal income docs; deal must DSCR.
Hard money
10% down · 12.0% · 12mo
- Down + closing
- —
- Monthly P&I
- —
- Monthly cashflow
- —
- DSCR
- —
- Eligible?
- —
Short-term bridge; refi at stabilization.
Listing history 7 events
-
2026-06-18days on market $399,900 Active 7 DOM
-
2026-06-17days on market $399,900 Active 6 DOM
-
2026-06-16days on market $399,900 Active 5 DOM
-
2026-06-15statusdays on market $399,900 Active 4 DOM
-
2026-06-14days on market $399,900 New 2 DOM
-
2026-06-13remarks 693-char remark
-
2026-06-13$399,900 New 1 DOM
ⓘ Source: listings_history table (triggers on properties + properties_extension) + one-shot
backfill from property_details.listing_events for pre-trigger history.
Tax reassessment forecast MA · Partial reset (capped growth)
- Current annual tax
- $3,952 · $329/mo
- Projected year-2 tax
- $4,435 · $370/mo
- Expected delta
- +$483/yr (+$40/mo · 12.2%)
ⓘ Screening estimate from a state-policy table — verify with the county assessor before closing.
Nearby sold comps map
Loading sold comps map…
Walkable amenities ~0.75 mi
Loading nearby amenities…
Taxation est. · year 1
- Rental income
- $49,980
- − Mortgage interest
- −$22,401
- − Property taxes
- −$3,952
- − Insurance
- −$2,000
- − Repairs & maintenance
- −$3,998
- − Management
- −$3,998
- − Depreciation
- −$11,633
- Taxable income
- $1,998
- Est. tax owed @ 24.0%
- −$479
- After-tax cash flow
- $7,888/yr
For passive investors: Depreciation is non-cash, so a rental often shows a tax loss while cash-flowing — sheltering income. Rental losses are passive: they offset passive income freely, and up to $25,000/yr can offset ordinary (W-2) income if you actively participate and your MAGI is under $100k (phasing out to $0 by $150k); unused losses carry forward. On sale, claimed depreciation is recaptured at up to 25%, and gains may owe capital-gains tax (a 1031 exchange can defer both). Figures are a year-1 estimate at your 24.0% rate — not tax advice; consult a CPA.
Schools (NCES district)
- District
- Springfield
- NCES district ID
- 2511130
- Math proficiency
- 13% ▼ -12.00%
- Reading proficiency
- 25% ▼ -5.00%
- Median HH income
- $34,938
- Composite
- 15.6/100
- National rank
- #9293
- State rank
- #296 of 302 in MA
Livability — Springfield
- Score
- 73/100
- State rank
- #97
- US rank
- #5195
Category grades
Schools grade is shown separately in the Schools card above.
Census & demographics
- Census place
- Springfield, MA
- County
- Hampden County · 230,965 people
- City population
- 61,006
- Metro
- Springfield, MA
- Population (ZIP)
- 31,124
- Household income
- $48,415
- Rent vs Own
- Severe rent burden
- 1322.0
Population outlook (Hampden County) Hauer SSP2
- Today (2025)
- 485,646 people
- By 2030
- 491,517 · +1.2%
- By 2040
- 500,539 · +3.1%
- By 2050
- 508,827 · +4.8%
- By 2075
- 539,167 · +11.0%
- By 2100
- 545,698 · +12.4%
Race, ethnicity, and origin ACS 2023
- Neighborhood character
- Diverse neighborhood (Simpson 0.67)
- Race & ethnicity
- Hispanic / Latino 45% Black 31% Two or more races 20% White 18% Asian 1% Native American 1%
- Hispanic origin (detail)
- Puerto Rican 39% Dominican 3%
- Common ancestry
- Lithuanian 2% Romanian 1%
- Foreign-born
- 9% · Canada, China
- Languages at home
- 65% English-only · Spanish 32% Other Asian/Pacific 1% Russian/Polish/Slavic 1%
Political lean MEDSL · Hampden
- 2024 margin
- Lean D (+8.9) · D 53.4% · R 44.5% · Other 2.1%
- 2008→2024 swing
- -16.4pp toward R · 2008: 25.3pp · 2024: 8.9pp
- All cycles
- 2024: D+8.9 2020: D+17.7 2016: D+16.0 2012: D+25.4 2008: D+25.3
Not yet ingested
- Civics
- —
Market trends
- HPI YoY
- ▼ -113.11%
- Current HPI
- 382.9038
- Rent YoY
- —
- Metro
- Springfield, MA
- State GDP YoY
- ▲ 2.28%
- F500 in state
- 38
Industry mix (Fortune 500 HQ in MA)
| Industry | F500 HQs | Revenue |
|---|---|---|
| Technology | 3 | $17B |
|
||
| Insurance | 2 | $84B |
|
||
| Retail | 2 | $76B |
|
||
| Life Sciences | 1 | $43B |
|
||
| Energy Technology | 1 | $31B |
|
||
| Aerospace / Defense | 1 | $18B |
|
||
Price history
+225.4% since first listed7 events — show timeline
- 2026-06-11 Listed $399,900 MLS PIN
- 2013-03-15 Sold (MLS) $64,500 MLS PIN
- 2012-09-08 Listed $69,900 MLS PIN
- 2002-08-14 Sold (Public Records) $120,000 Public Records
- 2002-08-14 Sold (Public Records) $120,000 Public Records
- 2002-08-14 Sold (MLS) $120,000 MLS PIN
- 2002-06-03 Listed $122,900 MLS PIN
Property tax history
+3.7%/yrLatest (2023): $3,952 · -9.6% YoY. Source: county tax records.
Cash-flow waterfall
monthlySold comps — $/sqft
last 12 mo · ≤1 miLoading sold comps…