 5-Plex
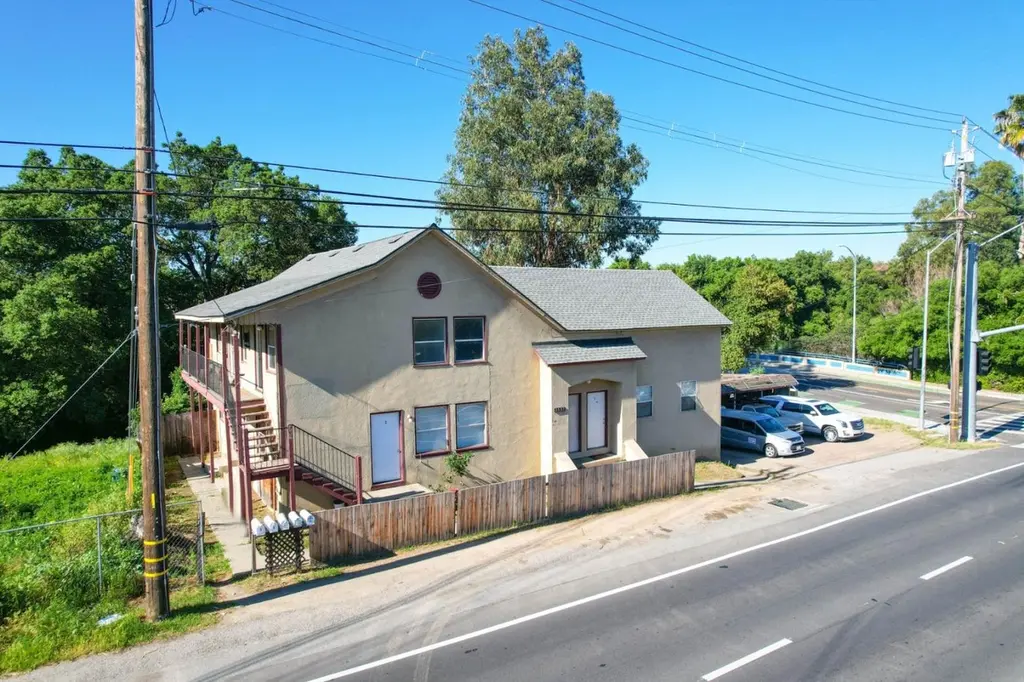
3557 San Felipe Rd · San Jose, CA
Flood risk 9/10 · Severe
- FEMA flood zone
- A
- Chance of flooding over 30 yrs
- 0.79%
- Est. flood insurance / yr
- $1,009 – $1,996
Fire risk 2/10 · Minimal
- Est. fire insurance / yr
- $659 – $1,223
Heat risk 5/10 · Moderate
- Hot days now (above 94°F)
- 7 days/yr
- Hot days in 30 yrs
- 14 days/yr
Wind risk 1/10 · Minimal
- Chance of severe wind over 30 yrs
- —
Air-quality risk 9/10 · Severe
- Unhealthy air days now
- 19 days/yr
- Unhealthy air days in 30 yrs
- 19 days/yr
Risk factors via First Street. Map © Google.
Why this score? — see what drove the D+ grade
The composite is a weighted blend of 9 inputs, each scored 0–100. Each bar is that input's sub-score; the figure is the points it added to the 100-point composite (weight × sub-score).
- Cash flow +16.9/30.0
- Schools +6.1/10.0
- DSCR +5.2/10.0
- Appreciation +4.2/10.0
- 1% rule +3.9/10.0
- Livability +3.9/5.0
- Rent growth +2.5/5.0
- Condition / age +2.5/5.0
- ARV discount +0.0/15.0
$1,265,000
🖨 Deal sheet (PDF) 📄 Offer letter ✓ Due diligence
Multi-family units
County records classify this as Multi-Family (5+ Unit). Listing-text estimate: 5 units. confirmed
5+ unit building — per-unit beds/baths from public records are typically unavailable; the breakdown below (if shown) is an estimate from the listing text.
Listing remarks MLS
3557 San Felipe Road is a charming 5-unit property located near the highly desireable Silver Creek area of San Jose. The property has a newer comp shingle roof (2020 with permit) and water heater (2024 with permit). All units are 1+1 with spacious layouts and ample closet space. Tenants benefit from a 2:1 on-site parking ratio and close proximity to recreation options such as Coyote Creek Trail, Evergreen Village Square and Duck Pond, and the 178 acre Hellyer County Park featuring playgrounds, dog park, hiking, picnic tables, fishing, biking, and courts.
Key facts
- Duck pond
- Water heater
- Coyote creek trail
Tags
Property features AI
Finance
- Other: Tenant expenses include electric utilities
- Financial info: Gross scheduled and annual rental income approximately $118,440; Annual gross income listed as $114,887; Gross rent multiplier 10.68; Total expenses approximately $42,488; Other expenses listed as $2,945; Utility expenses approximately $5,134; Landscape expense approximately $1,200; Vacancy factor 3%
Exterior
- Parking: Five assigned parking spaces; Covered parking; Tandem parking; Carport spaces (5)
- Utilities: Public water; Public sewer; Primary gas meter; Primary water meter; Separate electric meters
- Home design: One building; Multifamily property with five residential units
- Construction: Shingle composition roof; Concrete perimeter foundation
- Exterior features: Composition/shingle roof; Concrete perimeter foundation; R1B2 zoning; Tenant pays electric utility; Landscape expense listed
Interior
- Kitchen: Kitchens in each unit (approximate unit size indicates full kitchen)
- Bedrooms: Five 1-bedroom units
- Bathrooms: Each unit has one full bathroom
- Heating & cooling: Forced air heating; Wall furnace
- Interior features: Individual electric meters; Utilities paid by tenants: electricity
- Laundry & utility: Separate electric service for units
Neighborhood map
What this means for you Summary
Snapshot
- This is a 5 × 1-bed/1.0-bath units multifamily listed at $1.26M.
Deal economics
- At list price, monthly cash flow is $699 ($8k/yr) — positive. Per door: $140/mo.
- The deal already cash-flows at list — no discount required.
- To meet the 1% rule (rent ≥ 1% of price), the offer needs to be $1.12M (11.4% below list).
- Recommended offer: $1.12M (11.4% below list) — sets the bar for 1% rule.
- Cap rate 7.1% vs local median 1.6% in San Jose — top-decile yield for the area; either an underpriced asset or a hidden risk that comps aren't pricing in. Stress-test before assuming the spread holds.
Location & tenants
- Location reads 78/100 on livability (#68 in CA, #2,559 nationally) — a middle-class / working-renter tenant base. Strengths: amenities A+, commute A+, employment A+; Watch: crime F, cost of living F.
- Evergreen Elementary (urban): math 61% / reading 66% proficiency, ranked #132 of 1,400 in CA (top 9%) — acceptable for families but not a draw, mixed tenant base, ~2y average lease.
- Zoned schools: Evergreen Elementary (573 students, 13% FRL); Chaboya Middle (853 students, 14% FRL); Evergreen Valley High (math 76% / reading 83%, grade A-, #45 of 1,170 statewide, top 4%, 2,767 students, 13% FRL).
- Zoned-school proficiency averages 80% at this address vs 64% district-wide (+16 pts) — the actual schools serving this property are materially stronger than the Evergreen Elementary average implies; a family-tenant draw the district grade alone would hide.
- Market conditions: 80 active listings in the ZIP; 3,838 units permitted in Santa Clara County in 2024 (1,886 in 5+ unit buildings).
Forward outlook
- Local home prices are declining (-1.6%/yr); year-one equity from $9k of loan paydown is wiped out by about $20k of value loss. Plan a longer hold.
- Santa Clara County population projected at +24% by 2050 — long-run rental-demand tailwind backs the buy-and-hold thesis.
Negotiation context
- It's been on market 37 days — a 3% lower offer ($1.23M) is reasonable based on typical stale-listing flexibility.
- 2 sale attempts with the ask held roughly flat each time — persistent listings suggest the price (not the market) is what's stuck; bring a comps-based counter.
Risks & watch-outs
- Watch-outs: flood insurance adds $125/mo; built in 1945 — expect roof / HVAC / electrical / plumbing capex.
- Climate carrying-cost: in FEMA flood zone A (mandatory federal flood insurance); extreme-heat days projected 7→14/yr by 2055 (HVAC capex compounding) — expect insurance premiums to compound above CPI over the hold.
Questions for the listing agent
- It's been on market 37 days. Have you received any prior offers? Is the seller open to a 11% concession, seller financing, or rate buy-down credit?
- Can we see the unit-by-unit rent roll, current vacancy, and any below-market leases? What's the average tenancy length?
- What capital expenditures (roof, boiler, parking lot, exteriors) have been made in the last 5 years, and what's planned in the next 2?
- Built in 1945 — when were the roof, HVAC, electrical panel, plumbing, and water heater last replaced?
- What's the actual annual flood-insurance premium (NFIP or private), and is the property in a SFHA with mandatory coverage?
- Is there a deadline driving the sale (1031 exchange, divorce, estate, relocation)? That informs how much negotiation room exists.
- Crime grade is F in this area — have there been break-ins, vandalism, or insurance claims at this property in the last 3 years? What carrier currently insures it and at what premium?
- The area grade is low — what's the realistic commute time and amenity access for the typical tenant pool here? Any planned neighborhood developments (good or bad) we should know about?
- What's the average days-on-market for RENTAL listings here right now (not sales)? A rising rental-DOM trend means longer vacancies and softer asking-rent achievability than the comps imply.
- What's the recent tenant-quality profile in this submarket — average credit score on applications, eviction rate, late-payment / NSF rate, and stable-employment percentage? A property-management company in the area should have these aggregated.
- How much new apartment / multifamily construction is in the pipeline within 1–3 miles? Heavy new supply (>2% of stock underway) typically softens rents 12–24 months out; light construction supports rent growth.
Investment metrics
- 1% rule
- 0.89% ✗
- Cap rate
- 7.07%
- Cash-on-cash
- 2.79%
- DSCR
- 1.12
- GRM
- 9.4
CMA / ARV
- ARV (on-the-fly)
- $1,018,752
- Comps found
- 1
Show comp detail 1 sale within ~0.75 mi
| Address | Dist | Beds/Ba | Sqft | Sold | Price | $/sf | Match |
|---|---|---|---|---|---|---|---|
| 3557 San Felipe Rd | 0.00mi | 5/5.0 | 3,032 (0%) | 1mo | $1,020,000 | $336 | 99 |
Match score weights: distance 35% · size 25% · config 20% · recency 20%. Top-matched comps best support the ARV.
Projected returns pro-forma
-1.59% appreciation · 3.0% rent growth · sell at horizon
- IRR
- -5.7%
- Equity multiple
- 0.76×
- Total profit
- $-84,075
- Equity at exit
- $270,099
- IRR
- 1.7%
- Equity multiple
- 1.15×
- Total profit
- $53,106
- Equity at exit
- $254,568
Cash invested: $354,200 (down + closing). Projections, not guarantees.
Landlord ↔ Tenant lean methodology
- Overall (CITY)
- 0 Strongly Tenant-Friendly
- State California
- 18 Strongly Tenant-Friendly · D+13
- County
- — inherits STATE
- City San Jose
- 0 Strongly Tenant-Friendly · D+24
ZIP-level market 95135
- Home prices YoY
- -0.5%
- Active inventory
- 80
- Price-to-rent
- 47.0×
Monthly cashflow live
- Estimated rent
- $11,208 medium interval (Pro) →
- Mortgage (P&I)
- −$6,634
- Tax from tax record
- −$869 /mo · $10,433/yr
- Insurance
- −$527
- Flood insurance flood zone
- −$125 /mo · $1,502/yr
- HOA
- −$0
- Vacancy / Maint / Mgmt
- −$2,354
- Net cashflow
- $699
Break-even live
Sensitivity live
| Price | -10% $1,415 | -5% $1,057 | +0% $699 | +5% $341 | +10% $-17 |
|---|---|---|---|---|---|
| Rent | -10% $-187 | -5% $256 | +0% $699 | +5% $1,142 | +10% $1,584 |
| Rate | -1.0pp $1,336 | -0.5pp $1,021 | base $699 | +0.5pp $371 | +1.0pp $38 |
5-unit breakdown (identical units grouped — click to expand)
| Units | Beds | Baths | Est. rent |
|---|---|---|---|
| 5× units | 1 | 1 | $11,210 |
| #1 | 1 | 1 | $2,242 |
| #2 | 1 | 1 | $2,242 |
| #3 | 1 | 1 | $2,242 |
| #4 | 1 | 1 | $2,242 |
| #5 | 1 | 1 | $2,242 |
| Total (5 units) | $11,208 | ||
UW: 25.0% down · 7.5% · 30yr · 1.5% tax · 5.0% vac · 8.0% maint · 8.0% mgmt
Financing live
Cash to close
- Down payment
- $316,250
- Closing costs
- $37,950
- Reserves months
- —
- Total cash needed
- —
Loan-product check · same deal, 3 products live
Conventional
25% down · 7.5% · 30yr
- Down + closing
- —
- Monthly P&I
- —
- Monthly cashflow
- —
- DSCR
- —
- Eligible?
- —
Personal DTI + credit; lowest rate.
DSCR
20% down · 8.5% · 30yr
- Down + closing
- —
- Monthly P&I
- —
- Monthly cashflow
- —
- DSCR
- —
- Eligible?
- —
No personal income docs; deal must DSCR.
Hard money
10% down · 12.0% · 12mo
- Down + closing
- —
- Monthly P&I
- —
- Monthly cashflow
- —
- DSCR
- —
- Eligible?
- —
Short-term bridge; refi at stabilization.
Listing history 5 events
-
2026-06-01status $1,265,000 Pending 37 DOM
-
2026-05-07status Pending 560-char remark
Show marketing remark (560 chars)
3557 San Felipe Road is a charming 5-unit property located near the highly desireable Silver Creek area of San Jose. The property has a newer comp shingle roof (2020 with permit) and water heater (2024 with permit). All units are 1+1 with spacious layouts and ample closet space. Tenants benefit from a 2:1 on-site parking ratio and close proximity to recreation options such as Coyote Creek Trail, Evergreen Village Square and Duck Pond, and the 178 acre Hellyer County Park featuring playgrounds, dog park, hiking, picnic tables, fishing, biking, and courts.
-
2026-05-07status Pending (Do Not Show) 560-char remark
Show marketing remark (560 chars)
3557 San Felipe Road is a charming 5-unit property located near the highly desireable Silver Creek area of San Jose. The property has a newer comp shingle roof (2020 with permit) and water heater (2024 with permit). All units are 1+1 with spacious layouts and ample closet space. Tenants benefit from a 2:1 on-site parking ratio and close proximity to recreation options such as Coyote Creek Trail, Evergreen Village Square and Duck Pond, and the 178 acre Hellyer County Park featuring playgrounds, dog park, hiking, picnic tables, fishing, biking, and courts.
-
2026-03-30$1,265,000 Active 560-char remark
Show marketing remark (560 chars)
3557 San Felipe Road is a charming 5-unit property located near the highly desireable Silver Creek area of San Jose. The property has a newer comp shingle roof (2020 with permit) and water heater (2024 with permit). All units are 1+1 with spacious layouts and ample closet space. Tenants benefit from a 2:1 on-site parking ratio and close proximity to recreation options such as Coyote Creek Trail, Evergreen Village Square and Duck Pond, and the 178 acre Hellyer County Park featuring playgrounds, dog park, hiking, picnic tables, fishing, biking, and courts.
ⓘ Source: listings_history table (triggers on properties + properties_extension) + one-shot
backfill from property_details.listing_events for pre-trigger history.
Tax reassessment forecast CA · Resets to sale price
- Current annual tax
- $10,433 · $869/mo
- Projected year-2 tax
- $10,433 · $869/mo
- Expected delta
- $0/yr ($0/mo · 0.0%)
ⓘ Screening estimate from a state-policy table — verify with the county assessor before closing.
Climate risk First Street
- Flood 9/10 Extreme FEMA zone A · 79% chance over 30 yrs
- Wildfire 2/10 Low
- Heat 5/10 Major 7 d/yr ≥94°F today · 14 d/yr by 30 yrs out
- Wind 1/10 Low
- Air quality 9/10 Extreme 19 unhealthy d/yr today · 19 by 30 yrs out
Nearby sold comps map
Loading sold comps map…
Walkable amenities ~0.75 mi
Loading nearby amenities…
Taxation est. · year 1
- Rental income
- $134,496
- − Mortgage interest
- −$70,860
- − Property taxes
- −$10,433
- − Insurance
- −$7,828
- − Repairs & maintenance
- −$10,760
- − Management
- −$10,760
- − Depreciation
- −$36,800
- Taxable loss
- −$12,944
- Est. tax savings @ 24.0%
- +$3,106
- After-tax cash flow
- $11,492/yr
For passive investors: Depreciation is non-cash, so a rental often shows a tax loss while cash-flowing — sheltering income. Rental losses are passive: they offset passive income freely, and up to $25,000/yr can offset ordinary (W-2) income if you actively participate and your MAGI is under $100k (phasing out to $0 by $150k); unused losses carry forward. On sale, claimed depreciation is recaptured at up to 25%, and gains may owe capital-gains tax (a 1031 exchange can defer both). Figures are a year-1 estimate at your 24.0% rate — not tax advice; consult a CPA.
Schools (NCES district)
- District
- Evergreen Elementary
- NCES district ID
- 0613140
- Math proficiency
- 61% ▬ 0.00%
- Reading proficiency
- 66% ▲ 1.00%
- Median HH income
- $108,078
- Composite
- 60.98/100
- National rank
- #1615
- State rank
- #132 of 1400 in CA
Livability — San Jose
- Score
- 78/100
- State rank
- #68
- US rank
- #2559
Category grades
Schools grade is shown separately in the Schools card above.
Census & demographics
- Census place
- San Jose, CA
- City population
- 954,479
- Population (ZIP)
- 20,503
Population outlook (Santa Clara County) Hauer SSP2
- Today (2025)
- 2,179,074 people
- By 2030
- 2,301,297 · +5.6%
- By 2040
- 2,528,195 · +16.0%
- By 2050
- 2,712,135 · +24.5%
- By 2075
- 2,998,701 · +37.6%
- By 2100
- 2,931,429 · +34.5%
Race, ethnicity, and origin ACS 2023
- Neighborhood character
- Diverse neighborhood (Simpson 0.60)
- Race & ethnicity
- Asian 57% White 26% Hispanic / Latino 10% Two or more races 7% Black 3%
- Hispanic origin (detail)
- Mexican 6%
- Common ancestry
- Scotch-Irish 1% Italian 1% Lithuanian 1%
- Foreign-born
- 44% · China, Vietnam, Canada
- Languages at home
- 50% English-only · Chinese 11% Other Asian/Pacific 10% Other Indo-European 10%
Political lean MEDSL · Santa Clara
- 2024 margin
- Solid D (+40.0) · D 68.1% · R 28.1% · Other 3.8%
- 2008→2024 swing
- -0.9pp no change · 2008: 40.9pp · 2024: 40.0pp
- All cycles
- 2024: D+40.0 2020: D+47.4 2016: D+52.5 2012: D+42.1 2008: D+40.9
Not yet ingested
- Civics
- —
Market trends
- HPI YoY
- ▼ -1.59%
- Current HPI
- 332.7345
- Rent YoY
- —
- Metro
- —
- State GDP YoY
- ▲ 3.21%
- F500 in state
- 116
Industry mix (Fortune 500 HQ in CA)
| Industry | F500 HQs | Revenue |
|---|---|---|
| Technology | 27 | $1,492B |
|
||
| Financial Services | 3 | $174B |
|
||
| Retail | 3 | $44B |
|
||
| Insurance | 3 | $26B |
|
||
| Media / Entertainment | 2 | $115B |
|
||
| Pharmaceuticals / Biotech | 2 | $62B |
|
||
Price history
+0.0% since first listed4 events — show timeline
- 2026-05-07 Pending — bridgeMLS, Bay East AOR, or Contra Costa AOR
- 2026-05-07 Pending — MLSListings
- 2026-03-30 Listed $1,265,000 MLSListings
- 2026-03-30 Listed $1,265,000 bridgeMLS, Bay East AOR, or Contra Costa AOR
Property tax history
+5.1%/yrLatest (2025): $10,433 · +2.0% YoY. Source: county tax records.
Cash-flow waterfall
monthlySold comps — $/sqft
last 12 mo · ≤1 miLoading sold comps…