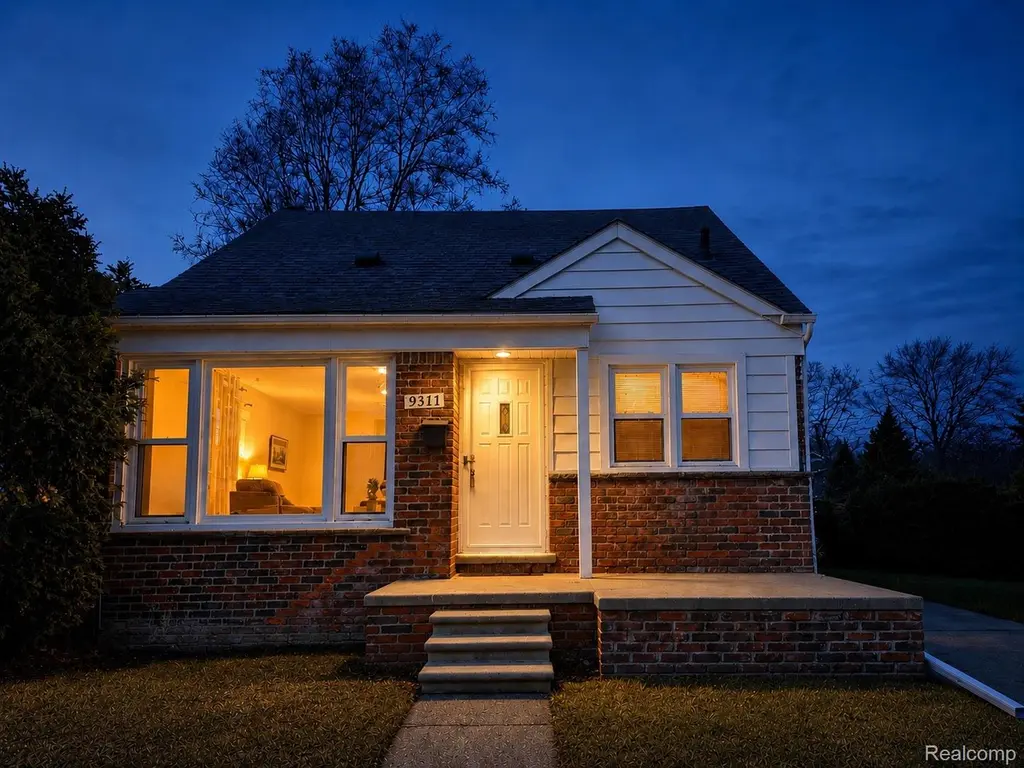
9311 Dixie · Redford, MI
Flood risk 1/10 · Minimal
- FEMA flood zone
- X (unshaded)
- Chance of flooding over 30 yrs
- 0.0%
- Est. flood insurance / yr
- $473 – $860
Fire risk 1/10 · Minimal
- Est. fire insurance / yr
- $784 – $1,456
Heat risk 3/10 · Minor
- Hot days now (above 98°F)
- 7 days/yr
- Hot days in 30 yrs
- 15 days/yr
Wind risk 2/10 · Minimal
- Chance of severe wind over 30 yrs
- —
Air-quality risk 3/10 · Minor
- Unhealthy air days now
- 2 days/yr
- Unhealthy air days in 30 yrs
- 3 days/yr
Risk factors via First Street. Map © Google.
Why this score? — see what drove the D grade
The composite is a weighted blend of 9 inputs, each scored 0–100. Each bar is that input's sub-score; the figure is the points it added to the 100-point composite (weight × sub-score).
- Cash flow +14.9/30.0
- ARV discount +9.8/15.0
- DSCR +4.6/10.0
- 1% rule +3.8/10.0
- Rent growth +3.3/5.0
- Livability +2.5/5.0
- Condition / age +2.5/5.0
- Schools +1.8/10.0
- Appreciation +0.0/10.0
$199,900
🖨 Deal sheet 📄 Offer letter ✓ Due diligence
Listing remarks MLS
Large Redford Bungalow! Step inside to a beautifully updated kitchen featuring brand new granite countertops, a striking custom backsplash, and sleek new tile flooring that flows seamlessly into the Breakfast/Dining area. The living room and main floor bedrooms boast stunning, refinished hardwood floors, complemented by fresh, neutral paint throughout. Updated Bathroom, with tile surround, new tub, tile floor and vanity. Upstairs you'll find new carpeting, unique built-in dressers, a cedar-lined closet, and a spacious deep closet for extra storage. The finished basement offers brand new carpet, a versatile bonus room and an office/library use your imagination of what this great space could be used for, relaxing or entertaining. Enjoy the outdoors in the large, fully fenced backyard - perfect for gatherings, pets, or play. A perfect blend of character, updates, and space in a great Redford location!
Key facts
- Custom backsplash
- Updated kitchen
- Tile flooring
Tags
Neighborhood map
What this means for you Summary
Snapshot
- This is a 3-bed/1.0-bath single-family listed at $200k.
Deal economics
- At list price, monthly cash flow is $58 ($696/yr) — positive.
- The deal already cash-flows at list — no discount required.
- To meet the 1% rule (rent ≥ 1% of price), the offer needs to be $175k (12.4% below list).
- Recommended offer: $175k (12.4% below list) — sets the bar for 1% rule.
Location & tenants
- Location reads: area grade D — affects rentability + tenant quality, not the cash-flow math above.
- South Redford School District (suburban): math 11% / reading 29% proficiency, ranked #455 of 540 in MI (top 84%) — low school quality limits family demand, transient renter base, plan for 1-2y turnover.
- Market conditions: Rents rising (+3.2%/yr); 188 active listings in the ZIP; 10 comparable units currently listed for rent nearby; rentals at typical pace (median 17d on market — plan ~3-4 weeks tenant-placement turnaround); 2,639 units permitted in Wayne County in 2024 (1,216 in 5+ unit buildings).
Forward outlook
- Local home prices are declining (-3.0%/yr); year-one equity from $1k of loan paydown is wiped out by about $6k of value loss. Plan a longer hold.
- Wayne County population projected at -17% by 2050 — secular population decline; favor cash flow + early exit over multi-decade hold.
Negotiation context
- It's been on market 96 days — a 9% lower offer ($182k) is reasonable based on typical stale-listing flexibility.
- 12 sale attempts since 22y ago with the ask held roughly flat each time — persistent listings suggest the price (not the market) is what's stuck; bring a comps-based counter.
- Current owner paid $75k; list at $200k implies a 167% gain — meaningful room to come down on a strong offer.
Risks & watch-outs
- Watch-outs: built in 1953 — expect roof / HVAC / electrical / plumbing capex.
Questions for the listing agent
- It's been on market 96 days. Have you received any prior offers? Is the seller open to a 12% concession, seller financing, or rate buy-down credit?
- Built in 1953 — when were the roof, HVAC, electrical panel, plumbing, and water heater last replaced?
- Why hasn't it sold? Are there any deal-killer items the seller is aware of (foundation, flood, title, zoning, code violations)?
- Is there a deadline driving the sale (1031 exchange, divorce, estate, relocation)? That informs how much negotiation room exists.
- The area grade is low — what's the realistic commute time and amenity access for the typical tenant pool here? Any planned neighborhood developments (good or bad) we should know about?
- What's the average days-on-market for RENTAL listings here right now (not sales)? A rising rental-DOM trend means longer vacancies and softer asking-rent achievability than the comps imply.
- What's the recent tenant-quality profile in this submarket — average credit score on applications, eviction rate, late-payment / NSF rate, and stable-employment percentage? A property-management company in the area should have these aggregated.
- How much new for-sale + rental construction is in the pipeline within 1–3 miles? Heavy new supply typically softens prices + rents 12–24 months out; constrained supply supports both.
Investment metrics
- 1% rule
- 0.88% ✗
- Cap rate
- 6.64%
- Cash-on-cash
- 1.24%
- DSCR
- 1.06
- GRM
- 9.5
CMA / ARV
- ARV (median comp)
- $210,890
- List price
- $199,900
- Delta
- -5.21%
- Verdict
- FAIR
- Comps
- 20 within 1.0 mi
Show comp detail 12 sales within ~0.75 mi
| Address | Dist | Beds/Ba | Sqft | Sold | Price | $/sf | Match |
|---|---|---|---|---|---|---|---|
| 9335 Louis St | 0.40mi | 3/1.5 | 1,267 (-1%) | 1mo | $255,000 | $201 | 77 |
| 9543 Lenore Ave | 0.25mi | 3/2.0 | 1,286 (+1%) | 8mo | $203,000 | $158 | 77 |
| 9043 Wormer | 0.32mi | 3/1.5 | 1,371 (+7%) | 4mo | $180,000 | $131 | 68 |
| 8931 Wormer | 0.36mi | 3/1.5 | 1,215 (-5%) | 7mo | $190,000 | $156 | 67 |
| 8476 Robindale Ave | 0.60mi | 3/1.0 | 1,304 (+2%) | 9mo | $180,000 | $138 | 61 |
| 10044 Arnold | 0.54mi | 3/1.0 | 1,213 (-5%) | 9mo | $159,990 | $132 | 59 |
| 9938 Royal Grand | 0.62mi | 3/1.0 | 1,219 (-5%) | 6mo | $197,000 | $162 | 58 |
| 9979 Virgil Ave | 0.72mi | 3/1.5 | 1,228 (-4%) | 7mo | $219,900 | $179 | 52 |
| 11391 Winston | 0.53mi | 3/1.5 | 1,443 (+13%) | 1mo | $136,000 | $94 | 51 |
| 9375 Riverview | 0.50mi | 3/1.5 | 1,108 (-13%) | 6mo | $210,000 | $190 | 48 |
| 8329 Lenore St | 0.69mi | 4/1.0 (+1) | 1,400 (+10%) | 5mo | $192,500 | $138 | 43 |
| 9025 Appleton | 0.60mi | 3/1.0 | 1,092 (-15%) | 6mo | $205,000 | $188 | 42 |
Match score weights: distance 35% · size 25% · config 20% · recency 20%. Top-matched comps best support the ARV.
Projected returns pro-forma
-3.0% appreciation · 3.25% rent growth · sell at horizon
- IRR
- -14.1%
- Equity multiple
- 0.50×
- Total profit
- $-28,266
- Equity at exit
- $29,806
- IRR
- -4.9%
- Equity multiple
- 0.68×
- Total profit
- $-18,068
- Equity at exit
- $17,284
Cash invested: $55,972 (down + closing). Projections, not guarantees.
Landlord ↔ Tenant lean methodology
- Overall (STATE)
- 62 Landlord-Friendly
- State Michigan
- 62 Landlord-Friendly · EVEN
- County
- — inherits STATE
- City
- — inherits STATE
ZIP-level market 48239
- Rents YoY
- 3.2%
- Active inventory
- 188
- Price-to-rent
- 9.5×
Monthly cashflow live
- Estimated rent
- $1,752 high interval (Pro) →
- Mortgage (P&I)
- −$1,048
- Tax from tax record
- −$194 /mo · $2,331/yr
- Insurance
- −$83
- HOA
- −$0
- Vacancy / Maint / Mgmt
- −$368
- Net cashflow
- $58
Break-even live
UW: 25.0% down · 7.5% · 30yr · 1.5% tax · 5.0% vac · 8.0% maint · 8.0% mgmt
Financing live
Cash to close
- Down payment
- $49,975
- Closing costs
- $5,997
- Reserves months
- —
- Total cash needed
- —
Loan-product check · same deal, 3 products live
Conventional
25% down · 7.5% · 30yr
- Down + closing
- —
- Monthly P&I
- —
- Monthly cashflow
- —
- DSCR
- —
- Eligible?
- —
Personal DTI + credit; lowest rate.
DSCR
20% down · 8.5% · 30yr
- Down + closing
- —
- Monthly P&I
- —
- Monthly cashflow
- —
- DSCR
- —
- Eligible?
- —
No personal income docs; deal must DSCR.
Hard money
10% down · 12.0% · 12mo
- Down + closing
- —
- Monthly P&I
- —
- Monthly cashflow
- —
- DSCR
- —
- Eligible?
- —
Short-term bridge; refi at stabilization.
Rent comps 10 comps
| Address | Beds | Baths | Sqft | Rent | $/sqft | DOM | Units | Dist |
|---|---|---|---|---|---|---|---|---|
| 8455 Robindale Ave Dearborn Heights, MI | 3.0 | 1.0 | 1100 | $1,750 | $1.59 | 4d | 1 | 0.59mi |
| 8402 Robindale Ave Dearborn Heights, MI | 3.0 | 1.0 | 1190 | $1,600 | $1.34 | 14d | 1 | 0.62mi |
| 25615 Tireman St Dearborn Heights, MI | 3.0 | 1.5 | 1855 | $1,900 | $1.02 | 43d | 1 | 1.05mi |
| 12107 Centralia Redford, MI | 3.0 | 1.0 | 912 | $1,800 | $1.97 | 43d | 1 | 1.12mi |
| 8254 W Parkway St Redford, MI | 3.0 | 1.0 | 1220 | $1,350 | $1.11 | 12d | 1 | 1.16mi |
| 7462 N Vernon St Dearborn Heights, MI | 4.0 | 1.0 | 1113 | $1,900 | $1.71 | 1d | 1 | 1.26mi |
| 7420 Drexel St Dearborn Heights, MI | 2.0 | 1.0 | 1080 | $1,700 | $1.57 | 43d | 1 | 1.31mi |
| 7420 Drexel St Dearborn Heights, MI | 2.0 | 1.0 | 1080 | $1,700 | $1.57 | 17d | 1 | 1.31mi |
| 7420 Drexel St Dearborn Heights, MI | 2.0 | 1.0 | 1080 | $1,600 | $1.48 | 4d | 1 | 1.31mi |
| 7618 Hazelton St Dearborn Heights, MI | 3.0 | 1.0 | 1310 | $1,700 | $1.30 | 17d | 1 | 1.41mi |
Listing history 45 events
-
2026-06-18days on market $199,900 Active 96 DOM
-
2026-06-17days on market $199,900 Active 95 DOM
-
2026-06-16days on market $199,900 Active 94 DOM
-
2026-06-15days on market $199,900 Active 93 DOM
-
2026-06-13days on market $199,900 Active 91 DOM
-
2026-06-09days on market $199,900 Active 87 DOM
-
2026-06-08days on market $199,900 Active 86 DOM
-
2026-06-07days on market $199,900 Active 85 DOM
-
2026-06-04days on market $199,900 Active 82 DOM
-
2026-06-03days on market $199,900 Active 81 DOM
-
2026-06-02days on market $199,900 Active 80 DOM
-
2026-06-01days on market $199,900 Active 79 DOM
-
2026-05-31days on market $199,900 Active 78 DOM
-
2026-04-30price $199,900 911-char remark
Show marketing remark (911 chars)
Large Redford Bungalow! Step inside to a beautifully updated kitchen featuring brand new granite countertops, a striking custom backsplash, and sleek new tile flooring that flows seamlessly into the Breakfast/Dining area. The living room and main floor bedrooms boast stunning, refinished hardwood floors, complemented by fresh, neutral paint throughout. Updated Bathroom, with tile surround, new tub, tile floor and vanity. Upstairs you'll find new carpeting, unique built-in dressers, a cedar-lined closet, and a spacious deep closet for extra storage. The finished basement offers brand new carpet, a versatile bonus room and an office/library use your imagination of what this great space could be used for, relaxing or entertaining. Enjoy the outdoors in the large, fully fenced backyard - perfect for gatherings, pets, or play. A perfect blend of character, updates, and space in a great Redford location!
-
2026-03-14$209,000 Active 911-char remark
Show marketing remark (911 chars)
Large Redford Bungalow! Step inside to a beautifully updated kitchen featuring brand new granite countertops, a striking custom backsplash, and sleek new tile flooring that flows seamlessly into the Breakfast/Dining area. The living room and main floor bedrooms boast stunning, refinished hardwood floors, complemented by fresh, neutral paint throughout. Updated Bathroom, with tile surround, new tub, tile floor and vanity. Upstairs you'll find new carpeting, unique built-in dressers, a cedar-lined closet, and a spacious deep closet for extra storage. The finished basement offers brand new carpet, a versatile bonus room and an office/library use your imagination of what this great space could be used for, relaxing or entertaining. Enjoy the outdoors in the large, fully fenced backyard - perfect for gatherings, pets, or play. A perfect blend of character, updates, and space in a great Redford location!
-
2025-10-15historical
-
2025-10-15historical
-
2025-07-02price $199,900
-
2025-07-02price $199,900
-
2025-06-25price $219,000
-
2025-06-24price $219,000
-
2025-06-15$224,900 Active
-
2025-06-15$224,900 Active
-
2025-06-10historical
-
2025-02-03soldstatus $75,000
-
2012-08-27soldstatus $29,000
-
2012-08-27soldstatus $29,000
-
2012-08-15historical
-
2012-02-03$29,500
-
2012-02-03$29,500
-
2011-09-01historical
-
2011-07-01historical
-
2011-06-23$29,500
-
2011-05-25historical
-
2011-05-25historical
-
2011-05-22$29,500
-
2010-03-15$50,000
-
2010-03-15$50,000
-
2005-03-02soldstatus $115,900
-
2004-11-29soldstatus $115,900
-
2004-09-09$117,900
-
2004-09-08historical
-
2004-07-14$124,900
ⓘ Source: listings_history table (triggers on properties + properties_extension) + one-shot
backfill from property_details.listing_events for pre-trigger history.
Tax reassessment forecast MI · Partial reset (capped growth)
- Current annual tax
- $2,331 · $194/mo
- Projected year-2 tax
- $2,705 · $225/mo
- Expected delta
- +$374/yr (+$31/mo · 16.0%)
ⓘ Screening estimate from a state-policy table — verify with the county assessor before closing.
Climate risk First Street
- Flood 1/10 Low FEMA zone X (unshaded) · 0% chance over 30 yrs
- Wildfire 1/10 Low
- Heat 3/10 Moderate 7 d/yr ≥98°F today · 15 d/yr by 30 yrs out
- Wind 2/10 Low
- Air quality 3/10 Moderate 2 unhealthy d/yr today · 3 by 30 yrs out
Nearby sold comps map
Loading sold comps map…
Walkable amenities ~0.75 mi
Loading nearby amenities…
Taxation est. · year 1
- Rental income
- $21,020
- − Mortgage interest
- −$11,198
- − Property taxes
- −$2,331
- − Insurance
- −$1,000
- − Repairs & maintenance
- −$1,682
- − Management
- −$1,682
- − Depreciation
- −$5,815
- Taxable loss
- −$2,686
- Est. tax savings @ 24.0%
- +$645
- After-tax cash flow
- $1,341/yr
For passive investors: Depreciation is non-cash, so a rental often shows a tax loss while cash-flowing — sheltering income. Rental losses are passive: they offset passive income freely, and up to $25,000/yr can offset ordinary (W-2) income if you actively participate and your MAGI is under $100k (phasing out to $0 by $150k); unused losses carry forward. On sale, claimed depreciation is recaptured at up to 25%, and gains may owe capital-gains tax (a 1031 exchange can defer both). Figures are a year-1 estimate at your 24.0% rate — not tax advice; consult a CPA.
Schools (NCES district)
- District
- South Redford School District
- NCES district ID
- 2632280
- Math proficiency
- 11% ▼ -9.00%
- Reading proficiency
- 29% ▼ -7.00%
- Median HH income
- $52,775
- Composite
- 18.1/100
- National rank
- #8972
- State rank
- #455 of 540 in MI
Livability — Redford
No livability data for this city. (Only ~50 U.S. cities are tracked.)
Census & demographics
- County
- Wayne County · 1,562,939 people
- City population
- 36,976
- Metro
- Detroit-Warren-Dearborn, MI
- Population (ZIP)
- 36,976
- Household income
- $71,151
- Rent vs Own
- Severe rent burden
- 1052.0
Population outlook (Wayne County) Hauer SSP2
- Today (2025)
- 1,675,273 people
- By 2030
- 1,620,300 · -3.3%
- By 2040
- 1,502,341 · -10.3%
- By 2050
- 1,384,039 · -17.4%
- By 2075
- 1,124,592 · -32.9%
- By 2100
- 881,193 · -47.4%
Race, ethnicity, and origin ACS 2023
- Neighborhood character
- Majority Black (58%)
- Race & ethnicity
- Black 58% White 34% Hispanic / Latino 4% Two or more races 4%
- Common ancestry
- Romanian 7% Slovak 2% Lithuanian 2%
- Foreign-born
- 2% · Canada
- Languages at home
- 96% English-only · Spanish 1% Other Indo-European 1% Arabic 1%
Political lean MEDSL · Wayne
- 2024 margin
- Strong D (+29.0) · D 62.7% · R 33.7% · Other 3.6%
- 2008→2024 swing
- -20.5pp toward R · 2008: 49.5pp · 2024: 29.0pp
- All cycles
- 2024: D+29.0 2020: D+38.1 2016: D+37.3 2012: D+46.9 2008: D+49.5
Not yet ingested
- Civics
- —
Market trends
- HPI YoY
- ▼ -202.97%
- Current HPI
- 236.1136
- Rent YoY
- ▲ 3.25%
- Metro
- Detroit-Warren-Dearborn, MI
- State GDP YoY
- ▲ 1.37%
- F500 in state
- 28
Industry mix (Fortune 500 HQ in MI)
| Industry | F500 HQs | Revenue |
|---|---|---|
| Automotive Parts | 3 | $48B |
|
||
| Automotive | 2 | $372B |
|
||
| Chemicals | 1 | $45B |
|
||
| Automotive Retail | 1 | $29B |
|
||
| Healthcare / Medical Devices | 1 | $23B |
|
||
| Automotive Technology | 1 | $20B |
|
||
Price history
+60.0% since first listed32 events — show timeline
- 2026-04-30 Price Changed $199,900 MiRealSource-MiMLS
- 2026-04-30 Price Changed $199,900 REALCOMP
- 2026-03-14 Listed $209,000 REALCOMP
- 2026-03-14 Listed $209,000 MiRealSource-MiMLS
- 2025-10-15 Listing Removed — MiRealSource-MiMLS
- 2025-10-15 Listing Removed — REALCOMP
- 2025-07-02 Price Changed $199,900 MiRealSource-MiMLS
- 2025-07-02 Price Changed $199,900 REALCOMP
- 2025-06-25 Price Changed $219,000 MiRealSource-MiMLS
- 2025-06-24 Price Changed $219,000 REALCOMP
- 2025-06-15 Listed $224,900 MiRealSource-MiMLS
- 2025-06-15 Listed $224,900 REALCOMP
- 2025-06-10 Coming Soon — MiRealSource-MiMLS
- 2025-02-03 Sold (Public Records) $75,000 Public Records
- 2012-08-27 Sold (MLS) $29,000 REALCOMP
- 2012-08-27 Sold (MLS) $29,000 MiRealSource-MiMLS
- 2012-08-15 Listing Removed — MiRealSource-MiMLS
- 2012-02-03 Listed $29,500 REALCOMP
- 2012-02-03 Listed $29,500 MiRealSource-MiMLS
- 2011-09-01 Listing Removed — REALCOMP
- 2011-07-01 Listing Removed — MiRealSource-MiMLS
- 2011-06-23 Listed $29,500 REALCOMP
- 2011-05-25 Listing Removed — REALCOMP
- 2011-05-25 Listing Removed — MiRealSource-MiMLS
- 2011-05-22 Listed $29,500 MiRealSource-MiMLS
- 2010-03-15 Listed $50,000 REALCOMP
- 2010-03-15 Listed $50,000 MiRealSource-MiMLS
- 2005-03-02 Sold (Public Records) $115,900 Public Records
- 2004-11-29 Sold (MLS) $115,900 REALCOMP
- 2004-09-09 Listed $117,900 REALCOMP
- 2004-09-08 Listing Removed — REALCOMP
- 2004-07-14 Listed $124,900 REALCOMP
Property tax history
+1.6%/yrLatest (2025): $2,331 · -25.6% YoY. Source: county tax records.
Cash-flow waterfall
monthlySold comps — $/sqft
last 12 mo · ≤1 miLoading sold comps…