8932 Gulf St · Rotonda, FL
Flood risk 10/10 · Severe
- FEMA flood zone
- AE
- Chance of flooding over 30 yrs
- 0.99%
- Est. flood insurance / yr
- $1,737 – $8,500
Fire risk 1/10 · Minimal
- Est. fire insurance / yr
- $947 – $1,759
Heat risk 10/10 · Severe
- Hot days now (above 107°F)
- 7 days/yr
- Hot days in 30 yrs
- 26 days/yr
Wind risk 10/10 · Severe
- Chance of severe wind over 30 yrs
- 99.0%
Air-quality risk 3/10 · Minor
- Unhealthy air days now
- 2 days/yr
- Unhealthy air days in 30 yrs
- 2 days/yr
Risk factors via First Street. Map © Google.
Why this score? — see what drove the B+ grade
The composite is a weighted blend of 9 inputs, each scored 0–100. Each bar is that input's sub-score; the figure is the points it added to the 100-point composite (weight × sub-score).
- Cash flow +27.0/30.0
- ARV discount +15.0/15.0
- DSCR +9.3/10.0
- 1% rule +7.3/10.0
- Schools +4.6/10.0
- Appreciation +4.0/10.0
- Condition / age +3.8/5.0
- Livability +3.4/5.0
- Rent growth +2.5/5.0
$599,000
🖨 Deal sheet (PDF) 📄 Offer letter ✓ Due diligence
Listing remarks
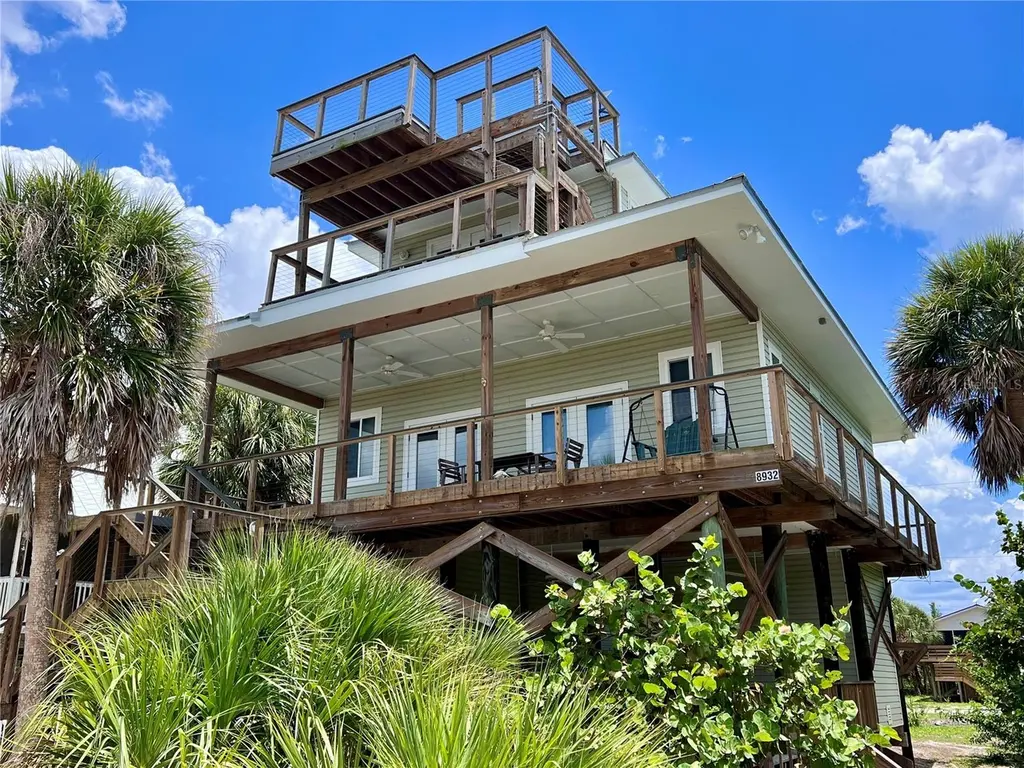
Exceptional price on this lovingly maintained 3 bedroom, 2 bath home located on Little Gasparilla Island, a bridgeless barrier island off the Cape Haze Peninsula, accessible by private boat or water taxi only, offering a tranquil escape from the hustle and bustle of the mainland. This well-built home was constructed in 2008 and has many wonderful features like a large elevated deck with a garage that has storage for yard equipment, a workshop area, and room to store the golf cart (golf cart stays with the house), another large storage room for fishing tackle and beach gear, and another room that is the outdoor shower, perfect after a day on the boat or the beach to rinse off. The first leve
Key facts
- Private balcony
- Outdoor shower
- Crows-nest
Tags
Property features AI
Finance
- Other: Property type: Residential, single family; Lot roughly 0.11 acres (50 x 100); Partial water views (bay/harbor, gulf/ocean, intracoastal) with water access; Home is on a bridgeless barrier island accessible by private boat or water taxi only; Furnished
- HOA & community: No association (HOA) indicated; Pets allowed: cats and dogs
Exterior
- Parking: Attached garage; Garage includes golf cart parking and golf cart garage; Garage faces side; Workshop space in garage; 1 garage space; Basement parking noted
- Utilities: Public water; Septic tank sewer; Electricity connected; Water connected
- Home design: Single family residence; Two stories; Stilt / on piling foundation; North-facing
- Construction: Vinyl siding and frame construction; Metal roof
- Exterior features: Balcony; French doors; Outdoor shower; Exterior lighting; Exterior storage
Interior
- Kitchen: Dishwasher; Microwave; Range; Refrigerator; Eat-in kitchen configuration
- Bedrooms: 3 bedrooms
- Flooring: Laminate flooring
- Bathrooms: 2 full bathrooms
- Heating & cooling: Central heating (electric); Central air conditioning
- Interior features: Ceiling fans; Eat-in kitchen; High ceilings; Kitchen/family room combo; Living room/dining room combo; Inside utility and storage rooms
- Laundry & utility: Washer and dryer included; Laundry closet; Inside laundry
Neighborhood map
What this means for you Summary
Snapshot
- This is a 3-bed/2.0-bath single-family listed at $599k. Condition is rated good.
Deal economics
- At list price, monthly cash flow is $1k ($15k/yr) — positive.
- The deal already cash-flows at list — no discount required.
- Meets the 1% rule at list price ($7k rent vs $599k).
- Recommended offer: $590k (1.5% below list) — sets the bar for market timing.
- Cap rate 9.6% vs local median 3.1% in Rotonda — top-decile yield for the area; either an underpriced asset or a hidden risk that comps aren't pricing in. Stress-test before assuming the spread holds.
Location & tenants
- Location reads 67/100 on livability (#548 in FL) — a middle-class / working-renter tenant base. Strengths: crime A+, housing A-, cost of living B+; Watch: amenities F, commute F, health & safety D-.
- Charlotte (suburban): math 54% / reading 54% proficiency, ranked #22 of 73 in FL (top 30%) — acceptable for families but not a draw, mixed tenant base, ~2y average lease.
- Zoned schools: Vineland Elementary School (math 74% / reading 67%, grade A-, #333 of 2,144 statewide, top 16%, 579 students, 45% FRL); Lemon Bay High School (math 50% / reading 56%, grade C-, #148 of 667 statewide, top 23%, 1,360 students, 28% FRL) — zoned schools average 37% FRL vs 54% district-wide (17 pts lower); this property's tenant base skews higher-income than the district average.
- Market conditions: 915 active listings in the ZIP; 7 comparable units currently listed for rent nearby; rentals at typical pace (median 22d on market — plan ~3-4 weeks tenant-placement turnaround); 4,585 units permitted in Charlotte County in 2024 (703 in 5+ unit buildings).
Forward outlook
- Local home prices are declining (-1.9%/yr); year-one equity from $4k of loan paydown is wiped out by about $11k of value loss. Plan a longer hold.
- Charlotte County population projected at +24% by 2050 — long-run rental-demand tailwind backs the buy-and-hold thesis.
- At projected returns (-1.9% appreciation + 3.0% rent growth), your $168k cash investment doubles in ~10 years — after that, you're playing with house money.
Negotiation context
- It's been on market 29 days — a 2% lower offer ($590k) is reasonable based on typical stale-listing flexibility.
Risks & watch-outs
- Watch-outs: flood insurance adds $427/mo.
- Climate carrying-cost: in FEMA flood zone AE (mandatory federal flood insurance); severe wind risk, 99% chance of damaging wind over 30y; extreme-heat days projected 7→26/yr by 2055 (HVAC capex compounding) — expect insurance premiums to compound above CPI over the hold.
Questions for the listing agent
- What's the actual annual flood-insurance premium (NFIP or private), and is the property in a SFHA with mandatory coverage?
- Is there a deadline driving the sale (1031 exchange, divorce, estate, relocation)? That informs how much negotiation room exists.
- Schools are D-rated, which usually means shorter tenancies and higher turnover. Who's the typical renter profile here, and what's been the actual vacancy rate?
- What's the average days-on-market for RENTAL listings here right now (not sales)? A rising rental-DOM trend means longer vacancies and softer asking-rent achievability than the comps imply.
- What's the recent tenant-quality profile in this submarket — average credit score on applications, eviction rate, late-payment / NSF rate, and stable-employment percentage? A property-management company in the area should have these aggregated.
- How much new for-sale + rental construction is in the pipeline within 1–3 miles? Heavy new supply typically softens prices + rents 12–24 months out; constrained supply supports both.
Investment metrics
- 1% rule
- 1.23% ✓
- Cap rate
- 9.64%
- Cash-on-cash
- 11.95%
- DSCR
- 1.53
- GRM
- 6.8
CMA / ARV
- ARV (on-the-fly)
- $1,058,286
- Comps found
- 2
Show comp detail 2 sales within ~0.75 mi
| Address | Dist | Beds/Ba | Sqft | Sold | Price | $/sf | Match |
|---|---|---|---|---|---|---|---|
| 8770 King St | 0.15mi | 3/2.0 | 1,586 (+13%) | 7mo | $1,200,000 | $757 | 64 |
| 9444 Rum Runner Rd | 0.73mi | 3/2.0 | 1,260 (-10%) | 15mo | $522,000 | $414 | 37 |
Match score weights: distance 35% · size 25% · config 20% · recency 20%. Top-matched comps best support the ARV.
Projected returns pro-forma
-1.9% appreciation · 3.0% rent growth · sell at horizon
- IRR
- 1.5%
- Equity multiple
- 1.06×
- Total profit
- $10,451
- Equity at exit
- $119,023
- IRR
- 9.3%
- Equity multiple
- 1.82×
- Total profit
- $137,649
- Equity at exit
- $104,291
Cash invested: $167,720 (down + closing). Projections, not guarantees.
Landlord ↔ Tenant lean methodology
- Overall (STATE)
- 87 Strongly Landlord-Friendly
- State Florida
- 87 Strongly Landlord-Friendly · R+3
- County
- — inherits STATE
- City
- — inherits STATE
ZIP-level market 33946
- Home prices YoY
- -0.7%
- Active inventory
- 915
- Price-to-rent
- 6.8×
Monthly cashflow live
- Estimated rent
- $7,354 high interval (Pro) →
- Mortgage (P&I)
- −$3,141
- Tax est. 1.5%
- −$749 /mo · $8,985/yr
- Insurance
- −$250
- Flood insurance flood zone
- −$427 /mo · $5,118/yr
- HOA
- −$0
- Vacancy / Maint / Mgmt
- −$1,544
- Net cashflow
- $1,244
Break-even live
Sensitivity live
| Price | -10% $1,658 | -5% $1,451 | +0% $1,244 | +5% $1,037 | +10% $830 |
|---|---|---|---|---|---|
| Rent | -10% $663 | -5% $953 | +0% $1,244 | +5% $1,534 | +10% $1,825 |
| Rate | -1.0pp $1,545 | -0.5pp $1,396 | base $1,244 | +0.5pp $1,089 | +1.0pp $931 |
UW: 25.0% down · 7.5% · 30yr · 1.5% tax · 5.0% vac · 8.0% maint · 8.0% mgmt
Financing live
Cash to close
- Down payment
- $149,750
- Closing costs
- $17,970
- Reserves months
- —
- Total cash needed
- —
Loan-product check · same deal, 3 products live
Conventional
25% down · 7.5% · 30yr
- Down + closing
- —
- Monthly P&I
- —
- Monthly cashflow
- —
- DSCR
- —
- Eligible?
- —
Personal DTI + credit; lowest rate.
DSCR
20% down · 8.5% · 30yr
- Down + closing
- —
- Monthly P&I
- —
- Monthly cashflow
- —
- DSCR
- —
- Eligible?
- —
No personal income docs; deal must DSCR.
Hard money
10% down · 12.0% · 12mo
- Down + closing
- —
- Monthly P&I
- —
- Monthly cashflow
- —
- DSCR
- —
- Eligible?
- —
Short-term bridge; refi at stabilization.
Rent comps 7 comps
| Address | Beds | Baths | Sqft | Rent | $/sqft | DOM | Units | Dist |
|---|---|---|---|---|---|---|---|---|
| 9400 Little Gasparilla Unit F9 Placida, FL | 2.0 | 2.0 | 946 | $6,500 | $6.87 | 22d | 1 | 0.66mi |
| 9400 Little Gasparilla Unit H8 Placida, FL | 2.0 | 2.0 | 946 | $5,850 | $6.18 | 22d | 1 | 0.66mi |
| 9400 Little Gasparilla Unit G9 Placida, FL | 2.0 | 2.0 | 946 | $6,900 | $7.29 | 22d | 1 | 0.70mi |
| 9498 Alborado Rd Placida, FL | 3.0 | 3.0 | 1780 | $8,500 | $4.78 | 22d | 1 | 0.89mi |
| 550 Gaspar Dr Placida, FL | 3.0 | 3.0 | 1803 | $5,500 | $3.05 | 22d | 1 | 0.91mi |
| 9750 Little Gasparilla Placida, FL | 3.0 | 1.5 | 957 | $10,000 | $10.45 | 22d | 1 | 0.98mi |
| 11 Amberjack Ln Placida, FL | 3.0 | 2.0 | 1786 | $2,700 | $1.51 | 14d | 1 | 1.47mi |
Listing history 18 events
-
2026-06-18status $599,000 Pending 29 DOM
-
2026-06-18days on market $599,000 Active 29 DOM
-
2026-06-17days on market $599,000 Active 28 DOM
-
2026-06-16days on market $599,000 Active 27 DOM
-
2026-06-15days on market $599,000 Active 26 DOM
-
2026-06-14days on market $599,000 Active 24 DOM
-
2026-06-13days on market $599,000 Active 23 DOM
-
2026-06-10days on market $599,000 Active 21 DOM
-
2026-06-09days on market $599,000 Active 20 DOM
-
2026-06-08days on market $599,000 Active 19 DOM
-
2026-06-07days on market $599,000 Active 18 DOM
-
2026-06-05days on market $599,000 Active 15 DOM
-
2026-06-03days on market $599,000 Active 14 DOM
-
2026-06-02days on market $599,000 Active 13 DOM
-
2026-06-01days on market $599,000 Active 12 DOM
-
2026-05-31days on market $599,000 Active 11 DOM
-
2026-05-30days on market $599,000 Active 10 DOM
-
2026-05-20$599,000 Active
ⓘ Source: listings_history table (triggers on properties + properties_extension) + one-shot
backfill from property_details.listing_events for pre-trigger history.
Climate risk First Street
- Flood 10/10 Extreme FEMA zone AE · 99% chance over 30 yrs
- Wildfire 1/10 Low
- Heat 10/10 Extreme 7 d/yr ≥107°F today · 26 d/yr by 30 yrs out
- Wind 10/10 Extreme 99% chance of damaging wind over 30 yrs
- Air quality 3/10 Moderate 2 unhealthy d/yr today · 2 by 30 yrs out
Nearby sold comps map
Loading sold comps map…
Walkable amenities ~0.75 mi
Loading nearby amenities…
Taxation est. · year 1
- Rental income
- $88,251
- − Mortgage interest
- −$33,553
- − Property taxes
- −$8,985
- − Insurance
- −$8,114
- − Repairs & maintenance
- −$7,060
- − Management
- −$7,060
- − Depreciation
- −$17,425
- Taxable income
- $6,053
- Est. tax owed @ 24.0%
- −$1,453
- After-tax cash flow
- $13,472/yr
For passive investors: Depreciation is non-cash, so a rental often shows a tax loss while cash-flowing — sheltering income. Rental losses are passive: they offset passive income freely, and up to $25,000/yr can offset ordinary (W-2) income if you actively participate and your MAGI is under $100k (phasing out to $0 by $150k); unused losses carry forward. On sale, claimed depreciation is recaptured at up to 25%, and gains may owe capital-gains tax (a 1031 exchange can defer both). Figures are a year-1 estimate at your 24.0% rate — not tax advice; consult a CPA.
Condition & rehab AI · 6 photos
This well-maintained home on Little Gasparilla Island offers a tranquil escape with a good condition and minimal repairs needed.
Value-add opportunities
- Both Paint exterior — Enhances curb appeal and value
- Both Landscaping maintenance — Improves curb appeal and enhances property value
Renovation cost estimate screening
Value-add ROI direction
- Both Paint exterior — Enhances curb appeal and value ↑
- Both Landscaping maintenance — Improves curb appeal and enhances property value ↑
ⓘ Cost ranges are severity-bucket heuristics (US national rule-of-thumb). Get contractor quotes + a written scope before underwriting a rehab budget.
Schools (NCES district)
- District
- Charlotte
- NCES district ID
- 1200240
- Math proficiency
- 54% ▼ -6.00%
- Reading proficiency
- 54% ▼ -1.00%
- Median HH income
- $44,864
- Composite
- 45.62/100
- National rank
- #2586
- State rank
- #22 of 73 in FL
Livability — Rotonda
- Score
- 67/100
- State rank
- #548
- US rank
- #10359
Category grades
Schools grade is shown separately in the Schools card above.
Census & demographics
- City population
- 10,490
- Population (ZIP)
- 2,745
Population outlook (Charlotte County) Hauer SSP2
- Today (2025)
- 198,646 people
- By 2030
- 210,507 · +6.0%
- By 2040
- 230,857 · +16.2%
- By 2050
- 247,148 · +24.4%
- By 2075
- 281,777 · +41.8%
- By 2100
- 293,609 · +47.8%
Race, ethnicity, and origin ACS 2023
- Neighborhood character
- Predominantly White (95%)
- Race & ethnicity
- White 95% Hispanic / Latino 2% Asian 1% Two or more races 1%
- Common ancestry
- Italian 3% Romanian 2% Russian 2%
- Foreign-born
- 6% · Canada
- Languages at home
- 91% English-only · Russian/Polish/Slavic 5% Spanish 1% French/Haitian/Cajun 1%
Political lean MEDSL · Charlotte
- 2024 margin
- Solid R (+34.0) · D 32.7% · R 66.7%
- 2008→2024 swing
- -26.7pp toward R · 2008: -7.2pp · 2024: -34.0pp
- All cycles
- 2024: R+34.0 2020: R+26.6 2016: R+27.8 2012: R+14.3 2008: R+7.2
Not yet ingested
- Civics
- —
Market trends
- HPI YoY
- ▼ -1.90%
- Current HPI
- 288.559
- Rent YoY
- —
- Metro
- —
- State GDP YoY
- ▲ 3.28%
- F500 in state
- 36
Industry mix (Fortune 500 HQ in FL)
| Industry | F500 HQs | Revenue |
|---|---|---|
| Industrial Technology | 2 | $29B |
|
||
| Insurance | 2 | $17B |
|
||
| Retail | 1 | $60B |
|
||
| Technology Distribution | 1 | $58B |
|
||
| Homebuilding | 1 | $35B |
|
||
| Technology Manufacturing | 1 | $35B |
|
||
Price history
1 event — show timeline
- 2026-05-20 Listed $599,000 Stellar MLS as Distributed by MLS Grid
Cash-flow waterfall
monthlySold comps — $/sqft
last 12 mo · ≤1 miLoading sold comps…