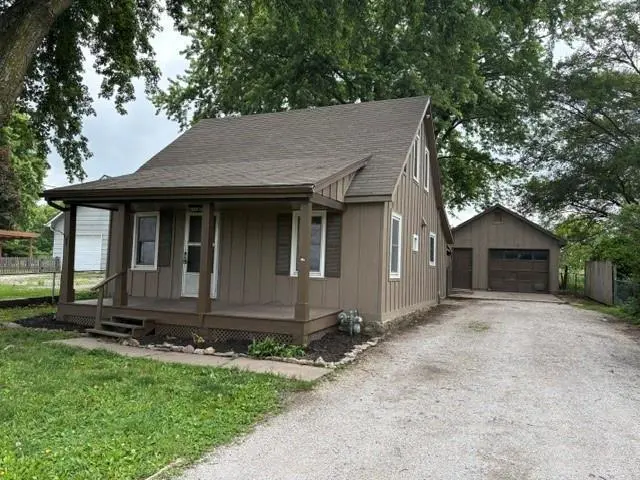
12217 H Hwy · Prathersville, MO
Flood risk 1/10 · Minimal
- FEMA flood zone
- X (unshaded)
- Chance of flooding over 30 yrs
- 0.0%
- Est. flood insurance / yr
- $507 – $1,088
Fire risk 2/10 · Minimal
- Est. fire insurance / yr
- $1,054 – $1,958
Heat risk 4/10 · Minor
- Hot days now (above 107°F)
- 7 days/yr
- Hot days in 30 yrs
- 16 days/yr
Wind risk 2/10 · Minimal
- Chance of severe wind over 30 yrs
- —
Air-quality risk 3/10 · Minor
- Unhealthy air days now
- 4 days/yr
- Unhealthy air days in 30 yrs
- 4 days/yr
Risk factors via First Street. Map © Google.
Why this score? — see what drove the B- grade
The composite is a weighted blend of 9 inputs, each scored 0–100. Each bar is that input's sub-score; the figure is the points it added to the 100-point composite (weight × sub-score).
- Cash flow +29.7/30.0
- DSCR +10.0/10.0
- 1% rule +7.6/10.0
- ARV discount +7.5/15.0
- Livability +3.1/5.0
- Schools +2.9/10.0
- Rent growth +2.5/5.0
- Condition / age +2.5/5.0
- Appreciation +0.0/10.0
$100,000
🖨 Deal sheet 📄 Offer letter ✓ Due diligence
Listing remarks MLS
Cute, quiet, small town home. Covered front porch, covered patio getaway in back. Classic interior features big living room/dining room area. Paint just freshened up and wood floors just refinished. Updated bath & kitchen. Good sized master with huge walk in closet. NEW/ NEWER: roof, paint in/out, electrical service/panel, lights, fan, switches, outlets, vanity, faucets, counters, flooring, newer vinyl windows & newer furnace.
Key facts
- Thermal windows
- Water heater
- Updated furnace
Tags
Property features AI
Finance
- Other: Approximately 972 above-grade living area (public records); Lot dimensions about 50 x 110 (public records); Lot size about 6,098 square feet; Home age listed as 101+ years; Seller provides a home warranty (Old Republic) with $100 deductible (cost $535)
- HOA & community: No association fees
Exterior
- Parking: Detached 1-car garage
- Utilities: Public water; Septic tank sewer
- Home design: Single family residence; 1.5-story home; Residential property
- Construction: Frame construction; Composition roof
- Exterior features: Covered patio; Level lot; Metal and wood fencing
Interior
- Kitchen: Gas range; Free-standing electric oven; Refrigerator; Exhaust fan
- Bedrooms: 3 bedrooms total; Primary bedroom on second level with walk-in closet and wood flooring; Bedroom 2 on first level with wood flooring; Bedroom 3 on first level with vinyl flooring
- Flooring: Wood flooring in several rooms; Vinyl flooring in kitchen, bathroom, and one bedroom
- Bathrooms: 1 full bathroom
- Heating & cooling: Natural gas heating; Electric cooling (central AC)
- Interior features: Ceiling fans; Walk-in closet(s); Formal dining area; Crawl space basement
- Laundry & utility: Laundry on main level, located off the kitchen
Neighborhood map
What this means for you Summary
Snapshot
- This is a 2-bed/1.0-bath single-family listed at $100k.
Deal economics
- At list price, monthly cash flow is $363 ($4k/yr) — positive.
- The deal already cash-flows at list — no discount required.
- Meets the 1% rule at list price ($1k rent vs $100k).
Location & tenants
- Location reads 62/100 on livability (#383 in MO) — a middle-class / working-renter tenant base. Strengths: housing A+, cost of living A, employment B+; Watch: schools D-, amenities F, commute F.
- Excelsior Springs 40 (town): math 27% / reading 40% proficiency, ranked #225 of 324 in MO (top 69%) — families likely to look elsewhere, expect single-tenant / working-renter base with shorter leases.
- Market conditions: 122 active listings in the ZIP; solid renter incomes; 341 units permitted in Clay County in 2024 (40 in 5+ unit buildings).
Forward outlook
- Local home prices are declining (-3.0%/yr); year-one equity from $691 of loan paydown is wiped out by about $3k of value loss. Plan a longer hold.
- Clay County population projected at +24% by 2050 — long-run rental-demand tailwind backs the buy-and-hold thesis.
- At projected returns (-3.0% appreciation + 3.0% rent growth), your $28k cash investment doubles in ~8 years — after that, you're playing with house money.
Negotiation context
- Only 6 days on market — expect competitive offers; lowballing is unlikely to land.
- 6 sale attempts since 26y ago; this cycle's ask has dropped $25k (20%) from the opening price — seller is motivated, your offer sets the floor, not the list.
Risks & watch-outs
- Watch-outs: built in 1900 — expect roof / HVAC / electrical / plumbing capex.
Questions for the listing agent
- Built in 1900 — when were the roof, HVAC, electrical panel, plumbing, and water heater last replaced?
- Is there a deadline driving the sale (1031 exchange, divorce, estate, relocation)? That informs how much negotiation room exists.
- Schools are D-rated, which usually means shorter tenancies and higher turnover. Who's the typical renter profile here, and what's been the actual vacancy rate?
- What's the average days-on-market for RENTAL listings here right now (not sales)? A rising rental-DOM trend means longer vacancies and softer asking-rent achievability than the comps imply.
- What's the recent tenant-quality profile in this submarket — average credit score on applications, eviction rate, late-payment / NSF rate, and stable-employment percentage? A property-management company in the area should have these aggregated.
- How much new for-sale + rental construction is in the pipeline within 1–3 miles? Heavy new supply typically softens prices + rents 12–24 months out; constrained supply supports both.
Investment metrics
- 1% rule
- 1.26% ✓
- Cap rate
- 10.65%
- Cash-on-cash
- 15.56%
- DSCR
- 1.69
- GRM
- 6.6
CMA / ARV
- ARV (on-the-fly)
- $242,028
- Comps found
- 1
Show comp detail 1 sale within ~0.75 mi
| Address | Dist | Beds/Ba | Sqft | Sold | Price | $/sf | Match |
|---|---|---|---|---|---|---|---|
| 11905 H Hwy | 0.50mi | 3/1.0 (+1) | 864 (-11%) | 19mo | $215,000 | $249 | 37 |
Match score weights: distance 35% · size 25% · config 20% · recency 20%. Top-matched comps best support the ARV.
Projected returns pro-forma
-3.0% appreciation · 3.0% rent growth · sell at horizon
- IRR
- 6.3%
- Equity multiple
- 1.25×
- Total profit
- $6,907
- Equity at exit
- $14,910
- IRR
- 15.7%
- Equity multiple
- 2.28×
- Total profit
- $35,725
- Equity at exit
- $8,646
Cash invested: $28,000 (down + closing). Projections, not guarantees.
Landlord ↔ Tenant lean methodology
- Overall (STATE)
- 81 Strongly Landlord-Friendly
- State Missouri
- 81 Strongly Landlord-Friendly · R+10
- County
- — inherits STATE
- City
- — inherits STATE
ZIP-level market 64024
- Home prices YoY
- -15.3%
- Active inventory
- 122
- Price-to-rent
- 6.6×
Monthly cashflow live
- Estimated rent
- $1,259 medium interval (Pro) →
- Mortgage (P&I)
- −$524
- Tax from tax record
- −$66 /mo · $788/yr
- Insurance
- −$42
- HOA
- −$0
- Vacancy / Maint / Mgmt
- −$264
- Net cashflow
- $363
Break-even live
UW: 25.0% down · 7.5% · 30yr · 1.5% tax · 5.0% vac · 8.0% maint · 8.0% mgmt
Financing live
Cash to close
- Down payment
- $25,000
- Closing costs
- $3,000
- Reserves months
- —
- Total cash needed
- —
Loan-product check · same deal, 3 products live
Conventional
25% down · 7.5% · 30yr
- Down + closing
- —
- Monthly P&I
- —
- Monthly cashflow
- —
- DSCR
- —
- Eligible?
- —
Personal DTI + credit; lowest rate.
DSCR
20% down · 8.5% · 30yr
- Down + closing
- —
- Monthly P&I
- —
- Monthly cashflow
- —
- DSCR
- —
- Eligible?
- —
No personal income docs; deal must DSCR.
Hard money
10% down · 12.0% · 12mo
- Down + closing
- —
- Monthly P&I
- —
- Monthly cashflow
- —
- DSCR
- —
- Eligible?
- —
Short-term bridge; refi at stabilization.
Listing history 8 events
-
2026-06-15status $100,000 Pending 6 DOM
-
2026-06-13days on market $100,000 Active 6 DOM
-
2026-06-13pricestatus $100,000 Active 5 DOM
-
2026-06-07status $125,000 Pending 5 DOM
-
2026-06-03days on market $125,000 Active 5 DOM
-
2026-06-02days on market $125,000 Active 4 DOM
-
2026-06-01days on market $125,000 Active 3 DOM
-
2026-05-31days on market $125,000 Active 2 DOM
ⓘ Source: listings_history table (triggers on properties + properties_extension) + one-shot
backfill from property_details.listing_events for pre-trigger history.
Tax reassessment forecast MO · Resets to sale price
- Current annual tax
- $788 · $66/mo
- Projected year-2 tax
- $970 · $81/mo
- Expected delta
- +$182/yr (+$15/mo · 23.1%)
ⓘ Screening estimate from a state-policy table — verify with the county assessor before closing.
Climate risk First Street
- Flood 1/10 Low FEMA zone X (unshaded) · 0% chance over 30 yrs
- Wildfire 2/10 Low
- Heat 4/10 Moderate 7 d/yr ≥107°F today · 16 d/yr by 30 yrs out
- Wind 2/10 Low
- Air quality 3/10 Moderate 4 unhealthy d/yr today · 4 by 30 yrs out
Nearby sold comps map
Loading sold comps map…
Walkable amenities ~0.75 mi
Loading nearby amenities…
Taxation est. · year 1
- Rental income
- $15,112
- − Mortgage interest
- −$5,602
- − Property taxes
- −$788
- − Insurance
- −$500
- − Repairs & maintenance
- −$1,209
- − Management
- −$1,209
- − Depreciation
- −$2,909
- Taxable income
- $2,896
- Est. tax owed @ 24.0%
- −$695
- After-tax cash flow
- $3,663/yr
For passive investors: Depreciation is non-cash, so a rental often shows a tax loss while cash-flowing — sheltering income. Rental losses are passive: they offset passive income freely, and up to $25,000/yr can offset ordinary (W-2) income if you actively participate and your MAGI is under $100k (phasing out to $0 by $150k); unused losses carry forward. On sale, claimed depreciation is recaptured at up to 25%, and gains may owe capital-gains tax (a 1031 exchange can defer both). Figures are a year-1 estimate at your 24.0% rate — not tax advice; consult a CPA.
Schools (NCES district)
- District
- Excelsior Springs 40
- NCES district ID
- 2911650
- Math proficiency
- 27% ▼ -6.00%
- Reading proficiency
- 40% ▼ -1.00%
- Median HH income
- $52,747
- Composite
- 29.32/100
- National rank
- #6548
- State rank
- #225 of 324 in MO
Livability — Prathersville
- Score
- 62/100
- State rank
- #383
- US rank
- #16794
Category grades
Schools grade is shown separately in the Schools card above.
Census & demographics
- Census place
- Prathersville, MO
- County
- Clay County · 220,651 people
- City population
- 15,574
- Metro
- Kansas City, MO-KS
- Population (ZIP)
- 15,574
- Household income
- $77,895
- Rent vs Own
- Severe rent burden
- 329.0
Population outlook (Clay County) Hauer SSP2
- Today (2025)
- 266,022 people
- By 2030
- 280,057 · +5.3%
- By 2040
- 306,153 · +15.1%
- By 2050
- 328,630 · +23.5%
- By 2075
- 375,182 · +41.0%
- By 2100
- 392,861 · +47.7%
Race, ethnicity, and origin ACS 2023
- Neighborhood character
- Predominantly White (85%)
- Race & ethnicity
- White 85% Two or more races 7% Hispanic / Latino 6% Black 3% Native American 1%
- Hispanic origin (detail)
- Mexican 4% Cuban 2%
- Common ancestry
- Italian 2% Serbian 2% Portuguese 1%
- Foreign-born
- 3% · Canada, China
- Languages at home
- 95% English-only · Spanish 3%
Political lean MEDSL · Clay
- 2024 margin
- Lean R (+5.6) · D 46.4% · R 52.0% · Other 1.6%
- 2008→2024 swing
- -4.9pp toward R · 2008: -0.7pp · 2024: -5.6pp
- All cycles
- 2024: R+5.6 2020: R+4.1 2016: R+11.1 2012: R+8.4 2008: R+0.7
Not yet ingested
- Civics
- —
Market trends
- HPI YoY
- ▼ -54.83%
- Current HPI
- 302.9184
- Rent YoY
- —
- Metro
- Kansas City, MO-KS
- State GDP YoY
- ▲ 1.84%
- F500 in state
- 20
Industry mix (Fortune 500 HQ in MO)
| Industry | F500 HQs | Revenue |
|---|---|---|
| Healthcare | 1 | $163B |
|
||
| Insurance | 1 | $21B |
|
||
| Industrial Technology | 1 | $17B |
|
||
| Retail | 1 | $16B |
|
||
| Industrial Distribution | 1 | $10B |
|
||
| Utilities | 1 | $9B |
|
||
Price history
+108.7% since first listed12 events — show timeline
- 2026-05-29 Listed $125,000 Heartland MLS as Distributed by MLS Grid
- 2016-12-29 Listing Removed — Heartland MLS as Distributed by MLS Grid
- 2016-12-07 Price Changed $60,000 Heartland MLS as Distributed by MLS Grid
- 2016-11-29 Price Changed $61,900 Heartland MLS as Distributed by MLS Grid
- 2016-11-21 Listed $65,000 Heartland MLS as Distributed by MLS Grid
- 2015-01-06 Listed $65,000 Heartland MLS as Distributed by MLS Grid
- 2014-11-07 Listed $41,900 Heartland MLS as Distributed by MLS Grid
- 2005-11-09 Sold (Public Records) — Public Records
- 2005-11-07 Sold (MLS) — Heartland MLS as Distributed by MLS Grid
- 2005-08-25 Listed $54,900 Heartland MLS as Distributed by MLS Grid
- 2000-04-12 Sold (MLS) — Heartland MLS as Distributed by MLS Grid
- 2000-02-25 Listed $59,900 Heartland MLS as Distributed by MLS Grid
Property tax history
-0.5%/yrLatest (2025): $788 · +3.9% YoY. Source: county tax records.
Cash-flow waterfall
monthlySold comps — $/sqft
last 12 mo · ≤1 miLoading sold comps…