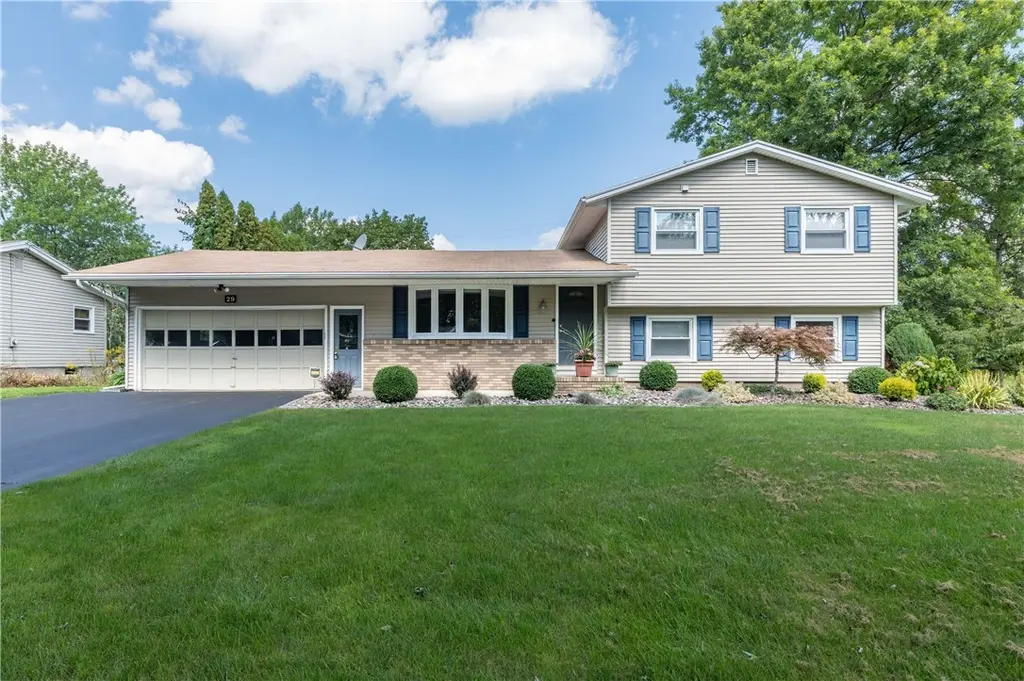
29 Marlands Rd · Gates, NY
Flood risk 1/10 · Minimal
- FEMA flood zone
- X (unshaded)
- Chance of flooding over 30 yrs
- 0.0%
- Est. flood insurance / yr
- $473 – $860
Fire risk 2/10 · Minimal
- Est. fire insurance / yr
- $691 – $1,283
Heat risk 2/10 · Minimal
- Hot days now (above 95°F)
- 7 days/yr
- Hot days in 30 yrs
- 15 days/yr
Wind risk 1/10 · Minimal
- Chance of severe wind over 30 yrs
- —
Air-quality risk 2/10 · Minimal
- Unhealthy air days now
- 1 days/yr
- Unhealthy air days in 30 yrs
- 1 days/yr
Risk factors via First Street. Map © Google.
Why this score? — see what drove the D+ grade
The composite is a weighted blend of 9 inputs, each scored 0–100. Each bar is that input's sub-score; the figure is the points it added to the 100-point composite (weight × sub-score).
- ARV discount +15.0/15.0
- Cash flow +12.2/30.0
- 1% rule +5.8/10.0
- DSCR +3.6/10.0
- Schools +3.6/10.0
- Livability +3.4/5.0
- Rent growth +2.5/5.0
- Condition / age +2.5/5.0
- Appreciation +0.0/10.0
$219,900
🖨 Deal sheet 📄 Offer letter ✓ Due diligence
Listing remarks
Well maintained split-level home in Gates offers a comfortable and functional living environment. This home features three bedrooms, providing ample space. The first-floor office space can also serve as a bedroom, offering versatility to accommodate various needs. The beautiful living room is enhanced by a fireplace and a door that leads out to a deck that overlooks the large and private backyard. Upstairs bathroom has heated floors. The large basement adds valuable storage space and can be adapted for various purposes. The two-car garage provides convenient parking and storage options. Make your appointment today! Delayed Showings until 9/8. Delayed negotiations until 9/12 noon.
Key facts
- 0.3 acre lot
- 2 garage spots
- Built 1972
Neighborhood map
What this means for you Summary
Snapshot
- This is a 3-bed/1.5-bath single-family listed at $220k.
Deal economics
- At list price, monthly cash flow is $-43 ($-517/yr) — negative.
- To cash-flow at today's rent, offer at most $212k (3.5% below list).
- Meets the 1% rule at list price ($2k rent vs $220k).
- Recommended offer: $212k (3.5% below list) — sets the bar for cash-flow.
Location & tenants
- Location reads 67/100 on livability (#582 in NY) — a middle-class / working-renter tenant base. Strengths: housing A+, health & safety A+; Watch: amenities F, commute F.
- Gates-Chili Central School District (suburban): math 41% / reading 42% proficiency, ranked #491 of 590 in NY (top 83%) — families likely to look elsewhere, expect single-tenant / working-renter base with shorter leases.
- Market conditions: 127 active listings in the ZIP; 6 comparable units currently listed for rent nearby; rentals at typical pace (median 15d on market — plan ~3-4 weeks tenant-placement turnaround); solid renter incomes; 1,169 units permitted in Monroe County in 2024 (591 in 5+ unit buildings).
- This rent runs 32% of the median local income ($88k/yr) — at the standard rent-burdened threshold; future hikes will face affordability resistance.
Forward outlook
- Local home prices are declining (-3.0%/yr); year-one equity from $2k of loan paydown is wiped out by about $7k of value loss. Plan a longer hold.
- Monroe County population projected to shrink 6% by 2050 — rents likely to lag national; underwrite the cash flow, not the appreciation.
Negotiation context
- Only 7 days on market — expect competitive offers; lowballing is unlikely to land.
Risks & watch-outs
- Watch-outs: property tax is 3.6% of price.
Questions for the listing agent
- What do current leases actually rent for vs. the listed asking? Can we see a recent rent roll and the last 12 months of T-12 income?
- Built in 1972 — when were the roof, HVAC, electrical panel, plumbing, and water heater last replaced?
- Property tax is high relative to price — has the assessment been appealed recently, and will the sale trigger a re-assessment?
- Is there a deadline driving the sale (1031 exchange, divorce, estate, relocation)? That informs how much negotiation room exists.
- Schools are B-rated — typically a magnet for longer-tenancy family renters. What's the average tenant stay here, and is there a school-zone premium baked into asking?
- The area grade is low — what's the realistic commute time and amenity access for the typical tenant pool here? Any planned neighborhood developments (good or bad) we should know about?
- What's the average days-on-market for RENTAL listings here right now (not sales)? A rising rental-DOM trend means longer vacancies and softer asking-rent achievability than the comps imply.
- What's the recent tenant-quality profile in this submarket — average credit score on applications, eviction rate, late-payment / NSF rate, and stable-employment percentage? A property-management company in the area should have these aggregated.
- How much new for-sale + rental construction is in the pipeline within 1–3 miles? Heavy new supply typically softens prices + rents 12–24 months out; constrained supply supports both.
Investment metrics
- 1% rule
- 1.08% ✓
- Cap rate
- 6.06%
- Cash-on-cash
- -0.84%
- DSCR
- 0.96
- GRM
- 7.7
CMA / ARV
- ARV (on-the-fly)
- $303,012
- Comps found
- 12
Show comp detail 12 sales within ~0.75 mi
| Address | Dist | Beds/Ba | Sqft | Sold | Price | $/sf | Match |
|---|---|---|---|---|---|---|---|
| 2 Sands Rd | 0.19mi | 3/2.0 | 1,730 (-2%) | 13mo | $310,000 | $179 | 75 |
| 4 Sands Rd | 0.20mi | 4/2.0 (+1) | 1,730 (-2%) | 12mo | $345,000 | $199 | 70 |
| 18 Capri Dr | 0.57mi | 3/2.0 | 1,774 (+0%) | 2mo | $303,000 | $171 | 69 |
| 19 Del Verde Rd | 0.21mi | 3/1.5 | 1,546 (-13%) | 5mo | $230,000 | $149 | 64 |
| 12 Flamingo Dr | 0.26mi | 4/2.5 (+1) | 1,800 (+2%) | 15mo | $313,000 | $174 | 64 |
| 17 Courtright Ln | 0.38mi | 3/2.0 | 1,864 (+5%) | 11mo | $259,300 | $139 | 62 |
| 15 Currier Ln | 0.38mi | 3/1.5 | 1,625 (-8%) | 8mo | $303,000 | $186 | 62 |
| 21 Bambi Ln | 0.52mi | 3/1.5 | 1,805 (+2%) | 16mo | $175,000 | $97 | 59 |
| 34 Capri Dr | 0.67mi | 3/1.5 | 1,774 (+0%) | 15mo | $285,000 | $161 | 56 |
| 67 Riviera Dr | 0.60mi | 4/2.0 (+1) | 1,739 (-2%) | 11mo | $260,000 | $150 | 52 |
| 29 Davy Dr | 0.70mi | 4/2.0 (+1) | 1,754 (-1%) | 10mo | $275,000 | $157 | 50 |
| 25 Bambi Ln | 0.55mi | 3/1.5 | 1,512 (-15%) | 9mo | $265,000 | $175 | 42 |
Match score weights: distance 35% · size 25% · config 20% · recency 20%. Top-matched comps best support the ARV.
Projected returns pro-forma
-3.0% appreciation · 3.0% rent growth · sell at horizon
- IRR
- -17.5%
- Equity multiple
- 0.38×
- Total profit
- $-38,099
- Equity at exit
- $32,788
- IRR
- -9.3%
- Equity multiple
- 0.42×
- Total profit
- $-35,584
- Equity at exit
- $19,013
Cash invested: $61,572 (down + closing). Projections, not guarantees.
Landlord ↔ Tenant lean methodology
- Overall (STATE)
- 15 Strongly Tenant-Friendly
- State New York
- 15 Strongly Tenant-Friendly · D+10
- County
- — inherits STATE
- City
- — inherits STATE
ZIP-level market 14624
- Active inventory
- 127
- Price-to-rent
- 7.7×
Monthly cashflow live
- Estimated rent
- $2,365 high interval (Pro) →
- Mortgage (P&I)
- −$1,153
- Tax from tax record
- −$667 /mo · $7,999/yr
- Insurance
- −$92
- HOA
- −$0
- Vacancy / Maint / Mgmt
- −$497
- Net cashflow
- $-43
Break-even live
UW: 25.0% down · 7.5% · 30yr · 1.5% tax · 5.0% vac · 8.0% maint · 8.0% mgmt
Financing live
Cash to close
- Down payment
- $54,975
- Closing costs
- $6,597
- Reserves months
- —
- Total cash needed
- —
Loan-product check · same deal, 3 products live
Conventional
25% down · 7.5% · 30yr
- Down + closing
- —
- Monthly P&I
- —
- Monthly cashflow
- —
- DSCR
- —
- Eligible?
- —
Personal DTI + credit; lowest rate.
DSCR
20% down · 8.5% · 30yr
- Down + closing
- —
- Monthly P&I
- —
- Monthly cashflow
- —
- DSCR
- —
- Eligible?
- —
No personal income docs; deal must DSCR.
Hard money
10% down · 12.0% · 12mo
- Down + closing
- —
- Monthly P&I
- —
- Monthly cashflow
- —
- DSCR
- —
- Eligible?
- —
Short-term bridge; refi at stabilization.
Rent comps 6 comps
| Address | Beds | Baths | Sqft | Rent | $/sqft | DOM | Units | Dist |
|---|---|---|---|---|---|---|---|---|
| 25 Silverlight Way Unit 50 Rochester, NY | 3.0 | 2.5 | 1526 | $2,550 | $1.67 | 44d | 1 | 0.67mi |
| 50 Ivy Bridge Way Rochester, NY | 3.0 | 2.5 | 1526 | $2,550 | $1.67 | 44d | 1 | 0.70mi |
| 29 Ivy Bridge Way Westgate, NY | 3.0 | 2.5 | 1526 | $2,500 | $1.64 | 10d | 1 | 0.77mi |
| 37 Red Plank Way Rochester, NY | 3.0 | 2.5 | 1526 | $2,500 | $1.64 | 14d | 1 | 0.79mi |
| 350 Westview Commons Blvd Rochester, NY | 1.0–2.0 | 1.0–2.0 | 1087 | $1,860 | $1.71 | 3d | 13 | 0.97mi |
| 2859 Manitou Rd Rochester, NY | 1.0–3.0 | 1.0–1.5 | 937 | $1,915 | $2.04 | 3d | 12 | 1.46mi |
Listing history 4 events
-
2023-12-27status Pending
-
2023-10-30soldstatus $287,777
-
2023-09-14status Under Contract- Do Not Show
-
2023-09-07$219,900 Active
ⓘ Source: listings_history table (triggers on properties + properties_extension) + one-shot
backfill from property_details.listing_events for pre-trigger history.
Tax reassessment forecast NY · Partial reset (capped growth)
- Current annual tax
- $7,999 · $667/mo
- Projected year-2 tax
- $7,999 · $667/mo
- Expected delta
- $0/yr ($0/mo · 0.0%)
ⓘ Screening estimate from a state-policy table — verify with the county assessor before closing.
Climate risk First Street
- Flood 1/10 Low FEMA zone X (unshaded) · 0% chance over 30 yrs
- Wildfire 2/10 Low
- Heat 2/10 Low 7 d/yr ≥95°F today · 15 d/yr by 30 yrs out
- Wind 1/10 Low
- Air quality 2/10 Low 1 unhealthy d/yr today · 1 by 30 yrs out
Nearby sold comps map
Loading sold comps map…
Walkable amenities ~0.75 mi
Loading nearby amenities…
Taxation est. · year 1
- Rental income
- $28,380
- − Mortgage interest
- −$12,318
- − Property taxes
- −$7,999
- − Insurance
- −$1,100
- − Repairs & maintenance
- −$2,270
- − Management
- −$2,270
- − Depreciation
- −$6,397
- Taxable loss
- −$3,974
- Est. tax savings @ 24.0%
- +$954
- After-tax cash flow
- $437/yr
For passive investors: Depreciation is non-cash, so a rental often shows a tax loss while cash-flowing — sheltering income. Rental losses are passive: they offset passive income freely, and up to $25,000/yr can offset ordinary (W-2) income if you actively participate and your MAGI is under $100k (phasing out to $0 by $150k); unused losses carry forward. On sale, claimed depreciation is recaptured at up to 25%, and gains may owe capital-gains tax (a 1031 exchange can defer both). Figures are a year-1 estimate at your 24.0% rate — not tax advice; consult a CPA.
Schools (NCES district)
- District
- Gates-Chili Central School District
- NCES district ID
- 3611880
- Math proficiency
- 41% ▼ -12.00%
- Reading proficiency
- 42% ▼ -6.00%
- Median HH income
- $55,045
- Composite
- 36.23/100
- National rank
- #4719
- State rank
- #491 of 590 in NY
Livability — Gates
- Score
- 67/100
- State rank
- #582
- US rank
- #10531
Category grades
Schools grade is shown separately in the Schools card above.
Census & demographics
- County
- Monroe County · 674,131 people
- Metro
- Rochester, NY
- Population (ZIP)
- 38,626
- Household income
- $87,989
- Rent vs Own
- Severe rent burden
- 584.0
Population outlook (Monroe County) Hauer SSP2
- Today (2025)
- 759,460 people
- By 2030
- 757,154 · -0.3%
- By 2040
- 740,644 · -2.5%
- By 2050
- 714,443 · -5.9%
- By 2075
- 645,883 · -15.0%
- By 2100
- 547,084 · -28.0%
Race, ethnicity, and origin ACS 2023
- Neighborhood character
- Predominantly White (78%)
- Race & ethnicity
- White 78% Black 9% Hispanic / Latino 6% Two or more races 5% Asian 3%
- Hispanic origin (detail)
- Puerto Rican 4%
- Common ancestry
- Romanian 6% Iranian 2% Lithuanian 2%
- Foreign-born
- 7% · Canada, China, India
- Languages at home
- 90% English-only · Spanish 3% Other Indo-European 3% Russian/Polish/Slavic 1%
Political lean MEDSL · Monroe
- 2024 margin
- D (+19.1) · D 59.5% · R 40.5%
- 2008→2024 swing
- +1.4pp toward D · 2008: 17.7pp · 2024: 19.1pp
- All cycles
- 2024: D+19.1 2020: D+21.0 2016: D+14.1 2012: D+17.4 2008: D+17.7
Not yet ingested
- Civics
- —
Market trends
- HPI YoY
- ▼ -151.26%
- Current HPI
- 267.356
- Rent YoY
- —
- Metro
- Rochester, NY
- State GDP YoY
- ▲ 2.60%
- F500 in state
- 92
Industry mix (Fortune 500 HQ in NY)
| Industry | F500 HQs | Revenue |
|---|---|---|
| Financial Services | 10 | $950B |
|
||
| Consumer Goods | 9 | $162B |
|
||
| Insurance | 4 | $225B |
|
||
| Telecommunications | 2 | $144B |
|
||
| Pharmaceuticals | 2 | $112B |
|
||
| Media / Entertainment | 2 | $69B |
|
||
Price history
+30.9% since first listed4 events — show timeline
- 2023-12-27 Pending — UNYREIS
- 2023-10-30 Sold (Public Records) $287,777 Public Records
- 2023-09-14 Pending — UNYREIS
- 2023-09-07 Listed $219,900 UNYREIS
Property tax history
+4.7%/yrLatest (2025): $7,999 · +21.3% YoY. Source: county tax records.
Cash-flow waterfall
monthlySold comps — $/sqft
last 12 mo · ≤1 miLoading sold comps…