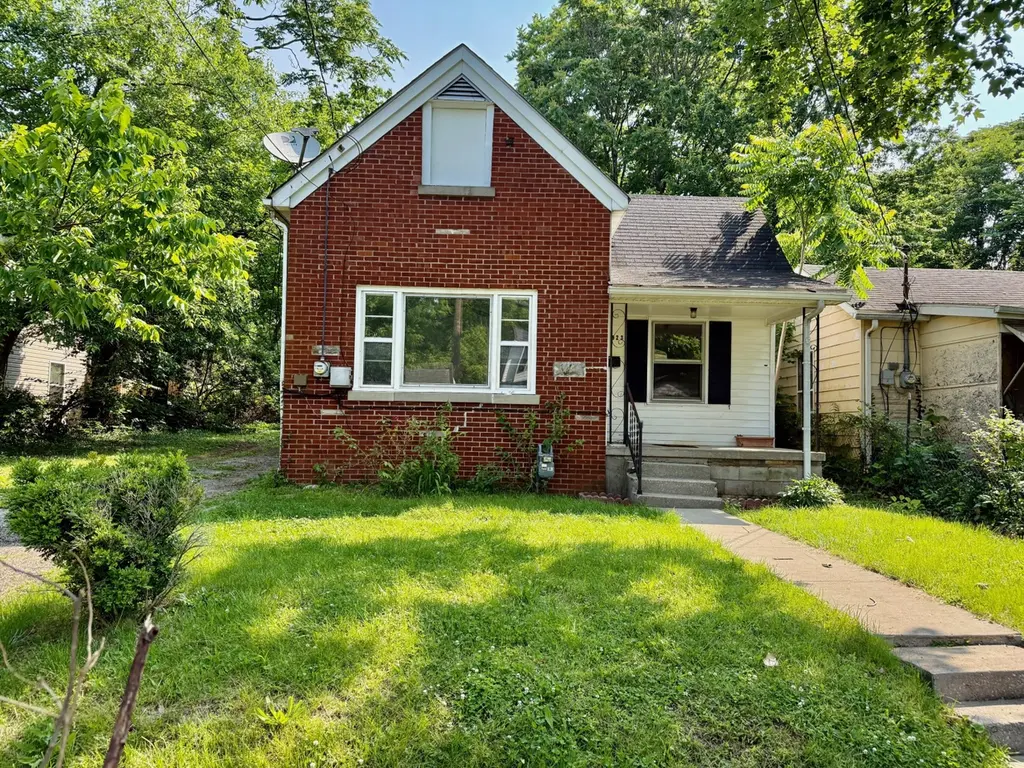
923 Whitney Ave · Lexington-Fayette, KY
Flood risk 1/10 · Minimal
- FEMA flood zone
- X (unshaded)
- Chance of flooding over 30 yrs
- 0.0%
- Est. flood insurance / yr
- $507 – $1,088
Fire risk 1/10 · Minimal
- Est. fire insurance / yr
- $839 – $1,559
Heat risk 4/10 · Minor
- Hot days now (above 101°F)
- 7 days/yr
- Hot days in 30 yrs
- 17 days/yr
Wind risk 2/10 · Minimal
- Chance of severe wind over 30 yrs
- 3.0%
Air-quality risk 2/10 · Minimal
- Unhealthy air days now
- 0 days/yr
- Unhealthy air days in 30 yrs
- 2 days/yr
Risk factors via First Street. Map © Google.
Why this score? — see what drove the C grade
The composite is a weighted blend of 9 inputs, each scored 0–100. Each bar is that input's sub-score; the figure is the points it added to the 100-point composite (weight × sub-score).
- Cash flow +21.9/30.0
- ARV discount +9.7/15.0
- DSCR +7.0/10.0
- Rent growth +5.0/5.0
- 1% rule +4.5/10.0
- Schools +3.4/10.0
- Livability +2.5/5.0
- Condition / age +2.5/5.0
- Appreciation +0.0/10.0
$165,000
🖨 Deal sheet 📄 Offer letter ✓ Due diligence
Listing remarks
Don't miss the opportunity to own this income producing, recent remodel! Four beds, beautiful new Kitchen, stainless appliances, all new vinyl flooring throughout, large backyard and off street parking! Conveniently located close to downtown Lexington!
Key facts
- Recent remodel
- New kitchen
- Off street parking
Tags
Property features AI
Finance
- Other: Parcel number 157133600
Exterior
- Parking: Driveway; Off-street parking
- Utilities: Public water; Public sewer; Electricity connected; Natural gas connected
- Home design: Single-story house; Faces unspecified direction
- Construction: Brick veneer exterior; Dimensional style shingle roof; Block foundation; Built area approximately 1,302
- Exterior features: Few trees; Partial chain link fencing; Neighborhood and trees/woods view
Interior
- Kitchen: Refrigerator; Range
- Bedrooms: Total rooms: 7
- Flooring: Vinyl
- Bathrooms: 1 full bathroom
- Heating & cooling: Forced air heating; Natural gas heating
- Interior features: Eat-in kitchen; Screens on windows; Crawl space basement; No fireplace
- Laundry & utility: Washer hookup on main level; Electric dryer hookup
Neighborhood map
What this means for you Summary
Snapshot
- This is a 4-bed/1.0-bath single-family listed at $165k.
Deal economics
- At list price, monthly cash flow is $261 ($3k/yr) — positive.
- The deal already cash-flows at list — no discount required.
- To meet the 1% rule (rent ≥ 1% of price), the offer needs to be $156k (5.4% below list).
- Recommended offer: $156k (5.4% below list) — sets the bar for 1% rule.
- Cap rate 8.2% vs local median 3.8% in Lexington-Fayette — top-decile yield for the area; either an underpriced asset or a hidden risk that comps aren't pricing in. Stress-test before assuming the spread holds.
Location & tenants
- Location reads: area grade C — affects rentability + tenant quality, not the cash-flow math above.
- Fayette County (urban): math 35% / reading 45% proficiency, ranked #27 of 165 in KY (top 16%) — families likely to look elsewhere, expect single-tenant / working-renter base with shorter leases.
- Zoned schools: Northern Elementary School (math 12% / reading 17%, grade F, #627 of 676 statewide, top 93%, 439 students, 71% FRL); Bryan Station Middle School (math 23% / reading 42%, grade F, #116 of 217 statewide, top 55%, 815 students, 56% FRL); Bryan Station High School (math 18% / reading 25%, grade F, #209 of 254 statewide, top 82%, 1,893 students, 59% FRL) — zoned schools average 62% FRL vs 44% district-wide (18 pts higher); higher-poverty schools than district average — tighter screening recommended.
- Zoned-school proficiency averages 23% at this address vs 40% district-wide (-17 pts) — the specific schools serving this property underperform the Fayette County average; the district grade overstates school quality for this exact location.
- Market conditions: Rents rising fast (+11.8%/yr); 82 active listings in the ZIP; 12 comparable units currently listed for rent nearby; rentals at typical pace (median 24d on market — plan ~3-4 weeks tenant-placement turnaround); lower-income renter base — watch delinquency; 1,036 units permitted in Fayette County in 2024 (542 in 5+ unit buildings).
- At $1,560/mo this rent would consume 64% of the median local household income ($29k/yr) (locally 2644% of renters already pay >50% of income on rent) — very limited rent-growth headroom before tenants either downsize or default.
Forward outlook
- Local home prices are declining (-3.0%/yr); year-one equity from $1k of loan paydown is wiped out by about $5k of value loss. Plan a longer hold.
- Fayette County population projected at +35% by 2050 — long-run rental-demand tailwind backs the buy-and-hold thesis.
- At projected returns (-3.0% appreciation + 8.0% rent growth), your $46k cash investment doubles in ~9 years — after that, you're playing with house money.
Negotiation context
- It's been on market 41 days — a 3% lower offer ($160k) is reasonable based on typical stale-listing flexibility.
- 4 sale attempts since 2y ago with the ask held roughly flat each time — persistent listings suggest the price (not the market) is what's stuck; bring a comps-based counter.
Risks & watch-outs
- Watch-outs: built in 1948 — expect roof / HVAC / electrical / plumbing capex.
Questions for the listing agent
- It's been on market 41 days. Have you received any prior offers? Is the seller open to a 5% concession, seller financing, or rate buy-down credit?
- Built in 1948 — when were the roof, HVAC, electrical panel, plumbing, and water heater last replaced?
- Is there a deadline driving the sale (1031 exchange, divorce, estate, relocation)? That informs how much negotiation room exists.
- What's the average days-on-market for RENTAL listings here right now (not sales)? A rising rental-DOM trend means longer vacancies and softer asking-rent achievability than the comps imply.
- What's the recent tenant-quality profile in this submarket — average credit score on applications, eviction rate, late-payment / NSF rate, and stable-employment percentage? A property-management company in the area should have these aggregated.
- How much new for-sale + rental construction is in the pipeline within 1–3 miles? Heavy new supply typically softens prices + rents 12–24 months out; constrained supply supports both.
Investment metrics
- 1% rule
- 0.95% ✗
- Cap rate
- 8.19%
- Cash-on-cash
- 6.78%
- DSCR
- 1.30
- GRM
- 8.8
CMA / ARV
- ARV (on-the-fly)
- $173,550
- Comps found
- 11
Show comp detail 11 sales within ~0.75 mi
| Address | Dist | Beds/Ba | Sqft | Sold | Price | $/sf | Match |
|---|---|---|---|---|---|---|---|
| 712 Florence Ave | 0.24mi | 3/1.0 (-1) | 1,146 (-1%) | 2mo | $114,000 | $99 | 81 |
| 722 Whitney Ave | 0.28mi | 3/1.0 (-1) | 1,152 (-0%) | 9mo | $183,780 | $160 | 74 |
| 450 Ash St | 0.15mi | 3/1.5 (-1) | 1,253 (+8%) | 1mo | $172,000 | $137 | 72 |
| 915 Whitney Ave | 0.01mi | 3/1.0 (-1) | 1,030 (-11%) | 9mo | $115,000 | $112 | 69 |
| 837 Whitney Ave | 0.11mi | 3/1.0 (-1) | 1,092 (-6%) | 14mo | $70,000 | $64 | 69 |
| 745 Breathitt Ave | 0.23mi | 4/2.0 | 1,200 (+4%) | 22mo | $197,500 | $165 | 61 |
| 448 Price Rd | 0.44mi | 3/1.0 (-1) | 1,064 (-8%) | 4mo | $200,000 | $188 | 57 |
| 111 Thompson Rd | 0.64mi | 4/2.0 | 1,231 (+6%) | 12mo | $261,000 | $212 | 46 |
| 124 Thompson Rd | 0.67mi | 3/1.0 (-1) | 1,086 (-6%) | 15mo | $162,500 | $150 | 41 |
| 446 Lindberg | 0.30mi | 3/1.0 (-1) | 988 (-15%) | 21mo | $110,800 | $112 | 39 |
| 434 Jefferson St | 0.69mi | 3/1.0 (-1) | 1,044 (-10%) | 23mo | $215,000 | $206 | 27 |
Match score weights: distance 35% · size 25% · config 20% · recency 20%. Top-matched comps best support the ARV.
Projected returns pro-forma
-3.0% appreciation · 8.0% rent growth · sell at horizon
- IRR
- -1.1%
- Equity multiple
- 0.96×
- Total profit
- $-1,937
- Equity at exit
- $24,602
- IRR
- 12.9%
- Equity multiple
- 2.23×
- Total profit
- $56,934
- Equity at exit
- $14,266
Cash invested: $46,200 (down + closing). Projections, not guarantees.
Landlord ↔ Tenant lean methodology
- Overall (STATE)
- 83 Strongly Landlord-Friendly
- State Kentucky
- 83 Strongly Landlord-Friendly · R+16
- County
- — inherits STATE
- City
- — inherits STATE
ZIP-level market 40508
- Rents YoY
- 11.8%
- Active inventory
- 82
- Price-to-rent
- 8.8×
Monthly cashflow live
- Estimated rent
- $1,560 high interval (Pro) →
- Mortgage (P&I)
- −$865
- Tax from tax record
- −$37 /mo · $447/yr
- Insurance
- −$69
- HOA
- −$0
- Vacancy / Maint / Mgmt
- −$328
- Net cashflow
- $261
Break-even live
UW: 25.0% down · 7.5% · 30yr · 1.5% tax · 5.0% vac · 8.0% maint · 8.0% mgmt
Financing live
Cash to close
- Down payment
- $41,250
- Closing costs
- $4,950
- Reserves months
- —
- Total cash needed
- —
Loan-product check · same deal, 3 products live
Conventional
25% down · 7.5% · 30yr
- Down + closing
- —
- Monthly P&I
- —
- Monthly cashflow
- —
- DSCR
- —
- Eligible?
- —
Personal DTI + credit; lowest rate.
DSCR
20% down · 8.5% · 30yr
- Down + closing
- —
- Monthly P&I
- —
- Monthly cashflow
- —
- DSCR
- —
- Eligible?
- —
No personal income docs; deal must DSCR.
Hard money
10% down · 12.0% · 12mo
- Down + closing
- —
- Monthly P&I
- —
- Monthly cashflow
- —
- DSCR
- —
- Eligible?
- —
Short-term bridge; refi at stabilization.
Rent comps 12 comps
| Address | Beds | Baths | Sqft | Rent | $/sqft | DOM | Units | Dist |
|---|---|---|---|---|---|---|---|---|
| 405 Roosevelt Blvd Lexington, KY | 3.0 | 1.0 | 960 | $1,495 | $1.56 | 14d | 1 | 0.30mi |
| 723 Charles Ave Lexington, KY | 3.0 | 1.0 | 992 | $1,300 | $1.31 | 14d | 1 | 0.30mi |
| 330 Newtown Pike Lexington, KY | 1.0–3.0 | 1.0–2.0 | 976 | $1,377 | $1.41 | 23d | 1 | 0.43mi |
| 301 Thompson Rd Lexington, KY | 3.0 | 1.0 | 1008 | $1,450 | $1.44 | 14d | 1 | 0.72mi |
| 120 Clyde St Lexington, KY | 3.0 | 1.0 | 1242 | $1,450 | $1.17 | 23d | 1 | 0.74mi |
| 832 W High St Unit 1 Lexington, KY | 3.0 | 1.5 | 900 | $1,400 | $1.56 | 23d | 1 | 0.87mi |
| 444 N Broadway Lexington, KY | 3.0 | 1.0 | 1160 | $1,595 | $1.38 | 23d | 1 | 0.98mi |
| 222 W Sixth St Lexington, KY | 3.0 | 1.5 | 1050 | $1,150 | $1.10 | 23d | 1 | 1.12mi |
| 275 S Limestone #135 Lexington, KY | 3.0 | 2.0 | 1142 | $2,950 | $2.58 | 14d | 1 | 1.35mi |
| 115 W Loudon Ave Unit L97 Lexington, KY | 3.0 | 2.0 | 960 | $980 | $1.02 | 23d | 1 | 1.36mi |
| 627 N Martin Luther King Blvd Lexington, KY | 4.0 | 2.0 | 1440 | $1,400 | $0.97 | 23d | 1 | 1.39mi |
| 211 E Sixth St Lexington, KY | 3.0 | 1.0 | 1400 | $1,500 | $1.07 | 23d | 1 | 1.43mi |
Listing history 24 events
-
2026-06-18days on market $165,000 Active 41 DOM
-
2026-06-17days on market $165,000 Active 40 DOM
-
2026-06-16days on market $165,000 Active 39 DOM
-
2026-06-15days on market $165,000 Active 38 DOM
-
2026-06-14days on market $165,000 Active 36 DOM
-
2026-06-13days on market $165,000 Active 35 DOM
-
2026-06-10days on market $165,000 Active 33 DOM
-
2026-06-09days on market $165,000 Active 32 DOM
-
2026-06-08days on market $165,000 Active 31 DOM
-
2026-06-07days on market $165,000 Active 30 DOM
-
2026-06-05days on market $165,000 Active 27 DOM
-
2026-06-03days on market $165,000 Active 26 DOM
-
2026-06-02days on market $165,000 Active 25 DOM
-
2026-06-01days on market $165,000 Active 24 DOM
-
2026-05-31days on market $165,000 Active 23 DOM
-
2026-05-04$165,000 Active
-
2025-12-17historical
-
2025-11-15status Active
-
2025-11-14historical
-
2025-07-28price $175,000
-
2025-06-03$185,000 Active
-
2024-11-17historical
-
2024-05-26price $135,000
-
2024-05-17$175,000 Active
ⓘ Source: listings_history table (triggers on properties + properties_extension) + one-shot
backfill from property_details.listing_events for pre-trigger history.
Tax reassessment forecast KY · Resets to sale price
- Current annual tax
- $447 · $37/mo
- Projected year-2 tax
- $1,419 · $118/mo
- Expected delta
- +$972/yr (+$81/mo · 217.6%)
ⓘ Screening estimate from a state-policy table — verify with the county assessor before closing.
Climate risk First Street
- Flood 1/10 Low FEMA zone X (unshaded) · 0% chance over 30 yrs
- Wildfire 1/10 Low
- Heat 4/10 Moderate 7 d/yr ≥101°F today · 17 d/yr by 30 yrs out
- Wind 2/10 Low 3% chance of damaging wind over 30 yrs
- Air quality 2/10 Low 0 unhealthy d/yr today · 2 by 30 yrs out
Nearby sold comps map
Loading sold comps map…
Walkable amenities ~0.75 mi
Loading nearby amenities…
Taxation est. · year 1
- Rental income
- $18,721
- − Mortgage interest
- −$9,243
- − Property taxes
- −$447
- − Insurance
- −$825
- − Repairs & maintenance
- −$1,498
- − Management
- −$1,498
- − Depreciation
- −$4,800
- Taxable income
- $411
- Est. tax owed @ 24.0%
- −$99
- After-tax cash flow
- $3,036/yr
For passive investors: Depreciation is non-cash, so a rental often shows a tax loss while cash-flowing — sheltering income. Rental losses are passive: they offset passive income freely, and up to $25,000/yr can offset ordinary (W-2) income if you actively participate and your MAGI is under $100k (phasing out to $0 by $150k); unused losses carry forward. On sale, claimed depreciation is recaptured at up to 25%, and gains may owe capital-gains tax (a 1031 exchange can defer both). Figures are a year-1 estimate at your 24.0% rate — not tax advice; consult a CPA.
Schools (NCES district)
- District
- Fayette County
- NCES district ID
- 2101860
- Math proficiency
- 35% ▼ -16.00%
- Reading proficiency
- 45% ▼ -13.00%
- Median HH income
- $49,245
- Composite
- 34.38/100
- National rank
- #5211
- State rank
- #27 of 165 in KY
Livability — Lexington-Fayette
No livability data for this city. (Only ~50 U.S. cities are tracked.)
Census & demographics
- Census place
- Lexington-Fayette, KY
- County
- Fayette County · 317,143 people
- City population
- 321,882
- Metro
- Lexington-Fayette, KY
- Population (ZIP)
- 23,756
- Household income
- $29,440
- Rent vs Own
- Severe rent burden
- 2644.0
Population outlook (Fayette County) Hauer SSP2
- Today (2025)
- 363,454 people
- By 2030
- 388,270 · +6.8%
- By 2040
- 438,688 · +20.7%
- By 2050
- 490,667 · +35.0%
- By 2075
- 625,394 · +72.1%
- By 2100
- 721,354 · +98.5%
Race, ethnicity, and origin ACS 2023
- Neighborhood character
- Diverse neighborhood (Simpson 0.58)
- Race & ethnicity
- White 60% Black 22% Hispanic / Latino 9% Two or more races 7% Asian 3%
- Hispanic origin (detail)
- Mexican 5%
- Common ancestry
- Serbian 2% Italian 2% Lithuanian 2%
- Foreign-born
- 9% · Canada, China
- Languages at home
- 87% English-only · Spanish 8% Chinese 1% Other Indo-European 1%
Political lean MEDSL · Fayette
- 2024 margin
- D (+18.1) · D 58.0% · R 39.9% · Other 2.1%
- 2008→2024 swing
- +13.3pp toward D · 2008: 4.8pp · 2024: 18.1pp
- All cycles
- 2024: D+18.1 2020: D+20.8 2016: D+9.5 2012: D+1.0 2008: D+4.8
Not yet ingested
- Civics
- —
Market trends
- HPI YoY
- ▼ -251.04%
- Current HPI
- 204.3994
- Rent YoY
- ▲ 11.83%
- Metro
- Lexington-Fayette, KY
- State GDP YoY
- ▲ 1.81%
- F500 in state
- 4
Industry mix (Fortune 500 HQ in KY)
| Industry | F500 HQs | Revenue |
|---|---|---|
| Healthcare | 1 | $118B |
|
||
| Food / Beverage | 1 | $7B |
|
||
Price history
-5.7% since first listed9 events — show timeline
- 2026-05-04 Listed $165,000 ImagineMLS
- 2025-12-17 Listing Removed — ImagineMLS
- 2025-11-15 Relisted — ImagineMLS
- 2025-11-14 Listing Removed — ImagineMLS
- 2025-07-28 Price Changed $175,000 ImagineMLS
- 2025-06-03 Listed $185,000 ImagineMLS
- 2024-11-17 Listing Removed — ImagineMLS
- 2024-05-26 Price Changed $135,000 ImagineMLS
- 2024-05-17 Listed $175,000 ImagineMLS
Property tax history
+1.8%/yrLatest (2015): $447 · +1.8% YoY. Source: county tax records.
Cash-flow waterfall
monthlySold comps — $/sqft
last 12 mo · ≤1 miLoading sold comps…