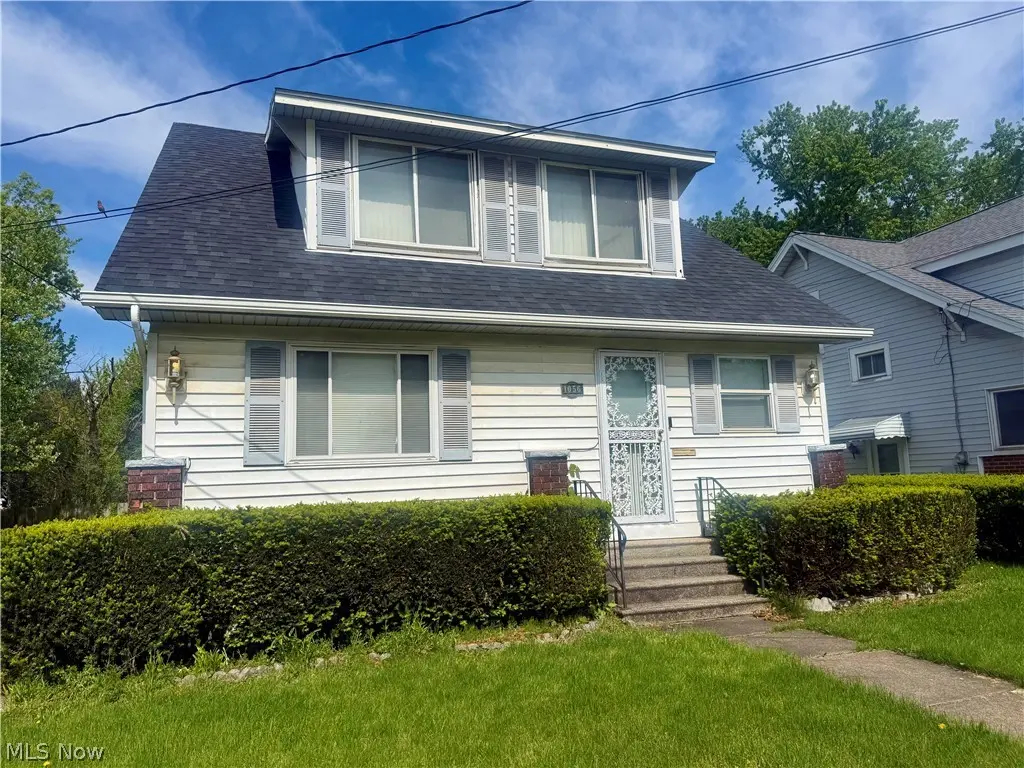
1056 Homewood · Warren, OH
Flood risk 1/10 · Minimal
- FEMA flood zone
- X (unshaded)
- Chance of flooding over 30 yrs
- 0.0%
- Est. flood insurance / yr
- $473 – $860
Fire risk 1/10 · Minimal
- Est. fire insurance / yr
- $713 – $1,323
Heat risk 3/10 · Minor
- Hot days now (above 98°F)
- 7 days/yr
- Hot days in 30 yrs
- 17 days/yr
Wind risk 1/10 · Minimal
- Chance of severe wind over 30 yrs
- —
Air-quality risk 3/10 · Minor
- Unhealthy air days now
- 1 days/yr
- Unhealthy air days in 30 yrs
- 4 days/yr
Risk factors via First Street. Map © Google.
Why this score? — see what drove the B grade
The composite is a weighted blend of 9 inputs, each scored 0–100. Each bar is that input's sub-score; the figure is the points it added to the 100-point composite (weight × sub-score).
- Cash flow +30.0/30.0
- ARV discount +15.0/15.0
- DSCR +10.0/10.0
- 1% rule +9.0/10.0
- Livability +3.7/5.0
- Rent growth +2.5/5.0
- Condition / age +2.5/5.0
- Schools +2.2/10.0
- Appreciation +0.0/10.0
$75,000
🖨 Deal sheet 📄 Offer letter ✓ Due diligence
Listing remarks
1056 Homewood SE is a great opportunity for investors or first-time homebuyers looking to add their personal touch and build instant value. Featuring a roof that is only one year old, this home offers peace of mind on one of the major updates already completed. With solid bones and plenty of potential, it’s the perfect property for buyers ready to make a few cosmetic improvements and create a space that truly feels like home. Whether you are looking for your next investment property or an affordable starter home, 1056 Homewood SE has endless possibilities. A few modern updates could easily transform this property and increase its value, making it a smart buy in today’s market. D
Key facts
- 2 garage spots
- Built 1925
- Listed 22 days
Property features AI
Exterior
- Parking: 2-car garage
- Utilities: Public water; Public sewer
- Home design: 2-story home; Fixer condition; Shingle roof; Vinyl siding
- Construction: Built (year per public records); Vinyl siding construction; Shingle roof
- Exterior features: Asphalt parking surface
Interior
- Bathrooms: 2 full bathrooms
- Heating & cooling: Baseboard heating
- Interior features: Full, partially finished basement
Neighborhood map
What this means for you Summary
Snapshot
- This is a 3-bed/1.0-bath single-family listed at $75k.
Deal economics
- At list price, monthly cash flow is $379 ($5k/yr) — positive.
- The deal already cash-flows at list — no discount required.
- Meets the 1% rule at list price ($1k rent vs $75k).
- Recommended offer: $74k (1.5% below list) — sets the bar for market timing.
- Cap rate 12.4% vs local median 6.0% in Warren — top-decile yield for the area; either an underpriced asset or a hidden risk that comps aren't pricing in. Stress-test before assuming the spread holds.
Location & tenants
- Location reads 73/100 on livability (#312 in OH) — a middle-class / working-renter tenant base. Strengths: cost of living A+, health & safety A+, housing A; Watch: crime D-, commute F, employment F.
- Warren City (urban): math 22% / reading 32% proficiency, ranked #599 of 656 in OH (top 91%) — low school quality limits family demand, transient renter base, plan for 1-2y turnover; 75% free/reduced lunch — lower-income household profile, screen leases tightly.
- Market conditions: 107 active listings in the ZIP; 6 comparable units currently listed for rent nearby; rentals leasing fast (median 14d on market — plan ~1-2 weeks tenant-placement turnaround); 129 units permitted in Trumbull County in 2024 (0 in 5+ unit buildings).
Forward outlook
- Local home prices are declining (-3.0%/yr); year-one equity from $519 of loan paydown is wiped out by about $2k of value loss. Plan a longer hold.
- Trumbull County population projected at -22% by 2050 — secular population decline; favor cash flow + early exit over multi-decade hold.
- At projected returns (-3.0% appreciation + 3.0% rent growth), your $21k cash investment doubles in ~6 years — after that, you're playing with house money.
Negotiation context
- It's been on market 22 days — a 2% lower offer ($74k) is reasonable based on typical stale-listing flexibility.
- 2 sale attempts with the ask held roughly flat each time — persistent listings suggest the price (not the market) is what's stuck; bring a comps-based counter.
Risks & watch-outs
- Watch-outs: built in 1925 — expect roof / HVAC / electrical / plumbing capex.
Questions for the listing agent
- Built in 1925 — when were the roof, HVAC, electrical panel, plumbing, and water heater last replaced?
- Is there a deadline driving the sale (1031 exchange, divorce, estate, relocation)? That informs how much negotiation room exists.
- Crime grade is D in this area — have there been break-ins, vandalism, or insurance claims at this property in the last 3 years? What carrier currently insures it and at what premium?
- What's the average days-on-market for RENTAL listings here right now (not sales)? A rising rental-DOM trend means longer vacancies and softer asking-rent achievability than the comps imply.
- What's the recent tenant-quality profile in this submarket — average credit score on applications, eviction rate, late-payment / NSF rate, and stable-employment percentage? A property-management company in the area should have these aggregated.
- How much new for-sale + rental construction is in the pipeline within 1–3 miles? Heavy new supply typically softens prices + rents 12–24 months out; constrained supply supports both.
Investment metrics
- 1% rule
- 1.40% ✓
- Cap rate
- 12.36%
- Cash-on-cash
- 21.68%
- DSCR
- 1.96
- GRM
- 6.0
CMA / ARV
- ARV (on-the-fly)
- $119,082
- Comps found
- 12
Show comp detail 12 sales within ~0.75 mi
| Address | Dist | Beds/Ba | Sqft | Sold | Price | $/sf | Match |
|---|---|---|---|---|---|---|---|
| 1100 Woodbine Ave SE | 0.13mi | 3/1.0 | 1,178 (-12%) | 5mo | $42,500 | $36 | 70 |
| 1116 Adelaide Ave SE | 0.34mi | 4/1.0 (+1) | 1,254 (-6%) | 0mo | $106,250 | $85 | 69 |
| 648 Woodbine Ave SE | 0.38mi | 3/2.0 | 1,324 (-1%) | 11mo | $132,900 | $100 | 68 |
| 1344 Grandview St SE | 0.30mi | 3/1.5 | 1,232 (-8%) | 10mo | $70,000 | $57 | 63 |
| 235 Iddings Ave SE | 0.59mi | 3/1.0 | 1,323 (-1%) | 10mo | $39,000 | $29 | 62 |
| 451 Homewood Ave SE | 0.43mi | 3/1.0 | 1,189 (-11%) | 6mo | $68,000 | $57 | 56 |
| 781 Oak Knoll Ave SE | 0.38mi | 3/1.0 | 1,165 (-13%) | 6mo | $119,900 | $103 | 56 |
| 356 Laird Ave SE | 0.49mi | 4/2.0 (+1) | 1,404 (+5%) | 6mo | $127,000 | $90 | 54 |
| 948 Francis Ave SE | 0.53mi | 3/2.0 | 1,170 (-13%) | 8mo | $120,000 | $103 | 44 |
| 206 Oak Knoll Ave SE | 0.67mi | 3/1.5 | 1,436 (+7%) | 13mo | $128,500 | $89 | 44 |
| 405 Oak Knoll Ave SE | 0.55mi | 3/2.0 | 1,480 (+11%) | 11mo | $108,000 | $73 | 43 |
| 327 Adelaide | 0.66mi | 3/1.0 | 1,144 (-14%) | 6mo | $127,900 | $112 | 40 |
Match score weights: distance 35% · size 25% · config 20% · recency 20%. Top-matched comps best support the ARV.
Projected returns pro-forma
-3.0% appreciation · 3.0% rent growth · sell at horizon
- IRR
- 14.3%
- Equity multiple
- 1.57×
- Total profit
- $11,981
- Equity at exit
- $11,183
- IRR
- 23.0%
- Equity multiple
- 2.97×
- Total profit
- $41,435
- Equity at exit
- $6,485
Cash invested: $21,000 (down + closing). Projections, not guarantees.
Landlord ↔ Tenant lean methodology
- Overall (STATE)
- 73 Landlord-Friendly
- State Ohio
- 73 Landlord-Friendly · R+6
- County
- — inherits STATE
- City
- — inherits STATE
ZIP-level market 44483
- Home prices YoY
- -16.3%
- Active inventory
- 107
- Price-to-rent
- 6.0×
Monthly cashflow live
- Estimated rent
- $1,047 high interval (Pro) →
- Mortgage (P&I)
- −$393
- Tax from tax record
- −$24 /mo · $283/yr
- Insurance
- −$31
- HOA
- −$0
- Vacancy / Maint / Mgmt
- −$220
- Net cashflow
- $379
Break-even live
UW: 25.0% down · 7.5% · 30yr · 1.5% tax · 5.0% vac · 8.0% maint · 8.0% mgmt
Financing live
Cash to close
- Down payment
- $18,750
- Closing costs
- $2,250
- Reserves months
- —
- Total cash needed
- —
Loan-product check · same deal, 3 products live
Conventional
25% down · 7.5% · 30yr
- Down + closing
- —
- Monthly P&I
- —
- Monthly cashflow
- —
- DSCR
- —
- Eligible?
- —
Personal DTI + credit; lowest rate.
DSCR
20% down · 8.5% · 30yr
- Down + closing
- —
- Monthly P&I
- —
- Monthly cashflow
- —
- DSCR
- —
- Eligible?
- —
No personal income docs; deal must DSCR.
Hard money
10% down · 12.0% · 12mo
- Down + closing
- —
- Monthly P&I
- —
- Monthly cashflow
- —
- DSCR
- —
- Eligible?
- —
Short-term bridge; refi at stabilization.
Rent comps 6 comps
| Address | Beds | Baths | Sqft | Rent | $/sqft | DOM | Units | Dist |
|---|---|---|---|---|---|---|---|---|
| 1151 Kenilworth Ave SE Warren, OH | 2.0 | 1.0 | 1207 | $900 | $0.75 | 13d | 1 | 0.07mi |
| 840 Woodbine Ave SE Unit 838 Warren, OH | 2.0 | 1.0 | 1009 | $1,000 | $0.99 | 13d | 1 | 0.21mi |
| 341 Charles AVE Warren, OH | 3.0 | 1.0 | 1232 | $1,100 | $0.89 | 43d | 1 | 0.58mi |
| 259 Perkinswood Blvd NE Warren, OH | 1.0–2.0 | 1.0 | 743 | $845 | $1.14 | 13d | 3 | 1.14mi |
| 407 Washington St NE Niles, OH | 3.0 | 1.5 | 1388 | $1,250 | $0.90 | 13d | 1 | 1.35mi |
| 1216 Hollywood St NE Warren, OH | 3.0 | 1.0 | 1158 | $1,050 | $0.91 | 21d | 1 | 1.47mi |
Listing history 13 events
-
2026-06-13status $75,000 Pending 22 DOM
-
2026-06-10days on market $75,000 Active 22 DOM
-
2026-06-09days on market $75,000 Active 21 DOM
-
2026-06-08days on market $75,000 Active 20 DOM
-
2026-06-07days on market $75,000 Active 19 DOM
-
2026-06-05days on market $75,000 Active 16 DOM
-
2026-06-02days on market $75,000 Active 14 DOM
-
2026-06-01days on market $75,000 Active 13 DOM
-
2026-05-31days on market $75,000 Active 12 DOM
-
2026-05-30days on market $75,000 Active 11 DOM
-
2026-05-23status Active
-
2026-05-21historical Contingent
-
2026-05-19$75,000 Active
ⓘ Source: listings_history table (triggers on properties + properties_extension) + one-shot
backfill from property_details.listing_events for pre-trigger history.
Tax reassessment forecast OH · Partial reset (capped growth)
- Current annual tax
- $283 · $24/mo
- Projected year-2 tax
- $727 · $61/mo
- Expected delta
- +$443/yr (+$37/mo · 156.6%)
ⓘ Screening estimate from a state-policy table — verify with the county assessor before closing.
Climate risk First Street
- Flood 1/10 Low FEMA zone X (unshaded) · 0% chance over 30 yrs
- Wildfire 1/10 Low
- Heat 3/10 Moderate 7 d/yr ≥98°F today · 17 d/yr by 30 yrs out
- Wind 1/10 Low
- Air quality 3/10 Moderate 1 unhealthy d/yr today · 4 by 30 yrs out
Nearby sold comps map
Loading sold comps map…
Walkable amenities ~0.75 mi
Loading nearby amenities…
Taxation est. · year 1
- Rental income
- $12,570
- − Mortgage interest
- −$4,201
- − Property taxes
- −$283
- − Insurance
- −$375
- − Repairs & maintenance
- −$1,006
- − Management
- −$1,006
- − Depreciation
- −$2,182
- Taxable income
- $3,518
- Est. tax owed @ 24.0%
- −$844
- After-tax cash flow
- $3,708/yr
For passive investors: Depreciation is non-cash, so a rental often shows a tax loss while cash-flowing — sheltering income. Rental losses are passive: they offset passive income freely, and up to $25,000/yr can offset ordinary (W-2) income if you actively participate and your MAGI is under $100k (phasing out to $0 by $150k); unused losses carry forward. On sale, claimed depreciation is recaptured at up to 25%, and gains may owe capital-gains tax (a 1031 exchange can defer both). Figures are a year-1 estimate at your 24.0% rate — not tax advice; consult a CPA.
Schools (NCES district)
- District
- Warren City
- NCES district ID
- 3904499
- Math proficiency
- 22% ▼ -16.00%
- Reading proficiency
- 32% ▼ -9.00%
- Median HH income
- $28,222
- Composite
- 21.6/100
- National rank
- #8299
- State rank
- #599 of 656 in OH
Livability — Warren
- Score
- 73/100
- State rank
- #312
- US rank
- #5068
Category grades
Schools grade is shown separately in the Schools card above.
Census & demographics
- Census place
- Warren, OH
- County
- Trumbull County · 61,158 people
- City population
- 25,805
- Metro
- Youngstown-Warren-Boardman, OH-PA
- Population (ZIP)
- 25,805
- Household income
- $49,017
- Rent vs Own
- Severe rent burden
- 989.0
Population outlook (Trumbull County) Hauer SSP2
- Today (2025)
- 191,696 people
- By 2030
- 184,015 · -4.0%
- By 2040
- 166,810 · -13.0%
- By 2050
- 149,857 · -21.8%
- By 2075
- 115,769 · -39.6%
- By 2100
- 83,617 · -56.4%
Race, ethnicity, and origin ACS 2023
- Neighborhood character
- Predominantly White (77%)
- Race & ethnicity
- White 77% Black 14% Two or more races 7% Hispanic / Latino 4%
- Common ancestry
- Romanian 3% Slovak 2% Italian 1%
- Foreign-born
- 2% · Canada
- Languages at home
- 96% English-only · Other Indo-European 2% Spanish 2%
Political lean MEDSL · Trumbull
- 2024 margin
- R (+16.8) · D 41.2% · R 58.0%
- 2008→2024 swing
- -39.2pp toward R · 2008: 22.4pp · 2024: -16.8pp
- All cycles
- 2024: R+16.8 2020: R+10.6 2016: R+6.4 2012: D+22.2 2008: D+22.4
Not yet ingested
- Civics
- —
Market trends
- HPI YoY
- ▼ -42.50%
- Current HPI
- 218.3455
- Rent YoY
- —
- Metro
- Youngstown-Warren-Boardman, OH-PA
- State GDP YoY
- ▲ 1.98%
- F500 in state
- 48
Industry mix (Fortune 500 HQ in OH)
| Industry | F500 HQs | Revenue |
|---|---|---|
| Insurance | 3 | $145B |
|
||
| Industrial Machinery | 3 | $49B |
|
||
| Financial Services | 3 | $24B |
|
||
| Consumer Goods | 2 | $93B |
|
||
| Aerospace / Defense | 2 | $47B |
|
||
| Utilities | 2 | $33B |
|
||
Price history
3 events — show timeline
- 2026-05-23 Relisted — MLSNOW
- 2026-05-21 Contingent — MLSNOW
- 2026-05-19 Listed $75,000 MLSNOW
Property tax history
+42.0%/yrLatest (2025): $283 · -4.0% YoY. Source: county tax records.
Cash-flow waterfall
monthlySold comps — $/sqft
last 12 mo · ≤1 miLoading sold comps…