 🏷️ Likely Rental
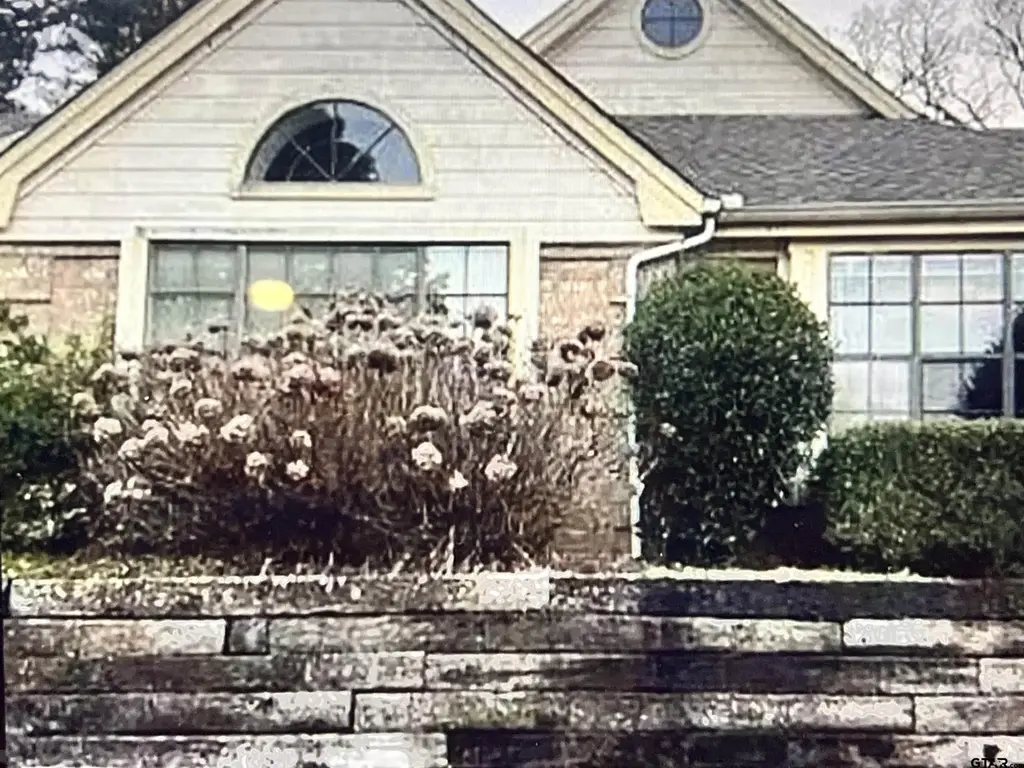
1727 Eaglewood Dr · Tyler, TX
Flood risk 1/10 · Minimal
- FEMA flood zone
- X (unshaded)
- Chance of flooding over 30 yrs
- 0.0%
- Est. flood insurance / yr
- $507 – $1,088
Fire risk 3/10 · Minor
- Est. fire insurance / yr
- $1,222 – $2,270
Heat risk 6/10 · Moderate
- Hot days now (above 109°F)
- 6 days/yr
- Hot days in 30 yrs
- 23 days/yr
Wind risk 6/10 · Moderate
- Chance of severe wind over 30 yrs
- 59.0%
Air-quality risk 2/10 · Minimal
- Unhealthy air days now
- 0 days/yr
- Unhealthy air days in 30 yrs
- 1 days/yr
Risk factors via First Street. Map © Google.
Why this score? — see what drove the D+ grade
The composite is a weighted blend of 9 inputs, each scored 0–100. Each bar is that input's sub-score; the figure is the points it added to the 100-point composite (weight × sub-score).
- ARV discount +15.0/15.0
- Cash flow +12.9/30.0
- Schools +5.5/10.0
- DSCR +3.9/10.0
- Livability +3.8/5.0
- 1% rule +3.4/10.0
- Condition / age +2.5/5.0
- Rent growth +2.0/5.0
- Appreciation +0.0/10.0
$171,900
🖨 Deal sheet 📄 Offer letter ✓ Due diligence
Listing remarks MLS
This home is currently leased. Monthly rent is $1450. Annual lease. Lease ends July 31 2026. Preapproval and or proof of funds required before viewing home. No owner finance. Bank or cash offer only. Renovated turn key ready. Makes for a great rental investment property. Centrally located in Tyler near shopping, restaurants and hospitals. Has been leased for years. Great property for monthly cash flow. This property has been well kept and maintained. Don't miss out on your next investment property to add to your portfolio.
Key facts
- Near hospitals
- Maintained
- Near shopping
Tags
Neighborhood map
What this means for you Summary
Snapshot
- This is a 2-bed/2.0-bath single-family listed at $172k.
Deal economics
- At list price, monthly cash flow is $-12 ($-144/yr) — negative.
- To cash-flow at today's rent, offer at most $170k (1.2% below list).
- To meet the 1% rule (rent ≥ 1% of price), the offer needs to be $145k (15.8% below list).
- Recommended offer: $145k (15.8% below list) — sets the bar for 1% rule.
- Cap rate 6.2% vs local median 3.6% in Tyler — top-decile yield for the area; either an underpriced asset or a hidden risk that comps aren't pricing in. Stress-test before assuming the spread holds.
Location & tenants
- Location reads 75/100 on livability (#147 in TX, #4,181 nationally) — a middle-class / working-renter tenant base. Strengths: cost of living A+, housing A+, health & safety A+; Watch: employment C-, schools D+, crime D+.
- Whitehouse ISD (suburban): math 68% / reading 59% proficiency, ranked #38 of 826 in TX (top 5%) — acceptable for families but not a draw, mixed tenant base, ~2y average lease.
- Market conditions: Rents soft (-1.9%/yr); 649 active listings in the ZIP; 34 comparable units currently listed for rent nearby; rentals at typical pace (median 22d on market — plan ~3-4 weeks tenant-placement turnaround); 47% of comp listings sitting > 30 days — soft ceiling on asking rent; solid renter incomes; 595 units permitted in Smith County in 2024 (45 in 5+ unit buildings).
Forward outlook
- Local home prices are declining (-3.0%/yr); year-one equity from $1k of loan paydown is wiped out by about $5k of value loss. Plan a longer hold.
- Smith County population projected at +24% by 2050 — long-run rental-demand tailwind backs the buy-and-hold thesis.
Negotiation context
- It's been on market 149 days — a 12% lower offer ($151k) is reasonable based on typical stale-listing flexibility.
- 2 sale attempts since 11y ago with the ask held roughly flat each time — persistent listings suggest the price (not the market) is what's stuck; bring a comps-based counter.
Risks & watch-outs
- Climate carrying-cost: major wind risk, 59% chance of damaging wind over 30y; extreme-heat days projected 6→23/yr by 2055 (HVAC capex compounding) — expect insurance premiums to compound above CPI over the hold.
Questions for the listing agent
- What do current leases actually rent for vs. the listed asking? Can we see a recent rent roll and the last 12 months of T-12 income?
- It's been on market 149 days. Have you received any prior offers? Is the seller open to a 16% concession, seller financing, or rate buy-down credit?
- Why hasn't it sold? Are there any deal-killer items the seller is aware of (foundation, flood, title, zoning, code violations)?
- Is there a deadline driving the sale (1031 exchange, divorce, estate, relocation)? That informs how much negotiation room exists.
- Schools are D-rated, which usually means shorter tenancies and higher turnover. Who's the typical renter profile here, and what's been the actual vacancy rate?
- Crime grade is D in this area — have there been break-ins, vandalism, or insurance claims at this property in the last 3 years? What carrier currently insures it and at what premium?
- The area grade is low — what's the realistic commute time and amenity access for the typical tenant pool here? Any planned neighborhood developments (good or bad) we should know about?
- What's the average days-on-market for RENTAL listings here right now (not sales)? A rising rental-DOM trend means longer vacancies and softer asking-rent achievability than the comps imply.
- What's the recent tenant-quality profile in this submarket — average credit score on applications, eviction rate, late-payment / NSF rate, and stable-employment percentage? A property-management company in the area should have these aggregated.
- How much new for-sale + rental construction is in the pipeline within 1–3 miles? Heavy new supply typically softens prices + rents 12–24 months out; constrained supply supports both.
Investment metrics
- 1% rule
- 0.84% ✗
- Cap rate
- 6.21%
- Cash-on-cash
- -0.30%
- DSCR
- 0.99
- GRM
- 9.9
CMA / ARV
- ARV (median comp)
- $225,715
- List price
- $171,900
- Delta
- -23.84%
- Verdict
- UNDERPRICED
- Comps
- 15 within 2.0 mi
Show comp detail 1 sale within ~0.75 mi
| Address | Dist | Beds/Ba | Sqft | Sold | Price | $/sf | Match |
|---|---|---|---|---|---|---|---|
| 5062 Shiloh Village Dr | 0.69mi | 3/2.0 (+1) | 1,374 (+14%) | 8mo | $273,500 | $199 | 33 |
Match score weights: distance 35% · size 25% · config 20% · recency 20%. Top-matched comps best support the ARV.
Projected returns pro-forma
-3.0% appreciation · 0.0% rent growth · sell at horizon
- IRR
- -20.1%
- Equity multiple
- 0.32×
- Total profit
- $-32,861
- Equity at exit
- $25,631
- IRR
- -21.3%
- Equity multiple
- 0.04×
- Total profit
- $-45,990
- Equity at exit
- $14,863
Cash invested: $48,132 (down + closing). Projections, not guarantees.
Landlord ↔ Tenant lean methodology
- Overall (STATE)
- 87 Strongly Landlord-Friendly
- State Texas
- 87 Strongly Landlord-Friendly · R+5
- County
- — inherits STATE
- City
- — inherits STATE
ZIP-level market 75703
- Rents YoY
- -1.9%
- Active inventory
- 649
- Price-to-rent
- 9.9×
Monthly cashflow live
- Estimated rent
- $1,448 high interval (Pro) →
- Mortgage (P&I)
- −$901
- Tax from tax record
- −$183 /mo · $2,194/yr
- Insurance
- −$72
- HOA
- −$0
- Vacancy / Maint / Mgmt
- −$304
- Net cashflow
- $-12
Break-even live
UW: 25.0% down · 7.5% · 30yr · 1.5% tax · 5.0% vac · 8.0% maint · 8.0% mgmt
Financing live
Cash to close
- Down payment
- $42,975
- Closing costs
- $5,157
- Reserves months
- —
- Total cash needed
- —
Loan-product check · same deal, 3 products live
Conventional
25% down · 7.5% · 30yr
- Down + closing
- —
- Monthly P&I
- —
- Monthly cashflow
- —
- DSCR
- —
- Eligible?
- —
Personal DTI + credit; lowest rate.
DSCR
20% down · 8.5% · 30yr
- Down + closing
- —
- Monthly P&I
- —
- Monthly cashflow
- —
- DSCR
- —
- Eligible?
- —
No personal income docs; deal must DSCR.
Hard money
10% down · 12.0% · 12mo
- Down + closing
- —
- Monthly P&I
- —
- Monthly cashflow
- —
- DSCR
- —
- Eligible?
- —
Short-term bridge; refi at stabilization.
Rent comps 34 comps
| Address | Beds | Baths | Sqft | Rent | $/sqft | DOM | Units | Dist |
|---|---|---|---|---|---|---|---|---|
| 1767 Eaglewood Dr Tyler, TX | 1.0 | 1.0 | 855 | $1,295 | $1.51 | 21d | 1 | 0.02mi |
| 5058 Paluxy Dr Tyler, TX | 1.0–3.0 | 1.0–2.0 | 965 | $1,427 | $1.48 | 13d | 11 | 0.56mi |
| 1717 Shiloh Rd Tyler, TX | 1.0–3.0 | 1.0–2.0 | 1000 | $1,190 | $1.19 | 13d | 10 | 0.66mi |
| 701 Shiloh Rd Tyler, TX | 1.0–2.0 | 1.0–2.0 | 899 | $1,295 | $1.44 | 13d | 6 | 0.93mi |
| 2525 Shiloh Rd Tyler, TX | 3.0–4.0 | 2.0 | 1360 | $1,379 | $1.01 | 13d | 1 | 1.04mi |
| 4600 Paluxy Dr Tyler, TX | 2.0 | 1.0–2.0 | 585 | $1,006 | $1.72 | 13d | 15 | 1.09mi |
| 4400 Paluxy Dr Tyler, TX | 1.0–3.0 | 1.0–2.0 | 905 | $1,044 | $1.15 | 13d | 60 | 1.20mi |
| 3021 Naomi Dr Tyler, TX | 3.0 | 3.0 | 1412 | $1,950 | $1.38 | 44d | 1 | 1.21mi |
| 3056 Naomi Dr Tyler, TX | 2.0 | 3.0 | 1251 | $1,795 | $1.43 | 44d | 1 | 1.25mi |
| 3239 Naomi Dr Tyler, TX | 2.0 | 3.0 | 1251 | $1,695 | $1.35 | 44d | 1 | 1.26mi |
| 3208 Naomi Dr Tyler, TX | 2.0 | 2.0 | 1251 | $1,695 | $1.35 | 44d | 1 | 1.27mi |
| 3257 Naomi Dr Tyler, TX | 2.0 | 2.5 | 1251 | $1,850 | $1.48 | 44d | 1 | 1.28mi |
| 3216 Naomi Dr Tyler, TX | 2.0 | 2.5 | 1251 | $1,850 | $1.48 | 44d | 1 | 1.28mi |
| 1011 McClenny Dr Tyler, TX | 2.0 | 2.0 | 1124 | $1,695 | $1.51 | 13d | 1 | 1.29mi |
| 4920 Thistle Dr Tyler, TX | 3.0 | 1.0–2.0 | 775 | $1,207 | $1.56 | 13d | 8 | 1.29mi |
| 6505 Rhones Quarter Rd Tyler, TX | 2.0–3.0 | 2.5 | 1331 | $1,795 | $1.35 | 44d | 3 | 1.29mi |
| 3374 Skyview Dr Tyler, TX | 2.0 | 3.0 | 1307 | $1,695 | $1.30 | 44d | 1 | 1.32mi |
| 4309 Aberdeen Dr Tyler, TX | 3.0 | 2.0 | 1219 | $1,475 | $1.21 | 44d | 1 | 1.34mi |
| 1909 Sybil Ln Tyler, TX | 1.0–3.0 | 1.0–2.0 | 1067 | $1,273 | $1.19 | 13d | 9 | 1.34mi |
| 8315 Garrett Dr Tyler, TX | 3.0 | 2.0 | 1346 | $1,600 | $1.19 | 21d | 1 | 1.34mi |
| 4518 Edinburgh Dr Unit 4520 Edinburgh Tyler, TX | 3.0 | 2.0 | 1436 | $1,425 | $0.99 | 21d | 1 | 1.36mi |
| 4520 Edinburgh Dr Tyler, TX | 3.0 | 2.0 | 1436 | $1,425 | $0.99 | 21d | 1 | 1.36mi |
| 4418 Edinburgh Dr Tyler, TX | 3.0 | 2.0 | 1407 | $1,750 | $1.24 | 44d | 1 | 1.39mi |
| 8101 Karen Dr Tyler, TX | 2.0 | 1.0 | 1300 | $1,625 | $1.25 | 44d | 1 | 1.39mi |
| 6331 Villa Rosa Way Unit 6331 Tyler, TX | 3.0 | 2.0 | 1498 | $1,895 | $1.27 | 21d | 1 | 1.41mi |
| 6308 Villa Rosa Way Tyler, TX | 2.0 | 2.0 | 1339 | $1,650 | $1.23 | 21d | 1 | 1.42mi |
| 6015 Villa Rosa Way Tyler, TX | 3.0 | 2.0 | 1498 | $1,895 | $1.27 | 44d | 1 | 1.42mi |
| 6017 Villa Rosa Way Unit 6017 Tyler, TX | 3.0 | 2.0 | 1498 | $1,895 | $1.27 | 21d | 1 | 1.43mi |
| 6023 Villa Rosa Way Unit 6023 Tyler, TX | 2.0 | 2.0 | 1348 | $1,650 | $1.22 | 44d | 1 | 1.44mi |
| 6228 Villa Rosa Way Unit 6228 Tyler, TX | 3.0 | 2.0 | 1498 | $1,895 | $1.27 | 44d | 1 | 1.44mi |
| 6218 Villa Rosa Way Unit 6218 Tyler, TX | 3.0 | 2.0 | 1498 | $1,895 | $1.27 | 44d | 1 | 1.46mi |
| 8414 Cambridge Rd Unit C04 Tyler, TX | 3.0 | 2.0 | 1206 | $1,495 | $1.24 | 21d | 1 | 1.47mi |
| 6036 Villa Rosa Way Unit 6036 Tyler, TX | 3.0 | 2.0 | 1498 | $1,850 | $1.23 | 44d | 1 | 1.47mi |
| 4400 Troup Hwy Tyler, TX | 1.0–2.0 | 1.0–2.0 | 744 | $1,224 | $1.64 | 13d | 10 | 1.48mi |
Listing history 24 events
-
2026-06-19days on market $171,900 Active 149 DOM
-
2026-06-18days on market $171,900 Active 148 DOM
-
2026-06-17days on market $171,900 Active 147 DOM
-
2026-06-16days on market $171,900 Active 146 DOM
-
2026-06-15days on market $171,900 Active 145 DOM
-
2026-06-14days on market $171,900 Active 143 DOM
-
2026-06-13days on market $171,900 Active 142 DOM
-
2026-06-10days on market $171,900 Active 140 DOM
-
2026-06-09days on market $171,900 Active 139 DOM
-
2026-06-08days on market $171,900 Active 138 DOM
-
2026-06-07days on market $171,900 Active 137 DOM
-
2026-06-05days on market $171,900 Active 134 DOM
-
2026-06-02days on market $171,900 Active 132 DOM
-
2026-06-01days on market $171,900 Active 131 DOM
-
2026-05-31days on market $171,900 Active 130 DOM
-
2026-05-30days on market $171,900 Active 129 DOM
-
2026-03-30price $171,900 529-char remark
Show marketing remark (529 chars)
This home is currently leased. Monthly rent is $1450. Annual lease. Lease ends July 31 2026. Preapproval and or proof of funds required before viewing home. No owner finance. Bank or cash offer only. Renovated turn key ready. Makes for a great rental investment property. Centrally located in Tyler near shopping, restaurants and hospitals. Has been leased for years. Great property for monthly cash flow. This property has been well kept and maintained. Don't miss out on your next investment property to add to your portfolio.
-
2026-03-14price $174,900 529-char remark
Show marketing remark (529 chars)
This home is currently leased. Monthly rent is $1450. Annual lease. Lease ends July 31 2026. Preapproval and or proof of funds required before viewing home. No owner finance. Bank or cash offer only. Renovated turn key ready. Makes for a great rental investment property. Centrally located in Tyler near shopping, restaurants and hospitals. Has been leased for years. Great property for monthly cash flow. This property has been well kept and maintained. Don't miss out on your next investment property to add to your portfolio.
-
2026-01-21$179,900 Active 529-char remark
Show marketing remark (529 chars)
This home is currently leased. Monthly rent is $1450. Annual lease. Lease ends July 31 2026. Preapproval and or proof of funds required before viewing home. No owner finance. Bank or cash offer only. Renovated turn key ready. Makes for a great rental investment property. Centrally located in Tyler near shopping, restaurants and hospitals. Has been leased for years. Great property for monthly cash flow. This property has been well kept and maintained. Don't miss out on your next investment property to add to your portfolio.
-
2017-12-07soldstatus
-
2015-03-02soldstatus
-
2015-02-27soldstatus 246-char remark
Show marketing remark (246 chars)
Wonderful opportunity! 2 bedroom, 2 bathroom town home in Whitehouse schools. Low maintenance! Nice living area, breakfast area, good sized kitchen, two good sized bedrooms; clean and neat! Could be great rental property, too! Come See! Come Buy!
-
2015-01-08$94,500 246-char remark
Show marketing remark (246 chars)
Wonderful opportunity! 2 bedroom, 2 bathroom town home in Whitehouse schools. Low maintenance! Nice living area, breakfast area, good sized kitchen, two good sized bedrooms; clean and neat! Could be great rental property, too! Come See! Come Buy!
-
1993-09-15soldstatus
ⓘ Source: listings_history table (triggers on properties + properties_extension) + one-shot
backfill from property_details.listing_events for pre-trigger history.
Tax reassessment forecast TX · Resets to sale price
- Current annual tax
- $2,194 · $183/mo
- Projected year-2 tax
- $3,146 · $262/mo
- Expected delta
- +$952/yr (+$79/mo · 43.4%)
ⓘ Screening estimate from a state-policy table — verify with the county assessor before closing.
Climate risk First Street
- Flood 1/10 Low FEMA zone X (unshaded) · 0% chance over 30 yrs
- Wildfire 3/10 Moderate
- Heat 6/10 Major 6 d/yr ≥109°F today · 23 d/yr by 30 yrs out
- Wind 6/10 Major 59% chance of damaging wind over 30 yrs
- Air quality 2/10 Low 0 unhealthy d/yr today · 1 by 30 yrs out
Nearby sold comps map
Loading sold comps map…
Walkable amenities ~0.75 mi
Loading nearby amenities…
Taxation est. · year 1
- Rental income
- $17,376
- − Mortgage interest
- −$9,629
- − Property taxes
- −$2,194
- − Insurance
- −$860
- − Repairs & maintenance
- −$1,390
- − Management
- −$1,390
- − Depreciation
- −$5,001
- Taxable loss
- −$3,087
- Est. tax savings @ 24.0%
- +$741
- After-tax cash flow
- $597/yr
For passive investors: Depreciation is non-cash, so a rental often shows a tax loss while cash-flowing — sheltering income. Rental losses are passive: they offset passive income freely, and up to $25,000/yr can offset ordinary (W-2) income if you actively participate and your MAGI is under $100k (phasing out to $0 by $150k); unused losses carry forward. On sale, claimed depreciation is recaptured at up to 25%, and gains may owe capital-gains tax (a 1031 exchange can defer both). Figures are a year-1 estimate at your 24.0% rate — not tax advice; consult a CPA.
Schools (NCES district)
- District
- Whitehouse ISD
- NCES district ID
- 4845600
- Math proficiency
- 68% ▼ -4.00%
- Reading proficiency
- 59% ▼ -1.00%
- Median HH income
- $62,060
- Composite
- 55.18/100
- National rank
- #1274
- State rank
- #38 of 826 in TX
Livability — Tyler
- Score
- 75/100
- State rank
- #147
- US rank
- #4181
Category grades
Schools grade is shown separately in the Schools card above.
Census & demographics
- Census place
- Tyler, TX
- County
- Smith County · 180,570 people
- City population
- 127,842
- Metro
- Tyler, TX
- Population (ZIP)
- 46,039
- Household income
- $79,194
- Rent vs Own
- Severe rent burden
- 1585.0
Population outlook (Smith County) Hauer SSP2
- Today (2025)
- 248,890 people
- By 2030
- 261,665 · +5.1%
- By 2040
- 286,114 · +15.0%
- By 2050
- 308,006 · +23.8%
- By 2075
- 354,171 · +42.3%
- By 2100
- 372,828 · +49.8%
Race, ethnicity, and origin ACS 2023
- Neighborhood character
- Predominantly White (66%)
- Race & ethnicity
- White 66% Black 17% Hispanic / Latino 10% Two or more races 7% Asian 4%
- Hispanic origin (detail)
- Mexican 8%
- Common ancestry
- Slovak 3% Italian 2% Lithuanian 2%
- Foreign-born
- 7% · Canada, China, Vietnam
- Languages at home
- 89% English-only · Spanish 6% Other Indo-European 1% Tagalog/Filipino 1%
Political lean MEDSL · Smith
- 2024 margin
- Solid R (+45.1) · D 27.0% · R 72.1%
- 2008→2024 swing
- -5.6pp toward R · 2008: -39.5pp · 2024: -45.1pp
- All cycles
- 2024: R+45.1 2020: R+39.4 2016: R+43.9 2012: R+46.9 2008: R+39.5
Not yet ingested
- Civics
- —
Market trends
- HPI YoY
- ▼ -218.79%
- Current HPI
- 182.3842
- Rent YoY
- ▼ -1.95%
- Metro
- Tyler, TX
- State GDP YoY
- ▲ 3.95%
- F500 in state
- 110
Industry mix (Fortune 500 HQ in TX)
| Industry | F500 HQs | Revenue |
|---|---|---|
| Energy | 16 | $1,198B |
|
||
| Technology | 5 | $198B |
|
||
| Engineering / Construction | 4 | $72B |
|
||
| Energy Services | 3 | $60B |
|
||
| Utilities | 3 | $41B |
|
||
| Healthcare | 2 | $330B |
|
||
Price history
+81.9% since first listed8 events — show timeline
- 2026-03-30 Price Changed $171,900 GTAR
- 2026-03-14 Price Changed $174,900 GTAR
- 2026-01-21 Listed $179,900 GTAR
- 2017-12-07 Sold (Public Records) — Public Records
- 2015-03-02 Sold (Public Records) — Public Records
- 2015-02-27 Sold (MLS) — GTAR
- 2015-01-08 Listed $94,500 GTAR
- 1993-09-15 Sold (Public Records) — Public Records
Property tax history
+3.6%/yrLatest (2024): $2,194 · -6.2% YoY. Source: county tax records.
Cash-flow waterfall
monthlySold comps — $/sqft
last 12 mo · ≤1 miLoading sold comps…