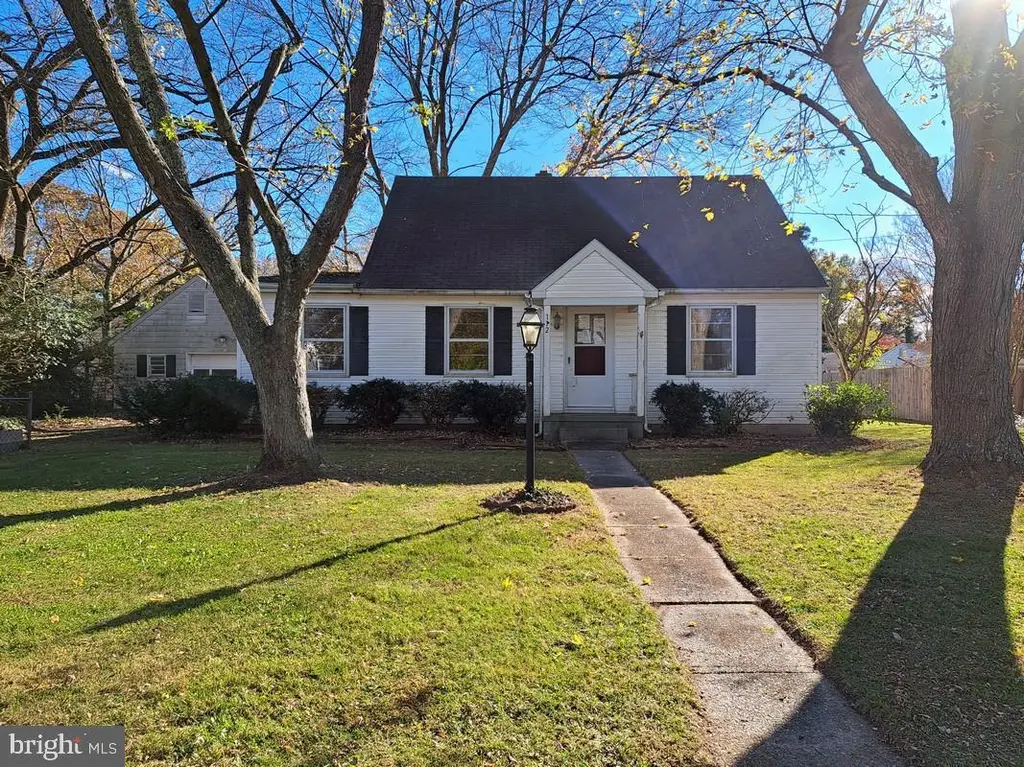
112 Johnson Dr · Salisbury, MD
Flood risk 1/10 · Minimal
- FEMA flood zone
- X (unshaded)
- Chance of flooding over 30 yrs
- 0.0%
- Est. flood insurance / yr
- $507 – $1,088
Fire risk 1/10 · Minimal
- Est. fire insurance / yr
- $755 – $1,403
Heat risk 8/10 · Major
- Hot days now (above 105°F)
- 7 days/yr
- Hot days in 30 yrs
- 16 days/yr
Wind risk 8/10 · Major
- Chance of severe wind over 30 yrs
- 80.0%
Air-quality risk 2/10 · Minimal
- Unhealthy air days now
- 2 days/yr
- Unhealthy air days in 30 yrs
- 2 days/yr
Risk factors via First Street. Map © Google.
Why this score? — see what drove the B grade
The composite is a weighted blend of 9 inputs, each scored 0–100. Each bar is that input's sub-score; the figure is the points it added to the 100-point composite (weight × sub-score).
- Cash flow +27.6/30.0
- ARV discount +15.0/15.0
- DSCR +9.7/10.0
- 1% rule +7.0/10.0
- Rent growth +3.4/5.0
- Livability +3.0/5.0
- Condition / age +2.5/5.0
- Schools +1.9/10.0
- Appreciation +0.0/10.0
$165,000
🖨 Deal sheet 📄 Offer letter ✓ Due diligence
Listing remarks MLS
Discover this Cape Cod-style home nestled in the serene Coulbourn Manor. With 1,669 sq. ft. of thoughtfully designed living space, this delightful residence features four spacious bedrooms and one and a half bathrooms, perfect for both relaxation and entertaining. Step inside to find a warm and inviting atmosphere, highlighted by carpet floors and a cozy eat-in kitchen with custom-built cabinets and appliances. The main level bedroom offers convenience, while the attic provides additional storage or potential for creative use. Outside, the property boasts a generous 0.33-acre lot, featuring a secluded rear yard surrounded by mature trees, creating a peaceful retreat. The deck invites you to unwind and enjoy the outdoors, while the detached garage offers ample storage and parking. A charming gazebo adds a touch of elegance to your outdoor space, perfect for gatherings or quiet moments. The property is walking distance to Salisbury University, baseball & soccer fields, Sea Gull Stadium and ACME Market. In addition, it is an 11-minute car travel to Salisbury Regional Airport and 12 minutes away from The Centre At Salisbury. Its prime location enhances the home's investment value. So, don't miss the opportunity to make this home yours!
Key facts
- Main level bedroom
- Cape cod style home
- Attic storage
Tags
Neighborhood map
What this means for you Summary
Snapshot
- This is a 4-bed/1.5-bath single-family listed at $165k.
Deal economics
- At list price, monthly cash flow is $492 ($6k/yr) — positive.
- The deal already cash-flows at list — no discount required.
- Meets the 1% rule at list price ($2k rent vs $165k).
- Recommended offer: $145k (12.0% below list) — sets the bar for market timing.
- Cap rate 9.9% vs local median 4.8% in Salisbury — top-decile yield for the area; either an underpriced asset or a hidden risk that comps aren't pricing in. Stress-test before assuming the spread holds.
Location & tenants
- Location reads 60/100 on livability (#351 in MD) — a middle-class / working-renter tenant base. Strengths: health & safety A+, cost of living A, housing A; Watch: schools D-, crime F, amenities F.
- Wicomico County Public Schools (urban): math 16% / reading 26% proficiency, ranked #19 of 24 in MD (top 79%) — low school quality limits family demand, transient renter base, plan for 1-2y turnover.
- Market conditions: Rents rising (+3.8%/yr); 195 active listings in the ZIP; 11 comparable units currently listed for rent nearby; rentals leasing fast (median 14d on market — plan ~1-2 weeks tenant-placement turnaround); 45% of comp listings sitting > 30 days — soft ceiling on asking rent; 278 units permitted in Wicomico County in 2024 (44 in 5+ unit buildings).
- This rent runs 32% of the median local income ($73k/yr) — at the standard rent-burdened threshold; future hikes will face affordability resistance.
Forward outlook
- Local home prices are declining (-3.0%/yr); year-one equity from $1k of loan paydown is wiped out by about $5k of value loss. Plan a longer hold.
- Wicomico County population projected at +14% by 2050 — modest demand growth; plan on rents tracking national, not racing it.
- At projected returns (-3.0% appreciation + 3.8% rent growth), your $46k cash investment doubles in ~9 years — after that, you're playing with house money.
Negotiation context
- It's been on market 131 days — a 12% lower offer ($145k) is reasonable based on typical stale-listing flexibility.
Risks & watch-outs
- Watch-outs: built in 1956 — expect roof / HVAC / electrical / plumbing capex.
- Climate carrying-cost: severe wind risk, 80% chance of damaging wind over 30y; extreme-heat days projected 7→16/yr by 2055 (HVAC capex compounding) — expect insurance premiums to compound above CPI over the hold.
Questions for the listing agent
- It's been on market 131 days. Have you received any prior offers? Is the seller open to a 12% concession, seller financing, or rate buy-down credit?
- Built in 1956 — when were the roof, HVAC, electrical panel, plumbing, and water heater last replaced?
- Why hasn't it sold? Are there any deal-killer items the seller is aware of (foundation, flood, title, zoning, code violations)?
- Is there a deadline driving the sale (1031 exchange, divorce, estate, relocation)? That informs how much negotiation room exists.
- Schools are D-rated, which usually means shorter tenancies and higher turnover. Who's the typical renter profile here, and what's been the actual vacancy rate?
- Crime grade is F in this area — have there been break-ins, vandalism, or insurance claims at this property in the last 3 years? What carrier currently insures it and at what premium?
- What's the average days-on-market for RENTAL listings here right now (not sales)? A rising rental-DOM trend means longer vacancies and softer asking-rent achievability than the comps imply.
- What's the recent tenant-quality profile in this submarket — average credit score on applications, eviction rate, late-payment / NSF rate, and stable-employment percentage? A property-management company in the area should have these aggregated.
- How much new for-sale + rental construction is in the pipeline within 1–3 miles? Heavy new supply typically softens prices + rents 12–24 months out; constrained supply supports both.
Investment metrics
- 1% rule
- 1.20% ✓
- Cap rate
- 9.87%
- Cash-on-cash
- 12.79%
- DSCR
- 1.57
- GRM
- 7.0
CMA / ARV
- ARV (median comp)
- $262,604
- List price
- $165,000
- Delta
- -37.17%
- Verdict
- UNDERPRICED
- Comps
- 20 within 1.0 mi
Show comp detail 12 sales within ~0.75 mi
| Address | Dist | Beds/Ba | Sqft | Sold | Price | $/sf | Match |
|---|---|---|---|---|---|---|---|
| 1500 Laurel Dr | 0.38mi | 4/2.0 | 1,673 (+0%) | 8mo | $210,000 | $126 | 73 |
| 202 Castlebar Dr | 0.24mi | 3/3.0 (-1) | 1,608 (-4%) | 11mo | $180,000 | $112 | 62 |
| 202 Donegal Ct | 0.26mi | 3/2.5 (-1) | 1,552 (-7%) | 6mo | $280,000 | $180 | 62 |
| 202 Sandy Bottom Ct | 0.33mi | 3/2.0 (-1) | 1,813 (+9%) | 2mo | $414,000 | $228 | 62 |
| 213 Morris Dr | 0.49mi | 3/1.5 (-1) | 1,727 (+4%) | 13mo | $260,000 | $151 | 55 |
| 206 Castlebar Dr | 0.26mi | 3/2.5 (-1) | 1,512 (-9%) | 13mo | $290,000 | $192 | 53 |
| 176 Emily Dr | 0.62mi | 4/2.5 | 1,704 (+2%) | 16mo | $282,000 | $165 | 51 |
| 223 Creekside Dr | 0.38mi | 3/2.5 (-1) | 1,918 (+15%) | 1mo | $385,000 | $201 | 48 |
| 1506 Rose Dr | 0.43mi | 3/2.0 (-1) | 1,428 (-14%) | 4mo | $280,000 | $196 | 46 |
| 207 Morris Dr | 0.42mi | 3/2.0 (-1) | 1,450 (-13%) | 8mo | $295,000 | $203 | 45 |
| 168 Emily Dr | 0.62mi | 3/2.5 (-1) | 1,546 (-7%) | 12mo | $314,900 | $204 | 40 |
| 187 Emily Dr | 0.63mi | 3/2.5 (-1) | 1,907 (+14%) | 8mo | $315,000 | $165 | 31 |
Match score weights: distance 35% · size 25% · config 20% · recency 20%. Top-matched comps best support the ARV.
Projected returns pro-forma
-3.0% appreciation · 3.78% rent growth · sell at horizon
- IRR
- 3.4%
- Equity multiple
- 1.13×
- Total profit
- $6,161
- Equity at exit
- $24,602
- IRR
- 13.7%
- Equity multiple
- 2.13×
- Total profit
- $52,182
- Equity at exit
- $14,266
Cash invested: $46,200 (down + closing). Projections, not guarantees.
Landlord ↔ Tenant lean methodology
- Overall (STATE)
- 27 Tenant-Leaning
- State Maryland
- 27 Tenant-Leaning · D+14
- County
- — inherits STATE
- City
- — inherits STATE
ZIP-level market 21804
- Home prices YoY
- -26.7%
- Rents YoY
- 3.8%
- Active inventory
- 195
- Price-to-rent
- 7.0×
Monthly cashflow live
- Estimated rent
- $1,974 high interval (Pro) →
- Mortgage (P&I)
- −$865
- Tax from tax record
- −$133 /mo · $1,597/yr
- Insurance
- −$69
- HOA
- −$0
- Vacancy / Maint / Mgmt
- −$415
- Net cashflow
- $492
Break-even live
UW: 25.0% down · 7.5% · 30yr · 1.5% tax · 5.0% vac · 8.0% maint · 8.0% mgmt
Financing live
Cash to close
- Down payment
- $41,250
- Closing costs
- $4,950
- Reserves months
- —
- Total cash needed
- —
Loan-product check · same deal, 3 products live
Conventional
25% down · 7.5% · 30yr
- Down + closing
- —
- Monthly P&I
- —
- Monthly cashflow
- —
- DSCR
- —
- Eligible?
- —
Personal DTI + credit; lowest rate.
DSCR
20% down · 8.5% · 30yr
- Down + closing
- —
- Monthly P&I
- —
- Monthly cashflow
- —
- DSCR
- —
- Eligible?
- —
No personal income docs; deal must DSCR.
Hard money
10% down · 12.0% · 12mo
- Down + closing
- —
- Monthly P&I
- —
- Monthly cashflow
- —
- DSCR
- —
- Eligible?
- —
Short-term bridge; refi at stabilization.
Rent comps 11 comps
| Address | Beds | Baths | Sqft | Rent | $/sqft | DOM | Units | Dist |
|---|---|---|---|---|---|---|---|---|
| 255 Canal Park Dr Apt C Salisbury, MD | 4.0 | 2.0 | 1250 | $1,600 | $1.28 | 44d | 1 | 0.55mi |
| 101 Cedar Xing Salisbury, MD | 4.0 | 2.0–4.0 | 965 | $1,375 | $1.42 | 13d | 9 | 0.67mi |
| 306 Carrollton Ave Salisbury, MD | 4.0 | 1.0 | 1163 | $1,700 | $1.46 | 44d | 1 | 1.05mi |
| 1000 Marley Manor Dr Salisbury, MD | 2.0–3.0 | 2.0 | 1225 | $2,076 | $1.69 | 13d | 20 | 1.12mi |
| 421 Loblolly Ln Salisbury, MD | 3.0 | 2.0 | 1514 | $2,250 | $1.49 | 44d | 1 | 1.18mi |
| 830 Larch Way Unit 1 Salisbury, MD | 3.0 | 2.5 | 1568 | $1,900 | $1.21 | 13d | 1 | 1.33mi |
| 830 Larch Way Salisbury, MD | 3.0 | 2.5 | 1568 | $2,000 | $1.28 | 13d | 1 | 1.33mi |
| 830 Larch Way Salisbury, MD | 3.0 | 3.0 | 1568 | $2,000 | $1.28 | 44d | 1 | 1.33mi |
| 732 Wye Oak Dr Fruitland, MD | 3.0 | 2.5 | 1396 | $2,300 | $1.65 | 44d | 1 | 1.39mi |
| 1017 Baccharis Dr Salisbury, MD | 3.0 | 2.5 | 1568 | $1,895 | $1.21 | 13d | 1 | 1.41mi |
| 719 Shiloh St Unit 1 Salisbury, MD | 3.0 | 1.0 | 1152 | $1,625 | $1.41 | 13d | 1 | 1.48mi |
Listing history 16 events
-
2026-06-18days on market $165,000 Active 131 DOM
-
2026-06-17days on market $165,000 Active 130 DOM
-
2026-06-16days on market $165,000 Active 129 DOM
-
2026-06-15days on market $165,000 Active 128 DOM
-
2026-06-14days on market $165,000 Active 126 DOM
-
2026-06-13pricedays on market $165,000 Active 125 DOM
-
2026-06-10days on market $175,000 Active 123 DOM
-
2026-06-09days on market $175,000 Active 122 DOM
-
2026-06-08days on market $175,000 Active 121 DOM
-
2026-06-07days on market $175,000 Active 120 DOM
-
2026-06-03days on market $175,000 Active 116 DOM
-
2026-06-02days on market $175,000 Active 115 DOM
-
2026-06-01pricedays on market $175,000 Active 114 DOM
-
2026-05-31days on market $190,000 Active 113 DOM
-
2026-05-30days on market $190,000 Active 112 DOM
-
2026-02-07$190,000 Active 1257-char remark
Show marketing remark (1257 chars)
Discover this Cape Cod-style home nestled in the serene Coulbourn Manor. With 1,669 sq. ft. of thoughtfully designed living space, this delightful residence features four spacious bedrooms and one and a half bathrooms, perfect for both relaxation and entertaining. Step inside to find a warm and inviting atmosphere, highlighted by carpet floors and a cozy eat-in kitchen with custom-built cabinets and appliances. The main level bedroom offers convenience, while the attic provides additional storage or potential for creative use. Outside, the property boasts a generous 0.33-acre lot, featuring a secluded rear yard surrounded by mature trees, creating a peaceful retreat. The deck invites you to unwind and enjoy the outdoors, while the detached garage offers ample storage and parking. A charming gazebo adds a touch of elegance to your outdoor space, perfect for gatherings or quiet moments. The property is walking distance to Salisbury University, baseball & soccer fields, Sea Gull Stadium and ACME Market. In addition, it is an 11-minute car travel to Salisbury Regional Airport and 12 minutes away from The Centre At Salisbury. Its prime location enhances the home's investment value. So, don't miss the opportunity to make this home yours!
ⓘ Source: listings_history table (triggers on properties + properties_extension) + one-shot
backfill from property_details.listing_events for pre-trigger history.
Tax reassessment forecast MD · Partial reset (capped growth)
- Current annual tax
- $1,597 · $133/mo
- Projected year-2 tax
- $1,698 · $141/mo
- Expected delta
- +$101/yr (+$8/mo · 6.3%)
ⓘ Screening estimate from a state-policy table — verify with the county assessor before closing.
Climate risk First Street
- Flood 1/10 Low FEMA zone X (unshaded) · 0% chance over 30 yrs
- Wildfire 1/10 Low
- Heat 8/10 Severe 7 d/yr ≥105°F today · 16 d/yr by 30 yrs out
- Wind 8/10 Severe 80% chance of damaging wind over 30 yrs
- Air quality 2/10 Low 2 unhealthy d/yr today · 2 by 30 yrs out
Nearby sold comps map
Loading sold comps map…
Walkable amenities ~0.75 mi
Loading nearby amenities…
Taxation est. · year 1
- Rental income
- $23,687
- − Mortgage interest
- −$9,243
- − Property taxes
- −$1,597
- − Insurance
- −$825
- − Repairs & maintenance
- −$1,895
- − Management
- −$1,895
- − Depreciation
- −$4,800
- Taxable income
- $3,432
- Est. tax owed @ 24.0%
- −$824
- After-tax cash flow
- $5,083/yr
For passive investors: Depreciation is non-cash, so a rental often shows a tax loss while cash-flowing — sheltering income. Rental losses are passive: they offset passive income freely, and up to $25,000/yr can offset ordinary (W-2) income if you actively participate and your MAGI is under $100k (phasing out to $0 by $150k); unused losses carry forward. On sale, claimed depreciation is recaptured at up to 25%, and gains may owe capital-gains tax (a 1031 exchange can defer both). Figures are a year-1 estimate at your 24.0% rate — not tax advice; consult a CPA.
Schools (NCES district)
- District
- Wicomico County Public Schools
- NCES district ID
- 2400690
- Math proficiency
- 16% ▼ -18.00%
- Reading proficiency
- 26% ▼ -13.00%
- Median HH income
- $51,745
- Composite
- 18.87/100
- National rank
- #8860
- State rank
- #19 of 24 in MD
Livability — Salisbury
- Score
- 60/100
- State rank
- #351
- US rank
- #18948
Category grades
Schools grade is shown separately in the Schools card above.
Census & demographics
- County
- Wicomico County · 75,969 people
- City population
- 70,518
- Metro
- Salisbury, MD-DE
- Population (ZIP)
- 40,430
- Household income
- $73,156
- Rent vs Own
- Severe rent burden
- 2096.0
Population outlook (Wicomico County) Hauer SSP2
- Today (2025)
- 108,548 people
- By 2030
- 111,783 · +3.0%
- By 2040
- 118,139 · +8.8%
- By 2050
- 123,641 · +13.9%
- By 2075
- 139,784 · +28.8%
- By 2100
- 145,334 · +33.9%
Race, ethnicity, and origin ACS 2023
- Neighborhood character
- Diverse neighborhood (Simpson 0.61)
- Race & ethnicity
- White 54% Black 30% Two or more races 9% Hispanic / Latino 7% Asian 3%
- Hispanic origin (detail)
- Mexican 4% Dominican 1%
- Common ancestry
- Hispanic 8% Romanian 3% Slovak 1%
- Foreign-born
- 13% · Canada, Vietnam, South Korea
- Languages at home
- 83% English-only · French/Haitian/Cajun 7% Spanish 5% Other Indo-European 2%
Political lean MEDSL · Wicomico
- 2024 margin
- Lean R (+5.5) · D 46.1% · R 51.5% · Other 2.4%
- 2008→2024 swing
- +0.3pp no change · 2008: -5.8pp · 2024: -5.5pp
- All cycles
- 2024: R+5.5 2020: R+1.9 2016: R+11.6 2012: R+6.9 2008: R+5.8
Not yet ingested
- Civics
- —
Market trends
- HPI YoY
- ▼ -84.15%
- Current HPI
- 230.6099
- Rent YoY
- ▲ 3.78%
- Metro
- Salisbury, MD-DE
- State GDP YoY
- ▲ 2.97%
- F500 in state
- 12
Industry mix (Fortune 500 HQ in MD)
| Industry | F500 HQs | Revenue |
|---|---|---|
| Aerospace / Defense | 1 | $71B |
|
||
| Utilities | 1 | $25B |
|
||
| Hotels | 1 | $24B |
|
||
| Consumer Goods | 1 | $7B |
|
||
| Real Estate | 1 | $6B |
|
||
| Chemicals | 1 | $2B |
|
||
Price history
1 event — show timeline
- 2026-02-07 Listed $190,000 BRIGHT MLS
Property tax history
+2.8%/yrLatest (2025): $1,597 · +3.1% YoY. Source: county tax records.
Cash-flow waterfall
monthlySold comps — $/sqft
last 12 mo · ≤1 miLoading sold comps…