 🏷️ Likely Rental
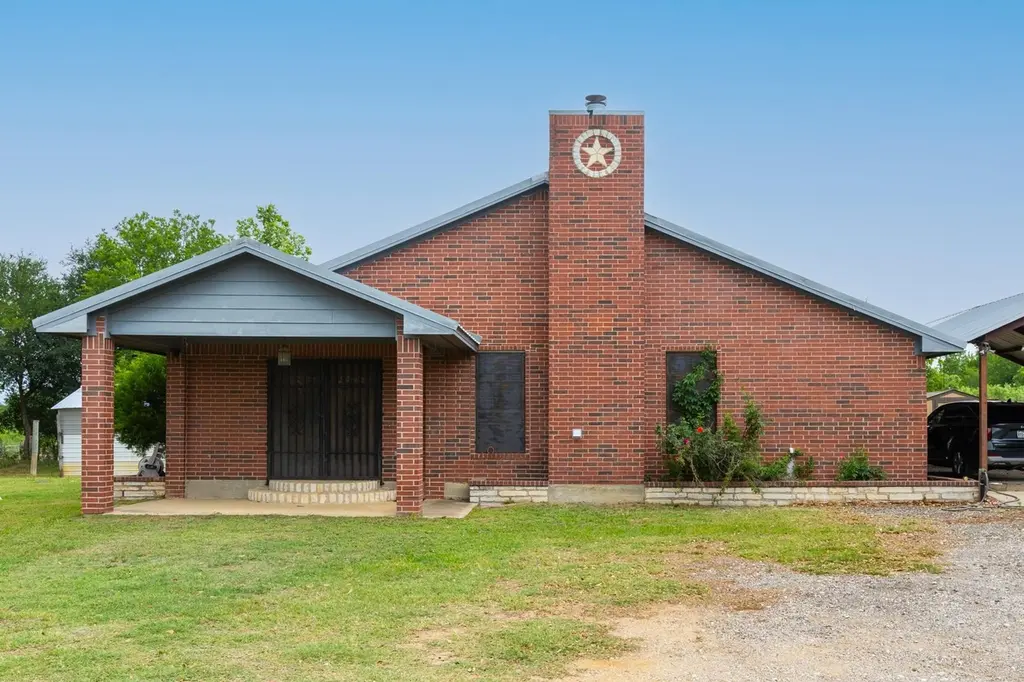
176 Old Lexington Rd Unit C · Elgin, TX
Flood risk No data
- FEMA flood zone
- —
- Chance of flooding over 30 yrs
- —
- Est. flood insurance / yr
- —
Fire risk No data
- Est. fire insurance / yr
- —
Heat risk No data
- Hot days now (above threshold)
- —
- Hot days in 30 yrs
- —
Wind risk No data
- Chance of severe wind over 30 yrs
- —
Air-quality risk No data
- Unhealthy air days now
- —
- Unhealthy air days in 30 yrs
- —
Risk factors via First Street. Map © Google.
Why this score? — see what drove the D- grade
The composite is a weighted blend of 9 inputs, each scored 0–100. Each bar is that input's sub-score; the figure is the points it added to the 100-point composite (weight × sub-score).
- ARV discount +15.0/15.0
- Appreciation +10.0/10.0
- Livability +3.7/5.0
- Rent growth +3.3/5.0
- Cash flow +3.2/30.0
- Condition / age +2.5/5.0
- Schools +2.0/10.0
- 1% rule +0.3/10.0
- DSCR +0.0/10.0
$320,000
🖨 Deal sheet 📄 Offer letter ✓ Due diligence
Listing remarks MLS
Beautiful country living property 5 minutes from downtown Elgin, Main house has two bedrooms, one full bath and one 1/2 bath, Guest house has one bedroom, full bath, kitchen dining and living area, presently is leased for 1K month to month, Fully fenced with mature trees, oversize metal carport for 4 cars, come and see it, wont last under 350K 24 hours notice, showings from 10 am to 8 pm seller works from home and has three babies.
Key facts
- Downtown elgin
- Fully fenced
- Guest house
Tags
Neighborhood map
What this means for you Summary
Snapshot
- This is a 2-bed/1.5-bath single-family listed at $320k.
Deal economics
- At list price, monthly cash flow is $-1k ($-12k/yr) — negative.
- To cash-flow at today's rent, offer at most $141k (56.0% below list).
- To meet the 1% rule (rent ≥ 1% of price), the offer needs to be $171k (46.6% below list).
- Recommended offer: $141k (56.0% below list) — sets the bar for cash-flow.
- Cap rate 2.5% vs local median 4.4% in Elgin — below-typical yield; the buyer is paying a premium for something (appreciation thesis, condition, location) that the cap rate doesn't capture.
Location & tenants
- Location reads 74/100 on livability (#167 in TX, #4,404 nationally) — a middle-class / working-renter tenant base. Strengths: cost of living A+, housing A+, health & safety A+; Watch: schools F, amenities F, commute F.
- Elgin ISD (rural): math 17% / reading 26% proficiency, ranked #741 of 826 in TX (top 90%) — low school quality limits family demand, transient renter base, plan for 1-2y turnover; 67% free/reduced lunch — lower-income household profile, screen leases tightly.
- Market conditions: Rents rising (+3.1%/yr); 807 active listings in the ZIP; solid renter incomes; 1,841 units permitted in Bastrop County in 2024 (150 in 5+ unit buildings).
Forward outlook
- In year one you build about $34k of equity ($2k loan paydown + $32k appreciation (10.0% local appreciation)).
- Bastrop County population projected at +37% by 2050 — long-run rental-demand tailwind backs the buy-and-hold thesis.
- By year 2, paydown + projected appreciation supports a ~$55k cash-out refi (75% LTV) — recoverable capital for the next deal without selling this one.
Negotiation context
- It's been on market 85 days — a 6% lower offer ($301k) is reasonable based on typical stale-listing flexibility.
- 7 sale attempts since 4y ago; this cycle's ask has dropped $25k (7%) from the opening price — seller is motivated, your offer sets the floor, not the list.
Questions for the listing agent
- What do current leases actually rent for vs. the listed asking? Can we see a recent rent roll and the last 12 months of T-12 income?
- It's been on market 85 days. Have you received any prior offers? Is the seller open to a 56% concession, seller financing, or rate buy-down credit?
- Why hasn't it sold? Are there any deal-killer items the seller is aware of (foundation, flood, title, zoning, code violations)?
- Is there a deadline driving the sale (1031 exchange, divorce, estate, relocation)? That informs how much negotiation room exists.
- Schools are F-rated, which usually means shorter tenancies and higher turnover. Who's the typical renter profile here, and what's been the actual vacancy rate?
- The area grade is low — what's the realistic commute time and amenity access for the typical tenant pool here? Any planned neighborhood developments (good or bad) we should know about?
- What's the average days-on-market for RENTAL listings here right now (not sales)? A rising rental-DOM trend means longer vacancies and softer asking-rent achievability than the comps imply.
- What's the recent tenant-quality profile in this submarket — average credit score on applications, eviction rate, late-payment / NSF rate, and stable-employment percentage? A property-management company in the area should have these aggregated.
- How much new for-sale + rental construction is in the pipeline within 1–3 miles? Heavy new supply typically softens prices + rents 12–24 months out; constrained supply supports both.
Investment metrics
- 1% rule
- 0.53% ✗
- Cap rate
- 2.49%
- Cash-on-cash
- -13.60%
- DSCR
- 0.40
- GRM
- 15.6
CMA / ARV
- ARV (median comp)
- $527,666
- List price
- $320,000
- Delta
- -39.36%
- Verdict
- UNDERPRICED
- Comps
- 6 within 1.0 mi
Projected returns pro-forma
10.0% appreciation · 3.12% rent growth · sell at horizon
- IRR
- 14.9%
- Equity multiple
- 2.23×
- Total profit
- $109,954
- Equity at exit
- $288,281
- IRR
- 14.6%
- Equity multiple
- 5.19×
- Total profit
- $375,300
- Equity at exit
- $621,690
Cash invested: $89,600 (down + closing). Projections, not guarantees.
Landlord ↔ Tenant lean methodology
- Overall (STATE)
- 87 Strongly Landlord-Friendly
- State Texas
- 87 Strongly Landlord-Friendly · R+5
- County
- — inherits STATE
- City
- — inherits STATE
ZIP-level market 78621
- Home prices YoY
- 7.6%
- Rents YoY
- 3.1%
- Active inventory
- 807
- Price-to-rent
- 15.6×
Monthly cashflow live
- Estimated rent
- $1,709 medium interval (Pro) →
- Mortgage (P&I)
- −$1,678
- Tax from tax record
- −$554 /mo · $6,647/yr
- Insurance
- −$133
- HOA
- −$0
- Vacancy / Maint / Mgmt
- −$359
- Net cashflow
- $-1,015
Break-even live
UW: 25.0% down · 7.5% · 30yr · 1.5% tax · 5.0% vac · 8.0% maint · 8.0% mgmt
Financing live
Cash to close
- Down payment
- $80,000
- Closing costs
- $9,600
- Reserves months
- —
- Total cash needed
- —
Loan-product check · same deal, 3 products live
Conventional
25% down · 7.5% · 30yr
- Down + closing
- —
- Monthly P&I
- —
- Monthly cashflow
- —
- DSCR
- —
- Eligible?
- —
Personal DTI + credit; lowest rate.
DSCR
20% down · 8.5% · 30yr
- Down + closing
- —
- Monthly P&I
- —
- Monthly cashflow
- —
- DSCR
- —
- Eligible?
- —
No personal income docs; deal must DSCR.
Hard money
10% down · 12.0% · 12mo
- Down + closing
- —
- Monthly P&I
- —
- Monthly cashflow
- —
- DSCR
- —
- Eligible?
- —
Short-term bridge; refi at stabilization.
Listing history 37 events
-
2026-06-18days on market $320,000 Active 85 DOM
-
2026-06-17days on market $320,000 Active 84 DOM
-
2026-06-16days on market $320,000 Active 83 DOM
-
2026-06-15days on market $320,000 Active 82 DOM
-
2026-06-13days on market $320,000 Active 80 DOM
-
2026-06-09days on market $320,000 Active 76 DOM
-
2026-06-08days on market $320,000 Active 75 DOM
-
2026-06-07days on market $320,000 Active 74 DOM
-
2026-06-04days on market $320,000 Active 71 DOM
-
2026-06-03days on market $320,000 Active 70 DOM
-
2026-06-02days on market $320,000 Active 69 DOM
-
2026-06-02price $320,000 Active 68 DOM
-
2026-06-01days on market $335,000 Active 68 DOM
-
2026-05-31days on market $335,000 Active 67 DOM
-
2026-04-18price $335,000 435-char remark
Show marketing remark (435 chars)
Beautiful country living property 5 minutes from downtown Elgin, Main house has two bedrooms, one full bath and one 1/2 bath, Guest house has one bedroom, full bath, kitchen dining and living area, presently is leased for 1K month to month, Fully fenced with mature trees, oversize metal carport for 4 cars, come and see it, wont last under 350K 24 hours notice, showings from 10 am to 8 pm seller works from home and has three babies.
-
2026-03-24$345,000 Active 435-char remark
Show marketing remark (435 chars)
Beautiful country living property 5 minutes from downtown Elgin, Main house has two bedrooms, one full bath and one 1/2 bath, Guest house has one bedroom, full bath, kitchen dining and living area, presently is leased for 1K month to month, Fully fenced with mature trees, oversize metal carport for 4 cars, come and see it, wont last under 350K 24 hours notice, showings from 10 am to 8 pm seller works from home and has three babies.
-
2025-06-26price
-
2025-05-09Active
-
2023-08-14soldstatus
-
2023-08-11soldstatus Closed
-
2023-08-11soldstatus Closed
-
2023-07-10status Pending
-
2023-06-28historical Active Under Contract
-
2023-06-27historical Active Option Contract
-
2023-06-05$300,000 Active
-
2023-06-01status Active
-
2023-04-25price $327,489
-
2023-04-01status Active
-
2023-03-26price $340,755
-
2022-12-20$350,000 Active
-
2022-11-11price
-
2022-09-30price
-
2022-09-17price
-
2022-08-22price
-
2022-06-27Active
-
2012-06-26soldstatus
-
2007-01-26soldstatus
ⓘ Source: listings_history table (triggers on properties + properties_extension) + one-shot
backfill from property_details.listing_events for pre-trigger history.
Tax reassessment forecast TX · Resets to sale price
- Current annual tax
- $6,647 · $554/mo
- Projected year-2 tax
- $6,647 · $554/mo
- Expected delta
- $0/yr ($0/mo · 0.0%)
ⓘ Screening estimate from a state-policy table — verify with the county assessor before closing.
Nearby sold comps map
Loading sold comps map…
Walkable amenities ~0.75 mi
Loading nearby amenities…
Taxation est. · year 1
- Rental income
- $20,510
- − Mortgage interest
- −$17,925
- − Property taxes
- −$6,647
- − Insurance
- −$1,600
- − Repairs & maintenance
- −$1,641
- − Management
- −$1,641
- − Depreciation
- −$9,309
- Taxable loss
- −$18,253
- Est. tax savings @ 24.0%
- +$4,381
- After-tax cash flow
- $-7,801/yr
For passive investors: Depreciation is non-cash, so a rental often shows a tax loss while cash-flowing — sheltering income. Rental losses are passive: they offset passive income freely, and up to $25,000/yr can offset ordinary (W-2) income if you actively participate and your MAGI is under $100k (phasing out to $0 by $150k); unused losses carry forward. On sale, claimed depreciation is recaptured at up to 25%, and gains may owe capital-gains tax (a 1031 exchange can defer both). Figures are a year-1 estimate at your 24.0% rate — not tax advice; consult a CPA.
Schools (NCES district)
- District
- Elgin ISD
- NCES district ID
- 4818360
- Math proficiency
- 17% ▼ -9.00%
- Reading proficiency
- 26% ▼ -5.00%
- Median HH income
- $55,176
- Composite
- 19.62/100
- National rank
- #8749
- State rank
- #741 of 826 in TX
Livability — Elgin
- Score
- 74/100
- State rank
- #167
- US rank
- #4404
Category grades
Schools grade is shown separately in the Schools card above.
Census & demographics
- County
- Bastrop County · 68,601 people
- City population
- 27,860
- Metro
- Austin-Round Rock-Georgetown, TX
- Population (ZIP)
- 30,411
- Household income
- $98,534
- Rent vs Own
- Severe rent burden
- 235.0
Population outlook (Bastrop County) Hauer SSP2
- Today (2025)
- 94,260 people
- By 2030
- 101,355 · +7.5%
- By 2040
- 115,578 · +22.6%
- By 2050
- 129,464 · +37.3%
- By 2075
- 168,068 · +78.3%
- By 2100
- 194,857 · +106.7%
Race, ethnicity, and origin ACS 2023
- Neighborhood character
- Diverse neighborhood (Simpson 0.64)
- Race & ethnicity
- Hispanic / Latino 46% White 38% Two or more races 19% Black 11% Native American 1%
- Hispanic origin (detail)
- Mexican 38%
- Common ancestry
- Slovak 2% Italian 2% Romanian 1%
- Foreign-born
- 17% · Canada, Vietnam
- Languages at home
- 63% English-only · Spanish 36%
Political lean MEDSL · Bastrop
- 2024 margin
- R (+18.4) · D 40.2% · R 58.6% · Other 1.2%
- 2008→2024 swing
- -10.2pp toward R · 2008: -8.2pp · 2024: -18.4pp
- All cycles
- 2024: R+18.4 2020: R+13.8 2016: R+20.4 2012: R+17.0 2008: R+8.2
Not yet ingested
- Civics
- —
Market trends
- HPI YoY
- ▲ 29.47%
- Current HPI
- 416.87
- Rent YoY
- ▲ 3.12%
- Metro
- Austin-Round Rock-Georgetown, TX
- State GDP YoY
- ▲ 3.95%
- F500 in state
- 110
Industry mix (Fortune 500 HQ in TX)
| Industry | F500 HQs | Revenue |
|---|---|---|
| Energy | 16 | $1,198B |
|
||
| Technology | 5 | $198B |
|
||
| Engineering / Construction | 4 | $72B |
|
||
| Energy Services | 3 | $60B |
|
||
| Utilities | 3 | $41B |
|
||
| Healthcare | 2 | $330B |
|
||
Price history
-4.3% since first listed23 events — show timeline
- 2026-04-18 Price Changed $335,000 Unlock MLS
- 2026-03-24 Listed $345,000 Unlock MLS
- 2025-06-26 Price Changed — Unlock MLS
- 2025-05-09 Listed — Unlock MLS
- 2023-08-14 Sold (Public Records) — Public Records
- 2023-08-11 Sold (MLS) — NTREIS
- 2023-08-11 Sold (MLS) — Unlock MLS
- 2023-07-10 Pending — NTREIS
- 2023-06-28 Contingent — Unlock MLS
- 2023-06-27 Contingent — NTREIS
- 2023-06-05 Listed $300,000 NTREIS
- 2023-06-01 Relisted — Unlock MLS
- 2023-04-25 Price Changed $327,489 Unlock MLS
- 2023-04-01 Relisted — Unlock MLS
- 2023-03-26 Price Changed $340,755 Unlock MLS
- 2022-12-20 Listed $350,000 Unlock MLS
- 2022-11-11 Price Changed — Unlock MLS
- 2022-09-30 Price Changed — Unlock MLS
- 2022-09-17 Price Changed — Unlock MLS
- 2022-08-22 Price Changed — Unlock MLS
- 2022-06-27 Listed — Unlock MLS
- 2012-06-26 Sold (Public Records) — Public Records
- 2007-01-26 Sold (Public Records) — Public Records
Property tax history
+2.9%/yrLatest (2025): $6,647 · -10.7% YoY. Source: county tax records.
Cash-flow waterfall
monthlySold comps — $/sqft
last 12 mo · ≤1 miLoading sold comps…