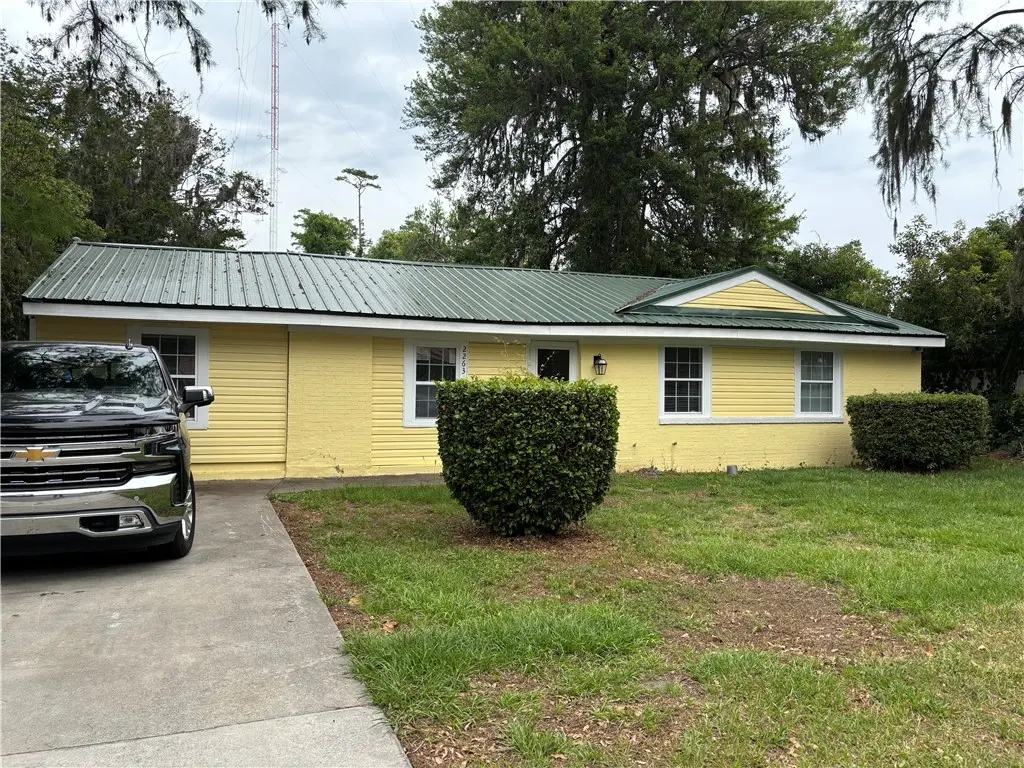
2263 Pinewood Dr · Brunswick, GA
Flood risk 6/10 · Moderate
- FEMA flood zone
- X (shaded)
- Chance of flooding over 30 yrs
- 0.55%
- Est. flood insurance / yr
- $507 – $1,088
Fire risk 4/10 · Minor
- Est. fire insurance / yr
- $963 – $1,789
Heat risk 10/10 · Severe
- Hot days now (above 108°F)
- 7 days/yr
- Hot days in 30 yrs
- 20 days/yr
Wind risk 9/10 · Severe
- Chance of severe wind over 30 yrs
- 99.0%
Air-quality risk 4/10 · Minor
- Unhealthy air days now
- 5 days/yr
- Unhealthy air days in 30 yrs
- 5 days/yr
Risk factors via First Street. Map © Google.
Why this score? — see what drove the C+ grade
The composite is a weighted blend of 9 inputs, each scored 0–100. Each bar is that input's sub-score; the figure is the points it added to the 100-point composite (weight × sub-score).
- Cash flow +25.1/30.0
- ARV discount +10.8/15.0
- DSCR +8.2/10.0
- 1% rule +5.6/10.0
- Rent growth +3.8/5.0
- Schools +3.4/10.0
- Livability +3.0/5.0
- Condition / age +2.5/5.0
- Appreciation +0.0/10.0
$165,000
🖨 Deal sheet 📄 Offer letter ✓ Due diligence
Listing remarks MLS
This classic ranch home is centrally located, close to Brunswick High school, College of Coastal Georgia, local restaurants, shopping, & Fletc. Only a 15 minute drive to our beautiful local islands. This is a wonderful starter or investment home. Currently, this home rents for $725/month. No HOA and no flood zone is a major plus!
Key facts
- New metal roof
- 8,712 sq ft lot
- Built 1970
Tags
Property features AI
Exterior
- Parking: Paved driveway
- Construction: Lot approximately 0.2 acres
- Exterior features: Paved driveway
Interior
- Bathrooms: Two full bathrooms
- Heating & cooling: Central heating (electric); Central air conditioning (electric)
- Interior features: Five total rooms
Neighborhood map
What this means for you Summary
Snapshot
- This is a 3-bed/1.5-bath single-family listed at $165k.
Deal economics
- At list price, monthly cash flow is $365 ($4k/yr) — positive.
- The deal already cash-flows at list — no discount required.
- Meets the 1% rule at list price ($2k rent vs $165k).
- Cap rate 8.9% vs local median 4.1% in Brunswick — top-decile yield for the area; either an underpriced asset or a hidden risk that comps aren't pricing in. Stress-test before assuming the spread holds.
Location & tenants
- Location reads 59/100 on livability (#401 in GA) — a working-class tenant base; expect higher turnover. Strengths: cost of living A+, housing B+; Watch: crime D, schools D-, amenities F.
- Glynn County (other): math 37% / reading 42% proficiency, ranked #47 of 174 in GA (top 27%) — families likely to look elsewhere, expect single-tenant / working-renter base with shorter leases.
- Market conditions: Rents rising fast (+5.1%/yr); 183 active listings in the ZIP; 10 comparable units currently listed for rent nearby; rentals lingering (median 44d on market — plan ~5-8 weeks vacancy on turnover, expect pricing pressure); 80% of comp listings sitting > 30 days — soft ceiling on asking rent; lower-income renter base — watch delinquency; 734 units permitted in Glynn County in 2024 (136 in 5+ unit buildings).
- At $1,753/mo this rent would consume 52% of the median local household income ($40k/yr) (locally 1406% of renters already pay >50% of income on rent) — very limited rent-growth headroom before tenants either downsize or default.
Forward outlook
- Local home prices are declining (-3.0%/yr); year-one equity from $1k of loan paydown is wiped out by about $5k of value loss. Plan a longer hold.
- Glynn County population projected at +13% by 2050 — modest demand growth; plan on rents tracking national, not racing it.
- At projected returns (-3.0% appreciation + 5.1% rent growth), your $46k cash investment doubles in ~9 years — after that, you're playing with house money.
Negotiation context
- Only 2 days on market — expect competitive offers; lowballing is unlikely to land.
- 3 sale attempts since 17y ago with the ask held roughly flat each time — persistent listings suggest the price (not the market) is what's stuck; bring a comps-based counter.
Risks & watch-outs
- Climate carrying-cost: major flood risk; severe wind risk, 99% chance of damaging wind over 30y; extreme-heat days projected 7→20/yr by 2055 (HVAC capex compounding) — expect insurance premiums to compound above CPI over the hold.
Questions for the listing agent
- Built in 1970 — when were the roof, HVAC, electrical panel, plumbing, and water heater last replaced?
- Is there a deadline driving the sale (1031 exchange, divorce, estate, relocation)? That informs how much negotiation room exists.
- Schools are D-rated, which usually means shorter tenancies and higher turnover. Who's the typical renter profile here, and what's been the actual vacancy rate?
- Crime grade is D in this area — have there been break-ins, vandalism, or insurance claims at this property in the last 3 years? What carrier currently insures it and at what premium?
- What's the average days-on-market for RENTAL listings here right now (not sales)? A rising rental-DOM trend means longer vacancies and softer asking-rent achievability than the comps imply.
- What's the recent tenant-quality profile in this submarket — average credit score on applications, eviction rate, late-payment / NSF rate, and stable-employment percentage? A property-management company in the area should have these aggregated.
- How much new for-sale + rental construction is in the pipeline within 1–3 miles? Heavy new supply typically softens prices + rents 12–24 months out; constrained supply supports both.
Investment metrics
- 1% rule
- 1.06% ✓
- Cap rate
- 8.95%
- Cash-on-cash
- 9.48%
- DSCR
- 1.42
- GRM
- 7.8
CMA / ARV
- ARV (median comp)
- $178,226
- List price
- $165,000
- Delta
- -7.42%
- Verdict
- FAIR
- Comps
- 20 within 1.0 mi
Show comp detail 12 sales within ~0.75 mi
| Address | Dist | Beds/Ba | Sqft | Sold | Price | $/sf | Match |
|---|---|---|---|---|---|---|---|
| 2263 Pinewood Dr | 0.00mi | 3/2.0 | 1,302 (0%) | 0mo | $168,000 | $129 | 98 |
| 2268 Poinsettia Cir | 0.15mi | 3/2.0 | 1,326 (+2%) | 9mo | $128,750 | $97 | 81 |
| 2111 Clairmont Ln | 0.43mi | 3/2.0 | 1,274 (-2%) | 5mo | $209,000 | $164 | 70 |
| 2248 Peachtree St | 0.32mi | 3/1.0 | 1,245 (-4%) | 14mo | $139,400 | $112 | 64 |
| 4166 Southern Rd | 0.65mi | 3/1.5 | 1,376 (+6%) | 6mo | $199,900 | $145 | 55 |
| 2235 Poinsettia Cir | 0.19mi | 4/1.5 (+1) | 1,167 (-10%) | 21mo | $143,820 | $123 | 52 |
| 333 Stone Mill Dr | 0.55mi | 2/2.0 (-1) | 1,353 (+4%) | 15mo | $240,000 | $177 | 48 |
| 4166 Southern Rd | 0.65mi | 3/1.5 | 1,376 (+6%) | 18mo | $55,000 | $40 | 45 |
| 204 Suburban Dr | 0.54mi | 2/2.0 (-1) | 1,456 (+12%) | 4mo | $225,000 | $155 | 44 |
| 325 Stone Mill Dr #325 | 0.54mi | 2/2.0 (-1) | 1,469 (+13%) | 11mo | $262,000 | $178 | 38 |
| 2441 Blain St | 0.65mi | 3/1.0 | 1,136 (-13%) | 18mo | $110,000 | $97 | 31 |
| 2590 Townsend St | 0.71mi | 3/2.0 | 1,496 (+15%) | 21mo | $176,500 | $118 | 23 |
Match score weights: distance 35% · size 25% · config 20% · recency 20%. Top-matched comps best support the ARV.
Projected returns pro-forma
-3.0% appreciation · 5.08% rent growth · sell at horizon
- IRR
- 0.1%
- Equity multiple
- 1.00×
- Total profit
- $205
- Equity at exit
- $24,602
- IRR
- 11.6%
- Equity multiple
- 1.99×
- Total profit
- $45,948
- Equity at exit
- $14,266
Cash invested: $46,200 (down + closing). Projections, not guarantees.
Landlord ↔ Tenant lean methodology
- Overall (STATE)
- 90 Strongly Landlord-Friendly
- State Georgia
- 90 Strongly Landlord-Friendly · R+3
- County
- — inherits STATE
- City
- — inherits STATE
ZIP-level market 31520
- Rents YoY
- 5.1%
- Active inventory
- 183
- Price-to-rent
- 7.8×
Monthly cashflow live
- Estimated rent
- $1,753 high interval (Pro) →
- Mortgage (P&I)
- −$865
- Tax from tax record
- −$86 /mo · $1,027/yr
- Insurance
- −$69
- HOA
- −$0
- Vacancy / Maint / Mgmt
- −$368
- Net cashflow
- $365
Break-even live
UW: 25.0% down · 7.5% · 30yr · 1.5% tax · 5.0% vac · 8.0% maint · 8.0% mgmt
Financing live
Cash to close
- Down payment
- $41,250
- Closing costs
- $4,950
- Reserves months
- —
- Total cash needed
- —
Loan-product check · same deal, 3 products live
Conventional
25% down · 7.5% · 30yr
- Down + closing
- —
- Monthly P&I
- —
- Monthly cashflow
- —
- DSCR
- —
- Eligible?
- —
Personal DTI + credit; lowest rate.
DSCR
20% down · 8.5% · 30yr
- Down + closing
- —
- Monthly P&I
- —
- Monthly cashflow
- —
- DSCR
- —
- Eligible?
- —
No personal income docs; deal must DSCR.
Hard money
10% down · 12.0% · 12mo
- Down + closing
- —
- Monthly P&I
- —
- Monthly cashflow
- —
- DSCR
- —
- Eligible?
- —
Short-term bridge; refi at stabilization.
Rent comps 10 comps
| Address | Beds | Baths | Sqft | Rent | $/sqft | DOM | Units | Dist |
|---|---|---|---|---|---|---|---|---|
| 2226 Formosa Cir Brunswick, GA | 4.0 | 2.0 | 1600 | $1,750 | $1.09 | 43d | 1 | 0.16mi |
| 500 Coastal Club Cir Brunswick, GA | 2.0 | 2.0 | 1153 | $1,314 | $1.14 | 43d | 5 | 0.78mi |
| 294 Windridge Dr Brunswick, GA | 3.0 | 2.0 | 1430 | $1,600 | $1.12 | 43d | 1 | 0.83mi |
| 500 Beverly Villas Dr Brunswick, GA | 2.0 | 2.0 | 1336 | $1,712 | $1.28 | 43d | 4 | 1.00mi |
| 3200 Cypress Mill Rd Brunswick, GA | 2.0–3.0 | 2.0 | 1168 | $1,485 | $1.27 | 7d | 13 | 1.08mi |
| 2640 Canary Dr Brunswick, GA | 4.0 | 2.0 | 1450 | $2,200 | $1.52 | 43d | 1 | 1.14mi |
| 3220 Altama Ave Brunswick, GA | 3.0 | 2.0 | 1300 | $1,650 | $1.27 | 43d | 1 | 1.17mi |
| 1105 Fountain Lake Dr Brunswick, GA | 2.0–3.0 | 2.0–2.5 | 1157 | $1,575 | $1.36 | 2d | 6 | 1.23mi |
| 3602 Norwich St Brunswick, GA | 3.0 | 1.0 | 1012 | $1,550 | $1.53 | 43d | 1 | 1.25mi |
| 3518 Hardee Ave Brunswick, GA | 3.0 | 1.0 | 948 | $1,550 | $1.64 | 43d | 1 | 1.32mi |
Listing history 8 events
-
2026-05-09status Pending 314-char remark
-
2026-05-07$165,000 Active 314-char remark
-
2020-07-17soldstatus $45,000
-
2020-07-16soldstatus $45,000 336-char remark
Show marketing remark (336 chars)
This classic ranch home is centrally located, close to Brunswick High school, College of Coastal Georgia, local restaurants, shopping, & Fletc. Only a 15 minute drive to our beautiful local islands. This is a wonderful starter or investment home. Currently, this home rents for $725/month. No HOA and no flood zone is a major plus!
-
2019-12-20$50,000 336-char remark
Show marketing remark (336 chars)
This classic ranch home is centrally located, close to Brunswick High school, College of Coastal Georgia, local restaurants, shopping, & Fletc. Only a 15 minute drive to our beautiful local islands. This is a wonderful starter or investment home. Currently, this home rents for $725/month. No HOA and no flood zone is a major plus!
-
2010-09-12historical
-
2009-10-11$111,000
-
2006-06-15soldstatus $62,000
ⓘ Source: listings_history table (triggers on properties + properties_extension) + one-shot
backfill from property_details.listing_events for pre-trigger history.
Tax reassessment forecast GA · Resets to sale price
- Current annual tax
- $1,027 · $86/mo
- Projected year-2 tax
- $1,518 · $126/mo
- Expected delta
- +$491/yr (+$41/mo · 47.8%)
ⓘ Screening estimate from a state-policy table — verify with the county assessor before closing.
Climate risk First Street
- Flood 6/10 Major FEMA zone X (shaded) · 55% chance over 30 yrs
- Wildfire 4/10 Moderate
- Heat 10/10 Extreme 7 d/yr ≥108°F today · 20 d/yr by 30 yrs out
- Wind 9/10 Extreme 99% chance of damaging wind over 30 yrs
- Air quality 4/10 Moderate 5 unhealthy d/yr today · 5 by 30 yrs out
Nearby sold comps map
Loading sold comps map…
Walkable amenities ~0.75 mi
Loading nearby amenities…
Taxation est. · year 1
- Rental income
- $21,032
- − Mortgage interest
- −$9,243
- − Property taxes
- −$1,027
- − Insurance
- −$825
- − Repairs & maintenance
- −$1,683
- − Management
- −$1,683
- − Depreciation
- −$4,800
- Taxable income
- $1,772
- Est. tax owed @ 24.0%
- −$425
- After-tax cash flow
- $3,954/yr
For passive investors: Depreciation is non-cash, so a rental often shows a tax loss while cash-flowing — sheltering income. Rental losses are passive: they offset passive income freely, and up to $25,000/yr can offset ordinary (W-2) income if you actively participate and your MAGI is under $100k (phasing out to $0 by $150k); unused losses carry forward. On sale, claimed depreciation is recaptured at up to 25%, and gains may owe capital-gains tax (a 1031 exchange can defer both). Figures are a year-1 estimate at your 24.0% rate — not tax advice; consult a CPA.
Schools (NCES district)
- District
- Glynn County
- NCES district ID
- 1302400
- Math proficiency
- 37% ▼ -9.00%
- Reading proficiency
- 42% ▼ -7.00%
- Median HH income
- $47,554
- Composite
- 33.83/100
- National rank
- #5359
- State rank
- #47 of 174 in GA
Livability — Brunswick
- Score
- 59/100
- State rank
- #401
- US rank
- #19832
Category grades
Schools grade is shown separately in the Schools card above.
Census & demographics
- Census place
- Brunswick, GA
- County
- Glynn County · 69,019 people
- City population
- 51,239
- Metro
- Brunswick, GA
- Population (ZIP)
- 22,313
- Household income
- $40,071
- Rent vs Own
- Severe rent burden
- 1406.0
Population outlook (Glynn County) Hauer SSP2
- Today (2025)
- 91,404 people
- By 2030
- 94,806 · +3.7%
- By 2040
- 100,060 · +9.5%
- By 2050
- 103,258 · +13.0%
- By 2075
- 107,970 · +18.1%
- By 2100
- 103,363 · +13.1%
Race, ethnicity, and origin ACS 2023
- Neighborhood character
- Diverse neighborhood (Simpson 0.63)
- Race & ethnicity
- Black 50% White 33% Hispanic / Latino 11% Two or more races 9% Asian 1%
- Hispanic origin (detail)
- Mexican 7%
- Common ancestry
- Italian 2% Slovak 1% Serbian 1%
- Foreign-born
- 8% · Canada, South Korea
- Languages at home
- 87% English-only · Spanish 10% French/Haitian/Cajun 1% Korean 1%
Political lean MEDSL · Glynn
- 2024 margin
- Strong R (+26.0) · D 36.8% · R 62.8%
- 2008→2024 swing
- -2.6pp toward R · 2008: -23.4pp · 2024: -26.0pp
- All cycles
- 2024: R+26.0 2020: R+23.2 2016: R+28.6 2012: R+27.0 2008: R+23.4
Not yet ingested
- Civics
- —
Market trends
- HPI YoY
- ▼ -274.83%
- Current HPI
- 180.4581
- Rent YoY
- ▲ 5.08%
- Metro
- Brunswick, GA
- State GDP YoY
- ▲ 2.66%
- F500 in state
- 28
Industry mix (Fortune 500 HQ in GA)
| Industry | F500 HQs | Revenue |
|---|---|---|
| Paper / Packaging | 2 | $29B |
|
||
| Retail | 1 | $160B |
|
||
| Transportation / Logistics | 1 | $91B |
|
||
| Airlines | 1 | $62B |
|
||
| Consumer Goods | 1 | $47B |
|
||
| Utilities | 1 | $25B |
|
||
Price history
+171.0% since first listed9 events — show timeline
- 2026-06-05 Sold (MLS) $168,000 GIAR
- 2026-05-09 Pending — GIAR
- 2026-05-07 Listed $165,000 GIAR
- 2020-07-17 Sold (Public Records) $45,000 Public Records
- 2020-07-16 Sold (MLS) $45,000 GIAR
- 2019-12-20 Listed $50,000 GIAR
- 2010-09-12 Listing Removed — GIAR
- 2009-10-11 Listed $111,000 GIAR
- 2006-06-15 Sold (Public Records) $62,000 Public Records
Property tax history
-1.0%/yrLatest (2025): $1,027 · +12.5% YoY. Source: county tax records.
Cash-flow waterfall
monthlySold comps — $/sqft
last 12 mo · ≤1 miLoading sold comps…