868 Parkside Ave · Trenton, NJ
Flood risk 1/10 · Minimal
- FEMA flood zone
- X (unshaded)
- Chance of flooding over 30 yrs
- 0.0%
- Est. flood insurance / yr
- $507 – $1,088
Fire risk 1/10 · Minimal
- Est. fire insurance / yr
- $526 – $976
Heat risk 6/10 · Moderate
- Hot days now (above 102°F)
- 7 days/yr
- Hot days in 30 yrs
- 15 days/yr
Wind risk 6/10 · Moderate
- Chance of severe wind over 30 yrs
- 27.0%
Air-quality risk 5/10 · Moderate
- Unhealthy air days now
- 6 days/yr
- Unhealthy air days in 30 yrs
- 8 days/yr
Risk factors via First Street. Map © Google.
Why this score? — see what drove the F grade
The composite is a weighted blend of 9 inputs, each scored 0–100. Each bar is that input's sub-score; the figure is the points it added to the 100-point composite (weight × sub-score).
- Cash flow +15.6/30.0
- DSCR +4.8/10.0
- 1% rule +4.4/10.0
- Livability +3.8/5.0
- Rent growth +3.2/5.0
- Condition / age +2.5/5.0
- Schools +0.7/10.0
- ARV discount +0.0/15.0
- Appreciation +0.0/10.0
$280,000
🖨 Deal sheet (PDF) 📄 Offer letter ✓ Due diligence
Listing remarks MLS
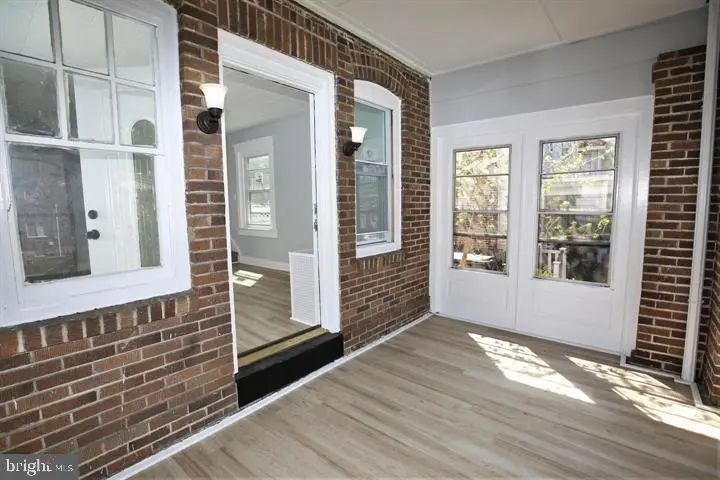
Newly renovated semi-attached 4 bedroom home. Updates include a new boiler, water heater, flooring, a fresh coat of paint, some new windows, and more. This is a great affordable move-in-ready home. The bedrooms are spacious. There is a full basement with tons of storage space. A fully fenced backyard for relaxing or entertaining. Easy access to public transport and major highways, including Rte 1, 206, 195 and 295. You don't want to miss this one, so schedule a viewing today!
Key facts
- Built 1924
- Listed 10 days
Property features AI
Finance
- Other: Owned as fee simple
Exterior
- Parking: On-street parking
- Utilities: Public water; Public sewer; Natural gas
- Home design: Semi-detached; East-facing main entrance
- Construction: Brick, frame, and vinyl siding construction; Asphalt roof; Block foundation; Originally built (year per assessor)
- Exterior features: Not in a federal flood zone; Lot dimensions approximately 18.75 x 114.00
Interior
- Kitchen: Gas range; Refrigerator
- Bedrooms: Three bedrooms on the upper level
- Bathrooms: One full bathroom
- Heating & cooling: Radiator heating; Natural gas hot water
- Interior features: Full basement
Neighborhood map
What this means for you Summary
Snapshot
- This is a 4-bed/1.0-bath townhouse listed at $280k.
Deal economics
- At list price, monthly cash flow is $116 ($1k/yr) — positive.
- The deal already cash-flows at list — no discount required.
- To meet the 1% rule (rent ≥ 1% of price), the offer needs to be $262k (6.3% below list).
- Recommended offer: $262k (6.3% below list) — sets the bar for 1% rule.
Location & tenants
- Location reads 76/100 on livability (#133 in NJ, #3,533 nationally) — a middle-class / working-renter tenant base. Strengths: amenities A+, commute A+, health & safety A+; Watch: crime F, employment F.
- Trenton Public School District (urban): math 2% / reading 16% proficiency, ranked #471 of 472 in NJ (top 100%) — low school quality limits family demand, transient renter base, plan for 1-2y turnover; 80% free/reduced lunch — lower-income household profile, screen leases tightly.
- Zoned schools: Joyce Kilmer School (math 0% / reading 14%); Trenton Central High School - Main Campus (math 2% / reading 10%, grade F, #396 of 399 statewide, top 99%, 2,255 students, 56% FRL) — zoned schools average 56% FRL vs 80% district-wide (25 pts lower); this property's tenant base skews higher-income than the district average.
- Market conditions: Rents rising (+2.6%/yr); 148 active listings in the ZIP; 20 comparable units currently listed for rent nearby; rentals at typical pace (median 15d on market — plan ~3-4 weeks tenant-placement turnaround); 2,256 units permitted in Mercer County in 2024 (1,303 in 5+ unit buildings).
- At $2,624/mo this rent would consume 62% of the median local household income ($50k/yr) (locally 2116% of renters already pay >50% of income on rent) — very limited rent-growth headroom before tenants either downsize or default.
Forward outlook
- Local home prices are declining (-3.0%/yr); year-one equity from $2k of loan paydown is wiped out by about $8k of value loss. Plan a longer hold.
- Mercer County population projected at +4% by 2050 — modest demand growth; plan on rents tracking national, not racing it.
Negotiation context
- Only 10 days on market — expect competitive offers; lowballing is unlikely to land.
- 8 sale attempts since 21y ago; this cycle's ask is 40% above the opening price — seller raised mid-cycle; expect resistance to lowballs.
- Current owner paid $203k; 38% above their basis — modest negotiation headroom, anchor on the comps not their cost.
Risks & watch-outs
- Watch-outs: built in 1924 — expect roof / HVAC / electrical / plumbing capex.
- Climate carrying-cost: major wind risk, 27% chance of damaging wind over 30y; extreme-heat days projected 7→15/yr by 2055 (HVAC capex compounding) — expect insurance premiums to compound above CPI over the hold.
Questions for the listing agent
- Built in 1924 — when were the roof, HVAC, electrical panel, plumbing, and water heater last replaced?
- Is there a deadline driving the sale (1031 exchange, divorce, estate, relocation)? That informs how much negotiation room exists.
- Schools are F-rated, which usually means shorter tenancies and higher turnover. Who's the typical renter profile here, and what's been the actual vacancy rate?
- Crime grade is F in this area — have there been break-ins, vandalism, or insurance claims at this property in the last 3 years? What carrier currently insures it and at what premium?
- The area grade is low — what's the realistic commute time and amenity access for the typical tenant pool here? Any planned neighborhood developments (good or bad) we should know about?
- What's the average days-on-market for RENTAL listings here right now (not sales)? A rising rental-DOM trend means longer vacancies and softer asking-rent achievability than the comps imply.
- What's the recent tenant-quality profile in this submarket — average credit score on applications, eviction rate, late-payment / NSF rate, and stable-employment percentage? A property-management company in the area should have these aggregated.
- How much new for-sale + rental construction is in the pipeline within 1–3 miles? Heavy new supply typically softens prices + rents 12–24 months out; constrained supply supports both.
Investment metrics
- 1% rule
- 0.94% ✗
- Cap rate
- 6.79%
- Cash-on-cash
- 1.77%
- DSCR
- 1.08
- GRM
- 8.9
CMA / ARV
- ARV (on-the-fly)
- $205,920
- Comps found
- 12
Show comp detail 12 sales within ~0.75 mi
| Address | Dist | Beds/Ba | Sqft | Sold | Price | $/sf | Match |
|---|---|---|---|---|---|---|---|
| 33 Oak St | 0.09mi | 3/1.0 (-1) | 1,428 (-1%) | 2mo | $150,000 | $105 | 88 |
| 28 Bryn Mawr Ave | 0.25mi | 4/1.0 | 1,428 (-1%) | 5mo | $130,000 | $91 | 83 |
| 344 Gardner Ave | 0.27mi | 4/1.5 | 1,340 (-7%) | 1mo | $299,000 | $223 | 73 |
| 27 Laurel Ave | 0.15mi | 4/1.0 | 1,258 (-13%) | 2mo | $201,000 | $160 | 70 |
| 29 Laurel Ave | 0.14mi | 4/1.0 | 1,258 (-13%) | 4mo | $180,000 | $143 | 69 |
| 1408 Stuyvesant Ave | 0.57mi | 4/1.0 | 1,404 (-2%) | 2mo | $201,000 | $143 | 68 |
| 318 Beechwood Ave | 0.36mi | 3/1.0 (-1) | 1,333 (-7%) | 2mo | $265,000 | $199 | 64 |
| 234 Hillcrest Ave | 0.19mi | 5/1.5 (+1) | 1,643 (+14%) | 5mo | $205,000 | $125 | 57 |
| 51 Boudinot St | 0.65mi | 3/1.0 (-1) | 1,382 (-4%) | 2mo | $181,000 | $131 | 56 |
| 21 N Westfield Ave | 0.68mi | 3/2.0 (-1) | 1,472 (+2%) | 1mo | $135,000 | $92 | 55 |
| 365 Parkway Ave | 0.36mi | 3/1.5 (-1) | 1,260 (-12%) | 4mo | $299,990 | $238 | 52 |
| 18 N Overbrook Ave | 0.61mi | 3/2.5 (-1) | 1,549 (+8%) | 2mo | $310,000 | $200 | 47 |
Match score weights: distance 35% · size 25% · config 20% · recency 20%. Top-matched comps best support the ARV.
Projected returns pro-forma
-3.0% appreciation · 2.6% rent growth · sell at horizon
- IRR
- -13.9%
- Equity multiple
- 0.50×
- Total profit
- $-39,003
- Equity at exit
- $41,749
- IRR
- -5.7%
- Equity multiple
- 0.64×
- Total profit
- $-28,541
- Equity at exit
- $24,209
Cash invested: $78,400 (down + closing). Projections, not guarantees.
Landlord ↔ Tenant lean methodology
- Overall (STATE)
- 21 Tenant-Leaning
- State New Jersey
- 21 Tenant-Leaning · D+6
- County
- — inherits STATE
- City
- — inherits STATE
ZIP-level market 08618
- Rents YoY
- 2.6%
- Active inventory
- 148
- Price-to-rent
- 8.9×
Monthly cashflow live
- Estimated rent
- $2,624 high interval (Pro) →
- Mortgage (P&I)
- −$1,468
- Tax from tax record
- −$372 /mo · $4,465/yr
- Insurance
- −$117
- HOA
- −$0
- Vacancy / Maint / Mgmt
- −$551
- Net cashflow
- $116
Break-even live
Sensitivity live
| Price | -10% $274 | -5% $195 | +0% $116 | +5% $36 | +10% $-43 |
|---|---|---|---|---|---|
| Rent | -10% $-92 | -5% $12 | +0% $116 | +5% $219 | +10% $323 |
| Rate | -1.0pp $257 | -0.5pp $187 | base $116 | +0.5pp $43 | +1.0pp $-31 |
UW: 25.0% down · 7.5% · 30yr · 1.5% tax · 5.0% vac · 8.0% maint · 8.0% mgmt
Financing live
Cash to close
- Down payment
- $70,000
- Closing costs
- $8,400
- Reserves months
- —
- Total cash needed
- —
Loan-product check · same deal, 3 products live
Conventional
25% down · 7.5% · 30yr
- Down + closing
- —
- Monthly P&I
- —
- Monthly cashflow
- —
- DSCR
- —
- Eligible?
- —
Personal DTI + credit; lowest rate.
DSCR
20% down · 8.5% · 30yr
- Down + closing
- —
- Monthly P&I
- —
- Monthly cashflow
- —
- DSCR
- —
- Eligible?
- —
No personal income docs; deal must DSCR.
Hard money
10% down · 12.0% · 12mo
- Down + closing
- —
- Monthly P&I
- —
- Monthly cashflow
- —
- DSCR
- —
- Eligible?
- —
Short-term bridge; refi at stabilization.
Rent comps 20 comps
| Address | Beds | Baths | Sqft | Rent | $/sqft | DOM | Units | Dist |
|---|---|---|---|---|---|---|---|---|
| 510 N Hermitage Ave Trenton, NJ | 5.0 | 1.5 | 1316 | $2,300 | $1.75 | 0d | 1 | 0.44mi |
| 20 N Overbrook Ave Unit B Trenton, NJ | 3.0 | 1.0 | 1518 | $2,300 | $1.52 | 14d | 1 | 0.61mi |
| 600 Artisan St Trenton, NJ | 3.0 | 2.0 | 1392 | $2,650 | $1.90 | 14d | 3 | 0.63mi |
| 600 Artisan St Unit 126 Trenton, NJ | 3.0 | 2.0 | 1392 | $2,650 | $1.90 | 22d | 1 | 0.63mi |
| 649 W State St Trenton, NJ | 5.0 | 2.0 | 1870 | $2,900 | $1.55 | 14d | 1 | 0.72mi |
| 1100 Prospect St Unit 1 Ewing Township, NJ | 3.0 | 1.0 | 1100 | $2,000 | $1.82 | 22d | 1 | 0.80mi |
| 319 Rutherford Ave Trenton, NJ | 4.0 | 2.0 | 1100 | $2,200 | $2.00 | 22d | 1 | 0.86mi |
| 92 Pennwood Dr Ewing, NJ | 4.0 | 3.0 | 1702 | $3,850 | $2.26 | 15d | 1 | 0.94mi |
| 129 Clearfield Ave Trenton, NJ | 4.0 | 1.5 | 1358 | $3,000 | $2.21 | 14d | 1 | 0.96mi |
| 311 Spring St Trenton, NJ | 3.0 | 1.0 | 1200 | $2,200 | $1.83 | 15d | 1 | 0.99mi |
| 186 Passaic St Trenton, NJ | 3.0 | 2.0 | 1064 | $2,400 | $2.26 | 6d | 1 | 1.04mi |
| 510 W Hanover St Trenton, NJ | 5.0 | 1.0 | 1200 | $2,200 | $1.83 | 15d | 1 | 1.04mi |
| 24 New Trent St Trenton, NJ | 3.0 | 2.0 | 1336 | $2,350 | $1.76 | 15d | 1 | 1.07mi |
| 34 Western Ave Ewing Township, NJ | 1.0–3.0 | 1.0–1.5 | 832 | $2,685 | $3.23 | 15d | 3 | 1.11mi |
| 311 Calhoun St Trenton, NJ | 4.0 | 1.0 | 1516 | $2,400 | $1.58 | 45d | 1 | 1.13mi |
| 130 W Ingham Ave Trenton, NJ | 4.0 | 1.0 | 1126 | $2,000 | $1.78 | 15d | 1 | 1.18mi |
| 21 Bellevue Ave Trenton, NJ | 3.0 | 2.0 | 1740 | $2,400 | $1.38 | 45d | 1 | 1.26mi |
| 103 Pennsylvania Ave Ewing, NJ | 3.0 | 1.0 | 1200 | $2,600 | $2.17 | 15d | 1 | 1.42mi |
| 830 Lower Ferry Rd Ewing, NJ | 3.0 | 2.0 | 1438 | $2,975 | $2.07 | 15d | 1 | 1.47mi |
| 134 Old Rose St Trenton, NJ | 4.0 | 2.0 | 1212 | $2,300 | $1.90 | 22d | 1 | 1.49mi |
Listing history 36 events
-
2026-06-22days on market $280,000 Active 10 DOM
-
2026-06-18days on market $280,000 Active 7 DOM
-
2026-06-17days on market $280,000 Active 6 DOM
-
2026-06-16days on market $280,000 Active 5 DOM
-
2026-06-15days on market $280,000 Active 4 DOM
-
2026-06-14statusdays on market $280,000 Active 2 DOM
-
2026-06-10days on market $280,000 Coming Soon 13 DOM
-
2026-06-09days on market $280,000 Coming Soon 12 DOM
-
2026-06-08days on market $280,000 Coming Soon 11 DOM
-
2026-06-07days on market $280,000 Coming Soon 10 DOM
-
2026-06-03days on market $280,000 Coming Soon 6 DOM
-
2026-06-02days on market $280,000 Coming Soon 5 DOM
-
2026-06-01days on market $280,000 Coming Soon 4 DOM
-
2026-05-31days on market $280,000 Coming Soon 3 DOM
-
2026-05-30days on market $280,000 Coming Soon 2 DOM
-
2026-05-28historical $280,000
-
2023-06-01soldstatus $203,000
-
2023-05-25soldstatus $203,000 Closed 480-char remark
Show marketing remark (480 chars)
Newly renovated semi-attached 4 bedroom home. Updates include a new boiler, water heater, flooring, a fresh coat of paint, some new windows, and more. This is a great affordable move-in-ready home. The bedrooms are spacious. There is a full basement with tons of storage space. A fully fenced backyard for relaxing or entertaining. Easy access to public transport and major highways, including Rte 1, 206, 195 and 295. You don't want to miss this one, so schedule a viewing today!
-
2023-04-18status Pending 480-char remark
Show marketing remark (480 chars)
Newly renovated semi-attached 4 bedroom home. Updates include a new boiler, water heater, flooring, a fresh coat of paint, some new windows, and more. This is a great affordable move-in-ready home. The bedrooms are spacious. There is a full basement with tons of storage space. A fully fenced backyard for relaxing or entertaining. Easy access to public transport and major highways, including Rte 1, 206, 195 and 295. You don't want to miss this one, so schedule a viewing today!
-
2023-04-15historical Active Under Contract 480-char remark
Show marketing remark (480 chars)
Newly renovated semi-attached 4 bedroom home. Updates include a new boiler, water heater, flooring, a fresh coat of paint, some new windows, and more. This is a great affordable move-in-ready home. The bedrooms are spacious. There is a full basement with tons of storage space. A fully fenced backyard for relaxing or entertaining. Easy access to public transport and major highways, including Rte 1, 206, 195 and 295. You don't want to miss this one, so schedule a viewing today!
-
2023-04-05$200,000 Active 480-char remark
Show marketing remark (480 chars)
Newly renovated semi-attached 4 bedroom home. Updates include a new boiler, water heater, flooring, a fresh coat of paint, some new windows, and more. This is a great affordable move-in-ready home. The bedrooms are spacious. There is a full basement with tons of storage space. A fully fenced backyard for relaxing or entertaining. Easy access to public transport and major highways, including Rte 1, 206, 195 and 295. You don't want to miss this one, so schedule a viewing today!
-
2022-12-06historical
-
2022-04-07$140,000 Active
-
2018-10-02price $80,000
-
2018-09-13historical
-
2018-03-11$67,999 Active
-
2017-02-10$95,000 Active
-
2011-07-24historical
-
2011-02-24$140,000
-
2009-11-23historical
-
2009-06-22$139,900
-
2006-11-30historical
-
2006-04-10$147,500
-
2006-03-30historical
-
2005-01-20$154,500
-
1975-08-28soldstatus $16,500
ⓘ Source: listings_history table (triggers on properties + properties_extension) + one-shot
backfill from property_details.listing_events for pre-trigger history.
Tax reassessment forecast NJ · Partial reset (capped growth)
- Current annual tax
- $4,465 · $372/mo
- Projected year-2 tax
- $5,718 · $477/mo
- Expected delta
- +$1,254/yr (+$104/mo · 28.1%)
ⓘ Screening estimate from a state-policy table — verify with the county assessor before closing.
Climate risk First Street
- Flood 1/10 Low FEMA zone X (unshaded) · 0% chance over 30 yrs
- Wildfire 1/10 Low
- Heat 6/10 Major 7 d/yr ≥102°F today · 15 d/yr by 30 yrs out
- Wind 6/10 Major 27% chance of damaging wind over 30 yrs
- Air quality 5/10 Major 6 unhealthy d/yr today · 8 by 30 yrs out
Nearby sold comps map
Loading sold comps map…
Walkable amenities ~0.75 mi
Loading nearby amenities…
Taxation est. · year 1
- Rental income
- $31,485
- − Mortgage interest
- −$15,684
- − Property taxes
- −$4,465
- − Insurance
- −$1,400
- − Repairs & maintenance
- −$2,519
- − Management
- −$2,519
- − Depreciation
- −$8,145
- Taxable loss
- −$3,247
- Est. tax savings @ 24.0%
- +$779
- After-tax cash flow
- $2,168/yr
For passive investors: Depreciation is non-cash, so a rental often shows a tax loss while cash-flowing — sheltering income. Rental losses are passive: they offset passive income freely, and up to $25,000/yr can offset ordinary (W-2) income if you actively participate and your MAGI is under $100k (phasing out to $0 by $150k); unused losses carry forward. On sale, claimed depreciation is recaptured at up to 25%, and gains may owe capital-gains tax (a 1031 exchange can defer both). Figures are a year-1 estimate at your 24.0% rate — not tax advice; consult a CPA.
Schools (NCES district)
- District
- Trenton Public School District
- NCES district ID
- 3416290
- Math proficiency
- 2% ▼ -8.00%
- Reading proficiency
- 16% ▼ -4.00%
- Median HH income
- $35,078
- Composite
- 7.31/100
- National rank
- #9956
- State rank
- #471 of 472 in NJ
Livability — Trenton
- Score
- 76/100
- State rank
- #133
- US rank
- #3533
Category grades
Schools grade is shown separately in the Schools card above.
Census & demographics
- Census place
- Trenton, NJ
- County
- Mercer County · 327,655 people
- City population
- 177,819
- Metro
- Trenton-Princeton, NJ
- Population (ZIP)
- 35,634
- Household income
- $50,390
- Rent vs Own
- Severe rent burden
- 2116.0
Population outlook (Mercer County) Hauer SSP2
- Today (2025)
- 381,395 people
- By 2030
- 384,640 · +0.9%
- By 2040
- 391,431 · +2.6%
- By 2050
- 397,845 · +4.3%
- By 2075
- 417,281 · +9.4%
- By 2100
- 420,327 · +10.2%
Race, ethnicity, and origin ACS 2023
- Neighborhood character
- Diverse neighborhood (Simpson 0.59)
- Race & ethnicity
- Black 59% White 19% Hispanic / Latino 16% Two or more races 7% Asian 3%
- Hispanic origin (detail)
- Mexican 1% Puerto Rican 6% Dominican 3%
- Common ancestry
- Romanian 2% Hispanic 1% Scotch-Irish 1%
- Foreign-born
- 14% · Canada, China, South Korea
- Languages at home
- 80% English-only · Spanish 10% Other Indo-European 3% Arabic 1%
Political lean MEDSL · Mercer
- 2024 margin
- Solid D (+33.9) · D 65.9% · R 32.0% · Other 2.1%
- 2008→2024 swing
- -2.2pp toward R · 2008: 36.1pp · 2024: 33.9pp
- All cycles
- 2024: D+33.9 2020: D+40.0 2016: D+36.2 2012: D+36.8 2008: D+36.1
Not yet ingested
- Civics
- —
Market trends
- HPI YoY
- ▼ -309.54%
- Current HPI
- 288.6841
- Rent YoY
- ▲ 2.60%
- Metro
- Trenton-Princeton, NJ
- State GDP YoY
- ▲ 2.05%
- F500 in state
- 34
Industry mix (Fortune 500 HQ in NJ)
| Industry | F500 HQs | Revenue |
|---|---|---|
| Consumer Goods | 3 | $31B |
|
||
| Pharmaceuticals | 2 | $153B |
|
||
| Technology | 2 | $21B |
|
||
| Insurance | 2 | $20B |
|
||
| Healthcare | 2 | $19B |
|
||
| Financial Services | 1 | $70B |
|
||
Price history
+1597.0% since first listed21 events — show timeline
- 2026-05-28 Coming Soon $280,000 BRIGHT MLS
- 2023-06-01 Sold (Public Records) $203,000 Public Records
- 2023-05-25 Sold (MLS) $203,000 BRIGHT MLS
- 2023-04-18 Pending — BRIGHT MLS
- 2023-04-15 Contingent — BRIGHT MLS
- 2023-04-05 Listed $200,000 BRIGHT MLS
- 2022-12-06 Listing Removed — BRIGHT MLS
- 2022-04-07 Listed $140,000 BRIGHT MLS
- 2018-10-02 Price Changed $80,000 BRIGHT MLS
- 2018-09-13 Listing Removed — BRIGHT MLS
- 2018-03-11 Listed $67,999 BRIGHT MLS
- 2017-02-10 Listed $95,000 BRIGHT MLS
- 2011-07-24 Listing Removed — BRIGHT MLS
- 2011-02-24 Listed $140,000 BRIGHT MLS
- 2009-11-23 Listing Removed — BRIGHT MLS
- 2009-06-22 Listed $139,900 BRIGHT MLS
- 2006-11-30 Listing Removed — BRIGHT MLS
- 2006-04-10 Listed $147,500 BRIGHT MLS
- 2006-03-30 Listing Removed — BRIGHT MLS
- 2005-01-20 Listed $154,500 BRIGHT MLS
- 1975-08-28 Sold (Public Records) $16,500 Public Records
Property tax history
+2.6%/yrLatest (2025): $4,465 · +1.5% YoY. Source: county tax records.
Cash-flow waterfall
monthlySold comps — $/sqft
last 12 mo · ≤1 miLoading sold comps…