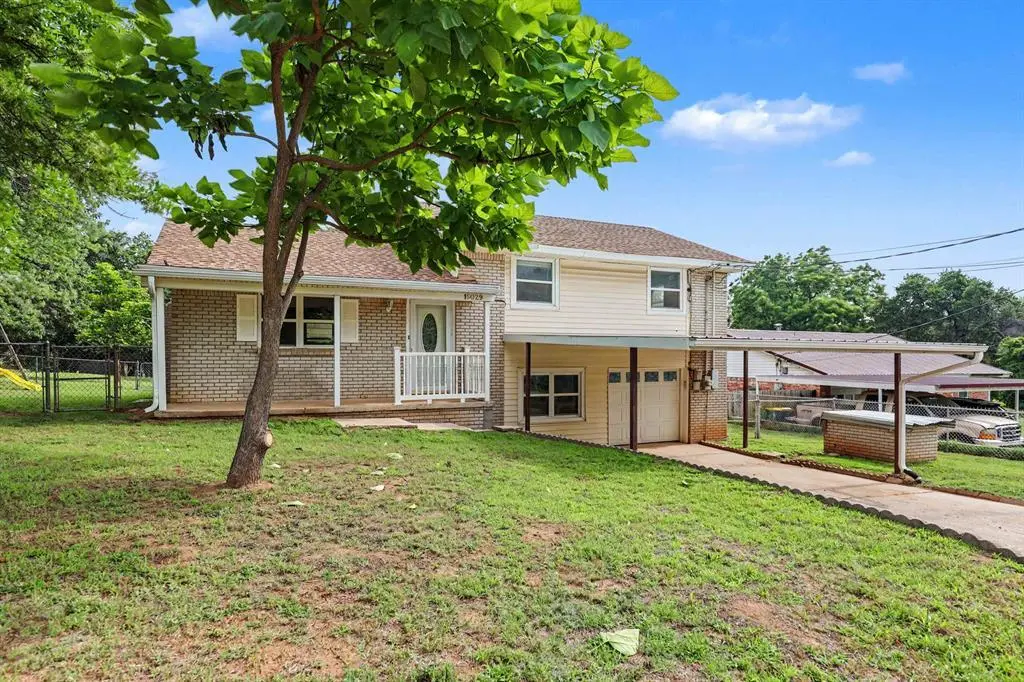
16029 SE 28th St · Choctaw, OK
Flood risk 1/10 · Minimal
- FEMA flood zone
- X (unshaded)
- Chance of flooding over 30 yrs
- 0.0%
- Est. flood insurance / yr
- $507 – $1,088
Fire risk 6/10 · Moderate
- Est. fire insurance / yr
- $2,463 – $4,575
Heat risk 5/10 · Moderate
- Hot days now (above 108°F)
- 7 days/yr
- Hot days in 30 yrs
- 18 days/yr
Wind risk 3/10 · Minor
- Chance of severe wind over 30 yrs
- 5.0%
Air-quality risk 2/10 · Minimal
- Unhealthy air days now
- 0 days/yr
- Unhealthy air days in 30 yrs
- 1 days/yr
Risk factors via First Street. Map © Google.
Why this score? — see what drove the C grade
The composite is a weighted blend of 9 inputs, each scored 0–100. Each bar is that input's sub-score; the figure is the points it added to the 100-point composite (weight × sub-score).
- Cash flow +21.0/30.0
- ARV discount +15.0/15.0
- DSCR +6.7/10.0
- 1% rule +4.7/10.0
- Livability +3.6/5.0
- Schools +2.8/10.0
- Rent growth +2.5/5.0
- Condition / age +2.5/5.0
- Appreciation +0.0/10.0
$195,000
🖨 Deal sheet 📄 Offer letter ✓ Due diligence
Listing remarks MLS
Peaceful, country, tri-level retreat on .81 acres within Choctaw School district with 3 beds, 1 bath, fireplace, office, large laundry room and screened-in back porch. Kitchen, dining and living on main level, office & laundry on ground level, all three bedrooms and bathroom on the upper level. RECENT UPGRADES INCLUDE HEAT PUMP, ROOF, HOT WATER TANK, SIDING, WELL PUMP and WINDOWS!!! There is a horse stall at the back of the property.
Key facts
- Great location
- Updated bathrooms
- Updated kitchen
Tags
Property features AI
Finance
- Other: Homestead exemption applied; Located in Sandwood Acres addition
- Financial info: Loan qualification available; Property is not assumable; Annual tax amount listed (financial details excluded per instructions)
- HOA & community: No mandatory association dues
Exterior
- Parking: One-car garage
- Security: No storm shelter
- Utilities: No special flood insurance required (not in flood); Water, sewer, and power details not specified
- Home design: Single family residence; Residential property facing south; Multi-level property; Entry level not specified
- Construction: Brick and frame construction; Shingle roof (replaced or updated in 2013); Combination foundation; Built status: existing
- Exterior features: Covered patio; Chain link fencing; Interior lot
Interior
- Kitchen: No specific appliances listed
- Bedrooms: Three bedrooms
- Flooring: No flooring information listed
- Bathrooms: One full bathroom
- Heating & cooling: Electric heating
- Interior features: Living area with one living area; Covered patio; Wood-burning fireplace
- Laundry & utility: No specific laundry or utility details listed
Neighborhood map
What this means for you Summary
Snapshot
- This is a 3-bed/1.0-bath single-family listed at $195k.
Deal economics
- At list price, monthly cash flow is $273 ($3k/yr) — positive.
- The deal already cash-flows at list — no discount required.
- To meet the 1% rule (rent ≥ 1% of price), the offer needs to be $189k (3.0% below list).
- Recommended offer: $189k (3.0% below list) — sets the bar for 1% rule.
- Cap rate 8.0% vs local median 3.1% in Choctaw — top-decile yield for the area; either an underpriced asset or a hidden risk that comps aren't pricing in. Stress-test before assuming the spread holds.
Location & tenants
- Location reads 71/100 on livability (#31 in OK) — a middle-class / working-renter tenant base. Strengths: employment A+, cost of living A+, housing A+; Watch: amenities F, commute F, health & safety F.
- Choctaw-Nicoma Park (suburban): math 28% / reading 32% proficiency, ranked #48 of 270 in OK (top 18%) — families likely to look elsewhere, expect single-tenant / working-renter base with shorter leases.
- Zoned schools: Indian Meridian Es (560 students, 0% FRL); Choctaw Hs (math 26% / reading 37%, grade F, #73 of 447 statewide, top 16%, 1,811 students, 0% FRL) — zoned schools average 0% FRL vs 34% district-wide (34 pts lower); this property's tenant base skews higher-income than the district average.
- Market conditions: 326 active listings in the ZIP; solid renter incomes; 5,365 units permitted in Oklahoma County in 2024 (569 in 5+ unit buildings).
Forward outlook
- Local home prices are declining (-3.0%/yr); year-one equity from $1k of loan paydown is wiped out by about $6k of value loss. Plan a longer hold.
- Oklahoma County population projected at +41% by 2050 — long-run rental-demand tailwind backs the buy-and-hold thesis.
Negotiation context
- Only 2 days on market — expect competitive offers; lowballing is unlikely to land.
- 2 sale attempts since 7y ago with the ask held roughly flat each time — persistent listings suggest the price (not the market) is what's stuck; bring a comps-based counter.
- Current owner paid $105k; list at $195k implies a 86% gain — meaningful room to come down on a strong offer.
Risks & watch-outs
- Climate carrying-cost: major wildfire risk; extreme-heat days projected 7→18/yr by 2055 (HVAC capex compounding) — expect insurance premiums to compound above CPI over the hold.
Questions for the listing agent
- Built in 1964 — when were the roof, HVAC, electrical panel, plumbing, and water heater last replaced?
- Is there a deadline driving the sale (1031 exchange, divorce, estate, relocation)? That informs how much negotiation room exists.
- Schools are D-rated, which usually means shorter tenancies and higher turnover. Who's the typical renter profile here, and what's been the actual vacancy rate?
- What's the average days-on-market for RENTAL listings here right now (not sales)? A rising rental-DOM trend means longer vacancies and softer asking-rent achievability than the comps imply.
- What's the recent tenant-quality profile in this submarket — average credit score on applications, eviction rate, late-payment / NSF rate, and stable-employment percentage? A property-management company in the area should have these aggregated.
- How much new for-sale + rental construction is in the pipeline within 1–3 miles? Heavy new supply typically softens prices + rents 12–24 months out; constrained supply supports both.
Investment metrics
- 1% rule
- 0.97% ✗
- Cap rate
- 7.98%
- Cash-on-cash
- 6.01%
- DSCR
- 1.27
- GRM
- 8.6
CMA / ARV
- ARV (on-the-fly)
- $267,410
- Comps found
- 6
Show comp detail 6 sales within ~0.75 mi
| Address | Dist | Beds/Ba | Sqft | Sold | Price | $/sf | Match |
|---|---|---|---|---|---|---|---|
| 2742 S Sandwood Ave | 0.16mi | 3/1.5 | 1,404 (-2%) | 3mo | $180,000 | $128 | 85 |
| 16216 SE 26th St | 0.13mi | 4/1.0 (+1) | 1,482 (+4%) | 1mo | $196,300 | $132 | 82 |
| 2533 Moran Rd | 0.55mi | 2/2.0 (-1) | 1,413 (-1%) | 2mo | $239,900 | $170 | 62 |
| 3900 S Indian Meridian Rd | 0.71mi | 3/1.0 | 1,353 (-5%) | 2mo | $295,500 | $218 | 56 |
| 16693 SE 27th St | 0.54mi | 4/1.5 (+1) | 1,468 (+3%) | 10mo | $274,900 | $187 | 55 |
| 15855 Leslie Rd | 0.62mi | 2/1.0 (-1) | 1,500 (+5%) | 11mo | $325,000 | $217 | 49 |
Match score weights: distance 35% · size 25% · config 20% · recency 20%. Top-matched comps best support the ARV.
Projected returns pro-forma
-3.0% appreciation · 3.0% rent growth · sell at horizon
- IRR
- -7.1%
- Equity multiple
- 0.74×
- Total profit
- $-14,232
- Equity at exit
- $29,075
- IRR
- 2.5%
- Equity multiple
- 1.18×
- Total profit
- $9,832
- Equity at exit
- $16,860
Cash invested: $54,600 (down + closing). Projections, not guarantees.
Landlord ↔ Tenant lean methodology
- Overall (STATE)
- 83 Strongly Landlord-Friendly
- State Oklahoma
- 83 Strongly Landlord-Friendly · R+20
- County
- — inherits STATE
- City
- — inherits STATE
ZIP-level market 73020
- Active inventory
- 326
- Price-to-rent
- 8.6×
Monthly cashflow live
- Estimated rent
- $1,892 medium interval (Pro) →
- Mortgage (P&I)
- −$1,023
- Tax from tax record
- −$117 /mo · $1,407/yr
- Insurance
- −$81
- HOA
- −$0
- Vacancy / Maint / Mgmt
- −$397
- Net cashflow
- $273
Break-even live
UW: 25.0% down · 7.5% · 30yr · 1.5% tax · 5.0% vac · 8.0% maint · 8.0% mgmt
Financing live
Cash to close
- Down payment
- $48,750
- Closing costs
- $5,850
- Reserves months
- —
- Total cash needed
- —
Loan-product check · same deal, 3 products live
Conventional
25% down · 7.5% · 30yr
- Down + closing
- —
- Monthly P&I
- —
- Monthly cashflow
- —
- DSCR
- —
- Eligible?
- —
Personal DTI + credit; lowest rate.
DSCR
20% down · 8.5% · 30yr
- Down + closing
- —
- Monthly P&I
- —
- Monthly cashflow
- —
- DSCR
- —
- Eligible?
- —
No personal income docs; deal must DSCR.
Hard money
10% down · 12.0% · 12mo
- Down + closing
- —
- Monthly P&I
- —
- Monthly cashflow
- —
- DSCR
- —
- Eligible?
- —
Short-term bridge; refi at stabilization.
Listing history 3 events
-
2026-06-13statusdays on market $195,000 Pending 2 DOM
-
2026-06-10remarks 342-char remark
-
2026-06-10$195,000 Active 1 DOM
ⓘ Source: listings_history table (triggers on properties + properties_extension) + one-shot
backfill from property_details.listing_events for pre-trigger history.
Tax reassessment forecast OK · Resets to sale price
- Current annual tax
- $1,407 · $117/mo
- Projected year-2 tax
- $1,755 · $146/mo
- Expected delta
- +$348/yr (+$29/mo · 24.7%)
ⓘ Screening estimate from a state-policy table — verify with the county assessor before closing.
Climate risk First Street
- Flood 1/10 Low FEMA zone X (unshaded) · 0% chance over 30 yrs
- Wildfire 6/10 Major
- Heat 5/10 Major 7 d/yr ≥108°F today · 18 d/yr by 30 yrs out
- Wind 3/10 Moderate 5% chance of damaging wind over 30 yrs
- Air quality 2/10 Low 0 unhealthy d/yr today · 1 by 30 yrs out
Nearby sold comps map
Loading sold comps map…
Walkable amenities ~0.75 mi
Loading nearby amenities…
Taxation est. · year 1
- Rental income
- $22,702
- − Mortgage interest
- −$10,923
- − Property taxes
- −$1,407
- − Insurance
- −$975
- − Repairs & maintenance
- −$1,816
- − Management
- −$1,816
- − Depreciation
- −$5,673
- Taxable income
- $92
- Est. tax owed @ 24.0%
- −$22
- After-tax cash flow
- $3,259/yr
For passive investors: Depreciation is non-cash, so a rental often shows a tax loss while cash-flowing — sheltering income. Rental losses are passive: they offset passive income freely, and up to $25,000/yr can offset ordinary (W-2) income if you actively participate and your MAGI is under $100k (phasing out to $0 by $150k); unused losses carry forward. On sale, claimed depreciation is recaptured at up to 25%, and gains may owe capital-gains tax (a 1031 exchange can defer both). Figures are a year-1 estimate at your 24.0% rate — not tax advice; consult a CPA.
Schools (NCES district)
- District
- Choctaw-Nicoma Park
- NCES district ID
- 4007620
- Math proficiency
- 28% ▼ -10.00%
- Reading proficiency
- 32% ▼ -12.00%
- Median HH income
- $69,072
- Composite
- 28.02/100
- National rank
- #6847
- State rank
- #48 of 270 in OK
Livability — Choctaw
- Score
- 71/100
- State rank
- #31
- US rank
- #6853
Category grades
Schools grade is shown separately in the Schools card above.
Census & demographics
- Census place
- Choctaw, OK
- County
- Oklahoma County · 771,644 people
- City population
- 25,645
- Metro
- Oklahoma City, OK
- Population (ZIP)
- 25,645
- Household income
- $104,601
- Rent vs Own
- Severe rent burden
- 258.0
Population outlook (Oklahoma County) Hauer SSP2
- Today (2025)
- 911,875 people
- By 2030
- 982,413 · +7.7%
- By 2040
- 1,130,468 · +24.0%
- By 2050
- 1,288,422 · +41.3%
- By 2075
- 1,711,482 · +87.7%
- By 2100
- 2,088,448 · +129.0%
Race, ethnicity, and origin ACS 2023
- Neighborhood character
- Predominantly White (77%)
- Race & ethnicity
- White 77% Two or more races 8% Hispanic / Latino 6% Black 5% Native American 4% Asian 2%
- Hispanic origin (detail)
- Mexican 5%
- Common ancestry
- Lithuanian 2% Italian 2% Iranian 2%
- Foreign-born
- 3% · Canada, China
- Languages at home
- 96% English-only · Spanish 2%
Political lean MEDSL · Oklahoma
- 2024 margin
- Toss-up / Even · D 48.0% · R 49.7% · Other 2.3%
- 2008→2024 swing
- +15.1pp toward D · 2008: -16.8pp · 2024: -1.7pp
- All cycles
- 2024: R+1.7 2020: R+1.1 2016: R+10.5 2012: R+16.7 2008: R+16.8
Not yet ingested
- Civics
- —
Market trends
- HPI YoY
- ▼ -131.61%
- Current HPI
- 240.9989
- Rent YoY
- —
- Metro
- Oklahoma City, OK
- State GDP YoY
- ▲ 1.55%
- F500 in state
- 6
Industry mix (Fortune 500 HQ in OK)
| Industry | F500 HQs | Revenue |
|---|---|---|
| Energy | 3 | $48B |
|
||
Price history
+200.0% since first listed8 events — show timeline
- 2026-06-03 Listed $195,000 MLSOK
- 2019-08-06 Sold (Public Records) $105,000 Public Records
- 2019-08-02 Sold (MLS) $105,000 MLSOK
- 2019-07-09 Pending — MLSOK
- 2019-06-26 Price Changed $110,000 MLSOK
- 2019-06-01 Price Changed $115,000 MLSOK
- 2019-05-13 Listed $125,000 MLSOK
- 1986-06-01 Sold (Public Records) $65,000 Public Records
Property tax history
+3.7%/yrLatest (2025): $1,407 · +4.0% YoY. Source: county tax records.
Cash-flow waterfall
monthlySold comps — $/sqft
last 12 mo · ≤1 miLoading sold comps…