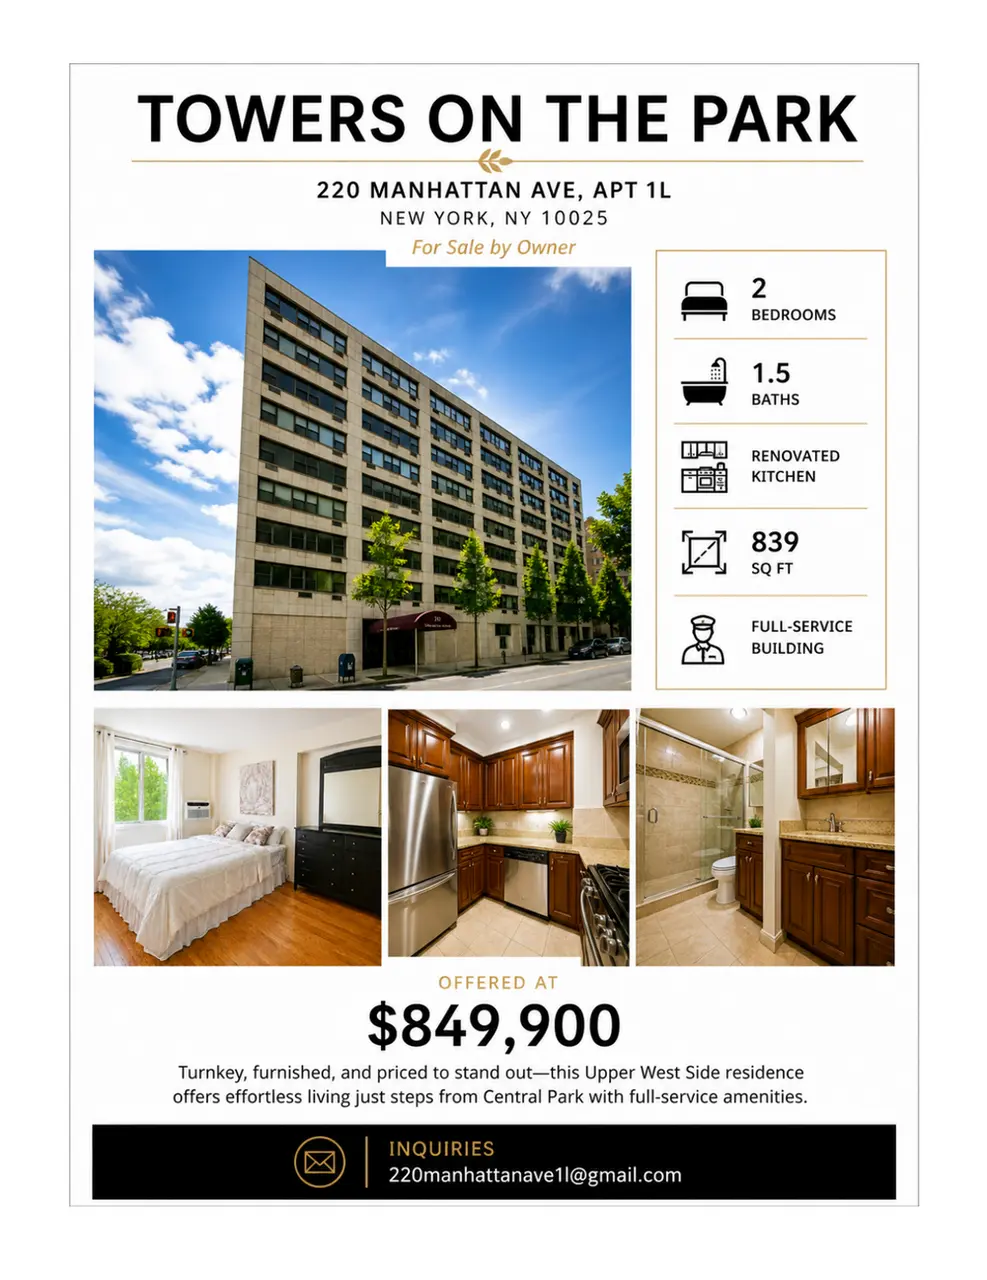
220 Manhattan Ave · New York, NY
Flood risk 1/10 · Minimal
- FEMA flood zone
- X (unshaded)
- Chance of flooding over 30 yrs
- 0.0%
- Est. flood insurance / yr
- $507 – $1,088
Fire risk 1/10 · Minimal
- Est. fire insurance / yr
- $691 – $1,283
Heat risk 6/10 · Moderate
- Hot days now (above 99°F)
- 7 days/yr
- Hot days in 30 yrs
- 15 days/yr
Wind risk 6/10 · Moderate
- Chance of severe wind over 30 yrs
- 27.0%
Air-quality risk 4/10 · Minor
- Unhealthy air days now
- 5 days/yr
- Unhealthy air days in 30 yrs
- 6 days/yr
Risk factors via First Street. Map © Google.
Why this score? — see what drove the D- grade
The composite is a weighted blend of 9 inputs, each scored 0–100. Each bar is that input's sub-score; the figure is the points it added to the 100-point composite (weight × sub-score).
- ARV discount +7.5/15.0
- Appreciation +7.4/10.0
- Cash flow +6.3/30.0
- Schools +5.0/10.0
- Rent growth +4.1/5.0
- Livability +3.8/5.0
- 1% rule +2.6/10.0
- Condition / age +2.5/5.0
- DSCR +0.6/10.0
$849,900
🖨 Deal sheet (PDF) 📄 Offer letter ✓ Due diligence
Listing remarks
Rare opportunity to own a true 2-bedroom condominium steps from Central Park in a full-service doorman building. Beautifully renovated and move-in ready, this 839-square-foot home offers exceptional value in Manhattan's sought-after Morningside Heights neighborhood. Featuring oak hardwood floors throughout, smooth ceilings, an updated kitchen and bathrooms, generous storage, and charming views toward the Cathedral of St. John the Divine and Morningside Park, this residence is ideal as a primary home, pied--terre, or investment property. The spacious living and dining area offers excellent flexibility for entertaining, working from home, or everyday living. The renovated kitchen features sol
Key facts
- Hardwood oak floors
- Landscaped gardens
- Natural light
Tags
Neighborhood map
What this means for you Summary
Snapshot
- This is a 2-bed/1.5-bath condo listed at $850k.
Deal economics
- At list price, monthly cash flow is $-2k ($-18k/yr) — negative.
- To cash-flow at today's rent, offer at most $740k (12.9% below list).
- To meet the 1% rule (rent ≥ 1% of price), the offer needs to be $648k (23.8% below list).
- Recommended offer: $648k (23.8% below list) — sets the bar for 1% rule.
- Cap rate 4.2% vs local median 2.6% in New York — top-decile yield for the area; either an underpriced asset or a hidden risk that comps aren't pricing in. Stress-test before assuming the spread holds.
Location & tenants
- Location reads 75/100 on livability (#268 in NY, #4,188 nationally) — a middle-class / working-renter tenant base. Strengths: amenities A+, commute A+, health & safety A; Watch: crime F, cost of living F.
- Zoned schools: Elm Tree Elementary School (math 27% / reading 52%, grade F, #1,444 of 2,108 statewide, top 71%, 806 students, 94% FRL); Mark Twain Is 239 For The Gifted And Talented (math 90% / reading 96%, grade A+, #6 of 729 statewide, top 1%, 1,207 students, 44% FRL); Midwood High School (math 94% / reading 96%, grade A+, #83 of 1,100 statewide, top 8%, 4,062 students, 73% FRL).
- Market conditions: Rents rising fast (+6.4%/yr); 306 active listings in the ZIP; 40 comparable units currently listed for rent nearby; rentals leasing fast (median 8d on market — plan ~1-2 weeks tenant-placement turnaround); solid renter incomes; 4,467 units permitted in New York County in 2024 (4,463 in 5+ unit buildings).
- At $6,477/mo this rent would consume 71% of the median local household income ($109k/yr) (locally 7824% of renters already pay >50% of income on rent) — very limited rent-growth headroom before tenants either downsize or default.
Forward outlook
- In year one you build about $46k of equity ($6k loan paydown + $40k appreciation (4.7% local appreciation)).
- New York County population projected at +21% by 2050 — long-run rental-demand tailwind backs the buy-and-hold thesis.
- By year 2, paydown + projected appreciation supports a ~$74k cash-out refi (75% LTV) — recoverable capital for the next deal without selling this one.
Negotiation context
- It's been on market 17 days — a 2% lower offer ($837k) is reasonable based on typical stale-listing flexibility.
Risks & watch-outs
- Climate carrying-cost: major wind risk, 27% chance of damaging wind over 30y; extreme-heat days projected 7→15/yr by 2055 (HVAC capex compounding) — expect insurance premiums to compound above CPI over the hold.
Questions for the listing agent
- What do current leases actually rent for vs. the listed asking? Can we see a recent rent roll and the last 12 months of T-12 income?
- What does the HOA fee cover, when was the last increase, and are there any pending special assessments or reserve-fund shortfalls?
- Any open or pending special assessments — roof, HVAC, plumbing, elevator, façade? What's the per-unit balance and payoff schedule, and is the seller paying it off at close or rolling it to the buyer?
- Is there a deadline driving the sale (1031 exchange, divorce, estate, relocation)? That informs how much negotiation room exists.
- Schools are B-rated — typically a magnet for longer-tenancy family renters. What's the average tenant stay here, and is there a school-zone premium baked into asking?
- Crime grade is F in this area — have there been break-ins, vandalism, or insurance claims at this property in the last 3 years? What carrier currently insures it and at what premium?
- The area grade is low — what's the realistic commute time and amenity access for the typical tenant pool here? Any planned neighborhood developments (good or bad) we should know about?
- What's the average days-on-market for RENTAL listings here right now (not sales)? A rising rental-DOM trend means longer vacancies and softer asking-rent achievability than the comps imply.
- What's the recent tenant-quality profile in this submarket — average credit score on applications, eviction rate, late-payment / NSF rate, and stable-employment percentage? A property-management company in the area should have these aggregated.
- How much new apartment / multifamily construction is in the pipeline within 1–3 miles? Heavy new supply (>2% of stock underway) typically softens rents 12–24 months out; light construction supports rent growth.
Investment metrics
- 1% rule
- 0.76% ✗
- Cap rate
- 4.16%
- Cash-on-cash
- -7.62%
- DSCR
- 0.66
- GRM
- 10.9
CMA / ARV
No comps found within radius.
Projected returns pro-forma
4.73% appreciation · 6.4% rent growth · sell at horizon
- IRR
- 7.2%
- Equity multiple
- 1.46×
- Total profit
- $110,171
- Equity at exit
- $467,906
- IRR
- 10.6%
- Equity multiple
- 3.00×
- Total profit
- $475,342
- Equity at exit
- $796,419
Cash invested: $237,972 (down + closing). Projections, not guarantees.
Landlord ↔ Tenant lean methodology
- Overall (CITY)
- 0 Strongly Tenant-Friendly
- State New York
- 15 Strongly Tenant-Friendly · D+10
- County
- — inherits STATE
- City New York
- 0 Strongly Tenant-Friendly · D+34
ZIP-level market 10025
- Home prices YoY
- 1.7%
- Rents YoY
- 6.4%
- Active inventory
- 306
- Price-to-rent
- 10.9×
Monthly cashflow live
- Estimated rent
- $6,477 high interval (Pro) →
- Mortgage (P&I)
- −$4,457
- Tax est. 1.5%
- −$1,062 /mo · $12,748/yr
- Insurance
- −$354
- HOA est. from 3 same-building comps
- −$755
- Vacancy / Maint / Mgmt
- −$1,360
- Net cashflow
- $-1,512
Break-even live
Sensitivity live
| Price | -10% $-925 | -5% $-1,218 | +0% $-1,512 | +5% $-1,806 | +10% $-2,099 |
|---|---|---|---|---|---|
| Rent | -10% $-2,024 | -5% $-1,768 | +0% $-1,512 | +5% $-1,256 | +10% $-1,000 |
| Rate | -1.0pp $-1,084 | -0.5pp $-1,296 | base $-1,512 | +0.5pp $-1,732 | +1.0pp $-1,956 |
UW: 25.0% down · 7.5% · 30yr · 1.5% tax · 5.0% vac · 8.0% maint · 8.0% mgmt
Financing live
Cash to close
- Down payment
- $212,475
- Closing costs
- $25,497
- Reserves months
- —
- Total cash needed
- —
Loan-product check · same deal, 3 products live
Conventional
25% down · 7.5% · 30yr
- Down + closing
- —
- Monthly P&I
- —
- Monthly cashflow
- —
- DSCR
- —
- Eligible?
- —
Personal DTI + credit; lowest rate.
DSCR
20% down · 8.5% · 30yr
- Down + closing
- —
- Monthly P&I
- —
- Monthly cashflow
- —
- DSCR
- —
- Eligible?
- —
No personal income docs; deal must DSCR.
Hard money
10% down · 12.0% · 12mo
- Down + closing
- —
- Monthly P&I
- —
- Monthly cashflow
- —
- DSCR
- —
- Eligible?
- —
Short-term bridge; refi at stabilization.
Rent comps 40 comps
| Address | Beds | Baths | Sqft | Rent | $/sqft | DOM | Units | Dist |
|---|---|---|---|---|---|---|---|---|
| 1 Morningside Dr New York, NY | 3.0 | 1.0–2.0 | 1655 | $8,195 | $4.95 | 0d | 1 | 0.17mi |
| 30 Morningside Dr #2096 New York, NY | 1.0–2.0 | 1.0–2.0 | 780 | $8,940 | $11.45 | 1d | 2 | 0.25mi |
| 420 Central Park W Unit 6K New York, NY | 2.0 | 2.0 | 1060 | $8,000 | $7.55 | 24d | 1 | 0.39mi |
| 202 W 102nd St Unit 1053014P New York, NY | 2.0 | 2.0 | 538 | $10,000 | $18.59 | 24d | 1 | 0.52mi |
| 308 W 107th St Unit 1239985P New York, NY | 1.0 | 1.0 | 559 | $5,497 | $9.83 | 1d | 1 | 0.53mi |
| 312 W 121st St Unit 5-A New York, NY | 3.0 | 1.0 | 800 | $4,655 | $5.82 | 13d | 1 | 0.54mi |
| 506 Manhattan Ave Unit 1A New York, NY | 3.0 | 1.0 | 800 | $4,699 | $5.87 | 13d | 1 | 0.54mi |
| 915 W End Ave #1020 New York, NY | 1.0–3.0 | 1.0–2.0 | 851 | $7,305 | $8.58 | 1d | 2 | 0.55mi |
| 312 W 121st St Unit 4C New York, NY | 3.0 | 2.0 | 900 | $4,854 | $5.39 | 9d | 1 | 0.56mi |
| 508 Manhattan Ave Unit 2C New York, NY | 3.0 | 1.0 | 800 | $4,699 | $5.87 | 13d | 1 | 0.56mi |
| 814 Amsterdam Ave #1019 New York, NY | 1.0–2.0 | 1.0–2.0 | 800 | $5,270 | $6.59 | 26d | 2 | 0.60mi |
| 808 Columbus Ave New York, NY | 2.0 | 1.0–2.0 | 773 | $9,876 | $12.77 | 0d | 30 | 0.60mi |
| 788 Columbus Ave #1323 New York, NY | 1.0–3.0 | 1.0–1.5 | 900 | $6,320 | $7.02 | 26d | 2 | 0.62mi |
| 50 W 97th St #1739 New York, NY | 2.0 | 1.0 | 800 | $6,560 | $8.20 | 8d | 1 | 0.67mi |
| 160 W 97th St #1101 New York, NY | 2.0 | 1.0 | 850 | $6,050 | $7.12 | 15d | 1 | 0.71mi |
| 543 W 122nd St New York, NY | 2.0 | 1.0–2.0 | 1057 | $10,995 | $10.40 | 4d | 7 | 0.73mi |
| 77 E 110th St Unit 1322508P New York, NY | 2.0 | 1.5 | 990 | $6,360 | $6.42 | 26d | 1 | 0.75mi |
| 70 W 95th St New York, NY | 1.0–4.0 | 1.0–2.0 | 1095 | $13,166 | $12.02 | 19d | 1 | 0.78mi |
| 230 W 126th St Unit 20C New York, NY | 2.0 | 1.0 | 860 | $4,555 | $5.30 | 26d | 1 | 0.81mi |
| 309 W 97th St Unit 5N New York, NY | 2.0 | 2.0 | 900 | $5,495 | $6.11 | 26d | 1 | 0.82mi |
| 1399 Park Ave Unit 10C New York, NY | 2.0 | 2.0 | 962 | $5,500 | $5.72 | 1d | 1 | 0.87mi |
| 255 W 94th St #686 New York, NY | 1.0–2.0 | 1.0–2.0 | 750 | $9,090 | $12.12 | 1d | 2 | 0.88mi |
| 134 W 93rd St New York, NY | 1.0 | 1.0 | 763 | $4,700 | $6.16 | 13d | 1 | 0.89mi |
| 1635 Lexington Ave Unit 6D New York, NY | 2.0 | 2.0 | 1112 | $6,000 | $5.40 | 26d | 1 | 0.94mi |
| 122 E 102nd St Unit 1021896P New York, NY | 2.0 | 1.0 | 742 | $5,429 | $7.32 | 17d | 1 | 0.95mi |
| 101 W 90th St New York, NY | 3.0 | 1.0–2.5 | 962 | $6,711 | $6.97 | 0d | 1 | 1.01mi |
| 212 W 91st St New York, NY | 1.0–2.0 | 1.0–2.0 | 825 | $9,650 | $11.70 | 4d | 3 | 1.03mi |
| 212 W 91st St New York, NY | 1.0–2.0 | 1.0–2.0 | 825 | $9,650 | $11.70 | 5d | 4 | 1.03mi |
| 53-55 E 95th St Unit 4A New York, NY | 3.0 | 2.0 | 803 | $7,495 | $9.33 | 9d | 1 | 1.03mi |
| 212 W 91st St #416 New York, NY | 1.0–2.0 | 1.0–2.0 | 825 | $9,660 | $11.71 | 1d | 2 | 1.03mi |
| 600 Columbus Ave Unit 1251680P New York, NY | 1.0–2.0 | 1.0 | 900 | $7,970 | $8.86 | 1d | 2 | 1.05mi |
| 1501 Lexington Ave #932 New York, NY | 1.0 | 1.0 | 583 | $7,403 | $12.69 | 1d | 3 | 1.11mi |
| 2051 2nd Ave Unit 1565856P New York, NY | 2.0 | 1.0 | 914 | $6,836 | $7.48 | 1d | 1 | 1.12mi |
| 210 W 89th St #165 New York, NY | 1.0 | 1.0 | 600 | $5,730 | $9.55 | 1d | 2 | 1.12mi |
| 319 E 109th St Unit 1021947P New York, NY | 3.0 | 1.0 | 818 | $7,260 | $8.88 | 7d | 1 | 1.16mi |
| 175 E 96th St Unit 1251683P New York, NY | 2.0 | 1.0 | 600 | $6,380 | $10.63 | 4d | 2 | 1.17mi |
| 247 W 87th St New York, NY | 1.0 | 1.0–2.0 | 822 | $6,275 | $7.63 | 20d | 2 | 1.19mi |
| 132 W 134th St New York, NY | 2.0 | 1.0 | 750 | $4,500 | $6.00 | 26d | 1 | 1.22mi |
| 300 W 135th St Unit 9G New York, NY | 3.0 | 2.0 | 1032 | $5,500 | $5.33 | 6d | 1 | 1.22mi |
| 215 E 96th St Unit 688 New York, NY | 1.0 | 1.0 | 717 | $7,810 | $10.89 | 0d | 1 | 1.23mi |
HOA detail condo
- Monthly dues
- $0 · $0/yr
- Likely covers
- doorman
- Assessments
- None detected in remarks — confirm with the listing agent.
Listing history 8 events
-
2026-06-21days on market $849,900 Active 17 DOM
-
2026-06-18days on market $849,900 Active 14 DOM
-
2026-06-17days on market $849,900 Active 13 DOM
-
2026-06-15days on market $849,900 Active 11 DOM
-
2026-06-13days on market $849,900 Active 9 DOM
-
2026-06-10days on market $849,900 Active 5 DOM
-
2026-06-08remarks 699-char remark
-
2026-06-08$849,900 Active 4 DOM
ⓘ Source: listings_history table (triggers on properties + properties_extension) + one-shot
backfill from property_details.listing_events for pre-trigger history.
Climate risk First Street
- Flood 1/10 Low FEMA zone X (unshaded) · 0% chance over 30 yrs
- Wildfire 1/10 Low
- Heat 6/10 Major 7 d/yr ≥99°F today · 15 d/yr by 30 yrs out
- Wind 6/10 Major 27% chance of damaging wind over 30 yrs
- Air quality 4/10 Moderate 5 unhealthy d/yr today · 6 by 30 yrs out
Nearby sold comps map
Loading sold comps map…
Walkable amenities ~0.75 mi
Loading nearby amenities…
Taxation est. · year 1
- Rental income
- $77,720
- − Mortgage interest
- −$47,608
- − Property taxes
- −$12,748
- − Insurance
- −$4,250
- − Repairs & maintenance
- −$6,218
- − Management
- −$6,218
- − HOA
- −$9,060
- − Depreciation
- −$24,724
- Taxable loss
- −$33,105
- Est. tax savings @ 24.0%
- +$7,945
- After-tax cash flow
- $-10,198/yr
For passive investors: Depreciation is non-cash, so a rental often shows a tax loss while cash-flowing — sheltering income. Rental losses are passive: they offset passive income freely, and up to $25,000/yr can offset ordinary (W-2) income if you actively participate and your MAGI is under $100k (phasing out to $0 by $150k); unused losses carry forward. On sale, claimed depreciation is recaptured at up to 25%, and gains may owe capital-gains tax (a 1031 exchange can defer both). Figures are a year-1 estimate at your 24.0% rate — not tax advice; consult a CPA.
Schools (NCES district)
No district data.
Livability — New York
- Score
- 75/100
- State rank
- #268
- US rank
- #4188
Category grades
Schools grade is shown separately in the Schools card above.
Census & demographics
- Census place
- New York, NY
- County
- New York County · 1,599,927 people
- City population
- 7,731,280
- Metro
- New York-Newark-Jersey City, NY-NJ-PA
- Population (ZIP)
- 93,065
- Household income
- $108,940
- Rent vs Own
- Severe rent burden
- 7824.0
Population outlook (New York County) Hauer SSP2
- Today (2025)
- 1,825,725 people
- By 2030
- 1,904,611 · +4.3%
- By 2040
- 2,052,719 · +12.4%
- By 2050
- 2,206,601 · +20.9%
- By 2075
- 2,509,427 · +37.4%
- By 2100
- 2,702,933 · +48.0%
Race, ethnicity, and origin ACS 2023
- Neighborhood character
- Diverse neighborhood (Simpson 0.64)
- Race & ethnicity
- White 54% Hispanic / Latino 22% Two or more races 12% Asian 10% Black 10%
- Hispanic origin (detail)
- Mexican 3% Puerto Rican 6% Dominican 6%
- Common ancestry
- Scotch-Irish 4% Romanian 3% Lithuanian 2%
- Foreign-born
- 24% · Canada, China, South Korea
- Languages at home
- 64% English-only · Spanish 18% Chinese 5% French/Haitian/Cajun 3%
Political lean MEDSL · New York
- 2024 margin
- Solid D (+64.8) · D 82.4% · R 17.6%
- 2008→2024 swing
- -7.4pp toward R · 2008: 72.2pp · 2024: 64.8pp
- All cycles
- 2024: D+64.8 2020: D+74.5 2016: D+77.2 2012: D+69.6 2008: D+72.2
Not yet ingested
- Civics
- —
Market trends
- HPI YoY
- ▲ 4.73%
- Current HPI
- 276.1636
- Rent YoY
- ▲ 6.40%
- Metro
- New York-Newark-Jersey City, NY-NJ-PA
- State GDP YoY
- ▲ 2.60%
- F500 in state
- 92
Industry mix (Fortune 500 HQ in NY)
| Industry | F500 HQs | Revenue |
|---|---|---|
| Financial Services | 10 | $950B |
|
||
| Consumer Goods | 9 | $162B |
|
||
| Insurance | 4 | $225B |
|
||
| Telecommunications | 2 | $144B |
|
||
| Pharmaceuticals | 2 | $112B |
|
||
| Media / Entertainment | 2 | $69B |
|
||
Price history
1 event — show timeline
- 2026-06-04 Listed $849,900 ForSaleByOwner.com
Cash-flow waterfall
monthlySold comps — $/sqft
last 12 mo · ≤1 miLoading sold comps…