26210 Venus Trap Trl · Katy, TX
Flood risk 3/10 · Minor
- FEMA flood zone
- X (unshaded)
- Chance of flooding over 30 yrs
- 0.2%
- Est. flood insurance / yr
- $507 – $1,088
Fire risk 4/10 · Minor
- Est. fire insurance / yr
- $1,222 – $2,270
Heat risk 8/10 · Major
- Hot days now (above 111°F)
- 7 days/yr
- Hot days in 30 yrs
- 21 days/yr
Wind risk 9/10 · Severe
- Chance of severe wind over 30 yrs
- 99.0%
Air-quality risk 2/10 · Minimal
- Unhealthy air days now
- 1 days/yr
- Unhealthy air days in 30 yrs
- 2 days/yr
Risk factors via First Street. Map © Google.
Why this score? — see what drove the C- grade
The composite is a weighted blend of 9 inputs, each scored 0–100. Each bar is that input's sub-score; the figure is the points it added to the 100-point composite (weight × sub-score).
- Cash flow +16.6/30.0
- ARV discount +9.5/15.0
- Schools +5.7/10.0
- DSCR +5.1/10.0
- 1% rule +4.7/10.0
- Condition / age +4.0/5.0
- Livability +3.8/5.0
- Rent growth +2.3/5.0
- Appreciation +0.0/10.0
$324,900
🖨 Deal sheet 📄 Offer letter ✓ Due diligence
Listing remarks MLS
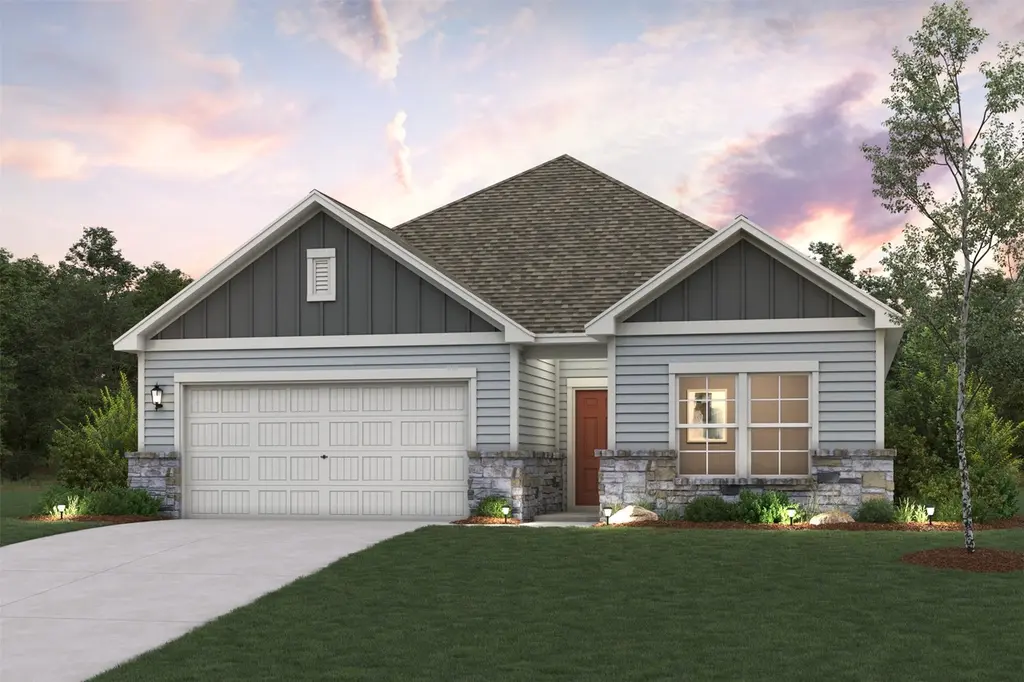
The Cumberland floor plan features a front porch entry that leads to the foyer. Just off of the foyer are two spacious secondary bedrooms and a bathroom with a linen closet. Towards the back of the home is the large island kitchen with corner pantry, all open to the dining area and living room - perfect for entertaining. The primary bedroom is roomy with a large shower and a huge walk-in closet. The fourth bedroom is privately set off of the mudroom.
Key facts
- Huge walk-in closet
- Front porch entry
- Living room
Tags
Neighborhood map
What this means for you Summary
Snapshot
- This is a 4-bed/2.0-bath single-family listed at $325k. Condition is rated good.
Deal economics
- At list price, monthly cash flow is $195 ($2k/yr) — positive.
- The deal already cash-flows at list — no discount required.
- To meet the 1% rule (rent ≥ 1% of price), the offer needs to be $314k (3.3% below list).
- Recommended offer: $314k (3.3% below list) — sets the bar for 1% rule.
- Cap rate 7.0% vs local median 3.0% in Katy — top-decile yield for the area; either an underpriced asset or a hidden risk that comps aren't pricing in. Stress-test before assuming the spread holds.
Location & tenants
- Location reads 76/100 on livability (#111 in TX, #3,613 nationally) — a middle-class / working-renter tenant base. Strengths: employment A+, cost of living A+, housing A+; Watch: crime C-, amenities D, commute F.
- Katy ISD (suburban): math 61% / reading 63% proficiency, ranked #29 of 826 in TX (top 4%) — acceptable for families but not a draw, mixed tenant base, ~2y average lease.
- Market conditions: Rents soft (-0.8%/yr); 2696 active listings in the ZIP; 4 comparable units currently listed for rent nearby; rentals lingering (median 44d on market — plan ~5-8 weeks vacancy on turnover, expect pricing pressure); 50% of comp listings sitting > 30 days — soft ceiling on asking rent; high-income renter base; 29,883 units permitted in Harris County in 2024 (8,621 in 5+ unit buildings).
- This rent runs 32% of the median local income ($118k/yr) — at the standard rent-burdened threshold; future hikes will face affordability resistance.
Forward outlook
- Local home prices are declining (-3.0%/yr); year-one equity from $2k of loan paydown is wiped out by about $10k of value loss. Plan a longer hold.
- Harris County population projected at +47% by 2050 — long-run rental-demand tailwind backs the buy-and-hold thesis.
Negotiation context
- It's been on market 45 days — a 3% lower offer ($315k) is reasonable based on typical stale-listing flexibility.
Risks & watch-outs
- Climate carrying-cost: severe wind risk, 99% chance of damaging wind over 30y; extreme-heat days projected 7→21/yr by 2055 (HVAC capex compounding) — expect insurance premiums to compound above CPI over the hold.
Questions for the listing agent
- It's been on market 45 days. Have you received any prior offers? Is the seller open to a 3% concession, seller financing, or rate buy-down credit?
- What does the HOA fee cover, when was the last increase, and are there any pending special assessments or reserve-fund shortfalls?
- Is there a deadline driving the sale (1031 exchange, divorce, estate, relocation)? That informs how much negotiation room exists.
- Schools are B-rated — typically a magnet for longer-tenancy family renters. What's the average tenant stay here, and is there a school-zone premium baked into asking?
- What's the average days-on-market for RENTAL listings here right now (not sales)? A rising rental-DOM trend means longer vacancies and softer asking-rent achievability than the comps imply.
- What's the recent tenant-quality profile in this submarket — average credit score on applications, eviction rate, late-payment / NSF rate, and stable-employment percentage? A property-management company in the area should have these aggregated.
- How much new for-sale + rental construction is in the pipeline within 1–3 miles? Heavy new supply typically softens prices + rents 12–24 months out; constrained supply supports both.
Investment metrics
- 1% rule
- 0.97% ✗
- Cap rate
- 7.01%
- Cash-on-cash
- 2.57%
- DSCR
- 1.11
- GRM
- 8.6
CMA / ARV
- ARV (median comp)
- $340,060
- List price
- $324,900
- Delta
- -4.46%
- Verdict
- FAIR
- Comps
- 20 within 1.0 mi
Show comp detail 8 sales within ~0.75 mi
| Address | Dist | Beds/Ba | Sqft | Sold | Price | $/sf | Match |
|---|---|---|---|---|---|---|---|
| 26222 Venus Trap Trl | 0.00mi | 4/3.0 | 2,012 (+8%) | 1mo | $339,900 | $169 | 82 |
| 26247 Venus Trap Trl | 0.00mi | 3/2.5 (-1) | 1,678 (-10%) | 1mo | $289,900 | $173 | 76 |
| 25307 Ashbourne Ct | 0.51mi | 3/2.5 (-1) | 1,780 (-4%) | 13mo | $299,995 | $169 | 52 |
| 25302 Benroe St | 0.49mi | 3/2.5 (-1) | 1,693 (-9%) | 19mo | $299,995 | $177 | 40 |
| 3921 Eula Morgan Rd | 0.74mi | 3/2.0 (-1) | 2,061 (+11%) | 8mo | $550,000 | $267 | 36 |
| 4614 Dunston Manor St | 0.71mi | 3/2.0 (-1) | 1,675 (-10%) | 17mo | $309,995 | $185 | 31 |
| 4623 Padbury Manor Ct | 0.74mi | 4/3.0 | 2,130 (+15%) | 9mo | $349,000 | $164 | 30 |
| 25235 Benroe St | 0.49mi | 3/2.5 (-1) | 2,124 (+14%) | 20mo | $347,000 | $163 | 29 |
Match score weights: distance 35% · size 25% · config 20% · recency 20%. Top-matched comps best support the ARV.
Projected returns pro-forma
-3.0% appreciation · 0.0% rent growth · sell at horizon
- IRR
- -15.7%
- Equity multiple
- 0.46×
- Total profit
- $-49,371
- Equity at exit
- $48,444
- IRR
- -13.7%
- Equity multiple
- 0.32×
- Total profit
- $-62,297
- Equity at exit
- $28,091
Cash invested: $90,972 (down + closing). Projections, not guarantees.
Landlord ↔ Tenant lean methodology
- Overall (STATE)
- 87 Strongly Landlord-Friendly
- State Texas
- 87 Strongly Landlord-Friendly · R+5
- County
- — inherits STATE
- City
- — inherits STATE
ZIP-level market 77493
- Rents YoY
- -0.8%
- Active inventory
- 2696
- Price-to-rent
- 8.6×
Monthly cashflow live
- Estimated rent
- $3,142 medium interval (Pro) →
- Mortgage (P&I)
- −$1,704
- Tax est. 1.5%
- −$406 /mo · $4,874/yr
- Insurance
- −$135
- HOA
- −$42
- Vacancy / Maint / Mgmt
- −$660
- Net cashflow
- $195
Break-even live
UW: 25.0% down · 7.5% · 30yr · 1.5% tax · 5.0% vac · 8.0% maint · 8.0% mgmt
Financing live
Cash to close
- Down payment
- $81,225
- Closing costs
- $9,747
- Reserves months
- —
- Total cash needed
- —
Loan-product check · same deal, 3 products live
Conventional
25% down · 7.5% · 30yr
- Down + closing
- —
- Monthly P&I
- —
- Monthly cashflow
- —
- DSCR
- —
- Eligible?
- —
Personal DTI + credit; lowest rate.
DSCR
20% down · 8.5% · 30yr
- Down + closing
- —
- Monthly P&I
- —
- Monthly cashflow
- —
- DSCR
- —
- Eligible?
- —
No personal income docs; deal must DSCR.
Hard money
10% down · 12.0% · 12mo
- Down + closing
- —
- Monthly P&I
- —
- Monthly cashflow
- —
- DSCR
- —
- Eligible?
- —
Short-term bridge; refi at stabilization.
Rent comps 4 comps
| Address | Beds | Baths | Sqft | Rent | $/sqft | DOM | Units | Dist |
|---|---|---|---|---|---|---|---|---|
| 27035 Beacon Glen Dr Katy, TX | 2.0–4.0 | 2.0–3.0 | 1890 | $3,949 | $2.09 | 1d | 16 | 0.86mi |
| 5006 Sunway Dr Katy, TX | 4.0 | 3.0 | 2550 | $2,500 | $0.98 | 43d | 1 | 0.91mi |
| 27064 Beach Ball Dr Katy, TX | 3.0–4.0 | 2.5–3.5 | 1705 | $2,957 | $1.73 | 1d | 25 | 1.28mi |
| 1495 Twilight Green Dr Katy, TX | 3.0 | 2.5 | 2000 | $2,400 | $1.20 | 43d | 1 | 1.40mi |
HOA detail
- Monthly dues
- $42 · $504/yr
Listing history 4 events
-
2026-05-15status Pending 454-char remark
Show marketing remark (454 chars)
The Cumberland floor plan features a front porch entry that leads to the foyer. Just off of the foyer are two spacious secondary bedrooms and a bathroom with a linen closet. Towards the back of the home is the large island kitchen with corner pantry, all open to the dining area and living room - perfect for entertaining. The primary bedroom is roomy with a large shower and a huge walk-in closet. The fourth bedroom is privately set off of the mudroom.
-
2026-05-06price $324,900 454-char remark
Show marketing remark (454 chars)
The Cumberland floor plan features a front porch entry that leads to the foyer. Just off of the foyer are two spacious secondary bedrooms and a bathroom with a linen closet. Towards the back of the home is the large island kitchen with corner pantry, all open to the dining area and living room - perfect for entertaining. The primary bedroom is roomy with a large shower and a huge walk-in closet. The fourth bedroom is privately set off of the mudroom.
-
2026-04-01price $329,900 454-char remark
Show marketing remark (454 chars)
The Cumberland floor plan features a front porch entry that leads to the foyer. Just off of the foyer are two spacious secondary bedrooms and a bathroom with a linen closet. Towards the back of the home is the large island kitchen with corner pantry, all open to the dining area and living room - perfect for entertaining. The primary bedroom is roomy with a large shower and a huge walk-in closet. The fourth bedroom is privately set off of the mudroom.
-
2026-03-31$337,900 Active 454-char remark
Show marketing remark (454 chars)
The Cumberland floor plan features a front porch entry that leads to the foyer. Just off of the foyer are two spacious secondary bedrooms and a bathroom with a linen closet. Towards the back of the home is the large island kitchen with corner pantry, all open to the dining area and living room - perfect for entertaining. The primary bedroom is roomy with a large shower and a huge walk-in closet. The fourth bedroom is privately set off of the mudroom.
ⓘ Source: listings_history table (triggers on properties + properties_extension) + one-shot
backfill from property_details.listing_events for pre-trigger history.
Climate risk First Street
- Flood 3/10 Moderate FEMA zone X (unshaded) · 20% chance over 30 yrs
- Wildfire 4/10 Moderate
- Heat 8/10 Severe 7 d/yr ≥111°F today · 21 d/yr by 30 yrs out
- Wind 9/10 Extreme 99% chance of damaging wind over 30 yrs
- Air quality 2/10 Low 1 unhealthy d/yr today · 2 by 30 yrs out
Nearby sold comps map
Loading sold comps map…
Walkable amenities ~0.75 mi
Loading nearby amenities…
Taxation est. · year 1
- Rental income
- $37,704
- − Mortgage interest
- −$18,199
- − Property taxes
- −$4,874
- − Insurance
- −$1,624
- − Repairs & maintenance
- −$3,016
- − Management
- −$3,016
- − HOA
- −$504
- − Depreciation
- −$9,452
- Taxable loss
- −$2,982
- Est. tax savings @ 24.0%
- +$716
- After-tax cash flow
- $3,054/yr
For passive investors: Depreciation is non-cash, so a rental often shows a tax loss while cash-flowing — sheltering income. Rental losses are passive: they offset passive income freely, and up to $25,000/yr can offset ordinary (W-2) income if you actively participate and your MAGI is under $100k (phasing out to $0 by $150k); unused losses carry forward. On sale, claimed depreciation is recaptured at up to 25%, and gains may owe capital-gains tax (a 1031 exchange can defer both). Figures are a year-1 estimate at your 24.0% rate — not tax advice; consult a CPA.
Condition & rehab AI · 1 photo
This home is in good condition with a good curb appeal and interior finish. It has a good layout and is ready for minor cosmetic updates to enhance its resale and rental value.
Value-add opportunities
- Both Painting exterior and interior walls — Fresh paint enhances curb appeal and interior aesthetics
- Both Landscaping improvements — Enhances curb appeal and adds value
- Resale Kitchen appliances — Modern appliances improve the home's appeal to potential buyers
- Resale Bathroom fixtures — Upgraded fixtures can attract more buyers
Renovation cost estimate screening
Value-add ROI direction
- Both Painting exterior and interior walls — Fresh paint enhances curb appeal and interior aesthetics ↑
- Both Landscaping improvements — Enhances curb appeal and adds value ↑
- Resale Kitchen appliances — Modern appliances improve the home's appeal to potential buyers ↑
- Resale Bathroom fixtures — Upgraded fixtures can attract more buyers ↑
ⓘ Cost ranges are severity-bucket heuristics (US national rule-of-thumb). Get contractor quotes + a written scope before underwriting a rehab budget.
Schools (NCES district)
- District
- Katy ISD
- NCES district ID
- 4825170
- Math proficiency
- 61% ▼ -7.00%
- Reading proficiency
- 63% ▼ -3.00%
- Median HH income
- $90,312
- Composite
- 56.59/100
- National rank
- #1146
- State rank
- #29 of 826 in TX
Livability — Katy
- Score
- 76/100
- State rank
- #111
- US rank
- #3613
Category grades
Schools grade is shown separately in the Schools card above.
Census & demographics
- County
- Harris County · 4,702,590 people
- City population
- 413,575
- Metro
- Houston-The Woodlands-Sugar Land, TX
- Population (ZIP)
- 71,484
- Household income
- $118,464
- Rent vs Own
- Severe rent burden
- 913.0
Population outlook (Harris County) Hauer SSP2
- Today (2025)
- 5,571,493 people
- By 2030
- 6,089,821 · +9.3%
- By 2040
- 7,142,806 · +28.2%
- By 2050
- 8,185,864 · +46.9%
- By 2075
- 10,574,329 · +89.8%
- By 2100
- 12,109,958 · +117.4%
Race, ethnicity, and origin ACS 2023
- Neighborhood character
- Highly diverse neighborhood (Simpson 0.73)
- Race & ethnicity
- White 36% Hispanic / Latino 33% Two or more races 16% Black 15% Asian 12%
- Hispanic origin (detail)
- Mexican 20%
- Common ancestry
- Lithuanian 2% Slovak 1% Italian 1%
- Foreign-born
- 21% · Canada, Vietnam, Jamaica
- Languages at home
- 64% English-only · Spanish 22% Vietnamese 5% French/Haitian/Cajun 4%
Political lean MEDSL · Harris
- 2024 margin
- Lean D (+5.5) · D 52.0% · R 46.4% · Other 1.6%
- 2008→2024 swing
- +3.9pp toward D · 2008: 1.6pp · 2024: 5.5pp
- All cycles
- 2024: D+5.5 2020: D+13.3 2016: D+12.4 2012: D+0.1 2008: D+1.6
Not yet ingested
- Civics
- —
Market trends
- HPI YoY
- ▼ -140.65%
- Current HPI
- 233.1683
- Rent YoY
- ▼ -0.80%
- Metro
- Houston-The Woodlands-Sugar Land, TX
- State GDP YoY
- ▲ 3.95%
- F500 in state
- 110
Industry mix (Fortune 500 HQ in TX)
| Industry | F500 HQs | Revenue |
|---|---|---|
| Energy | 16 | $1,198B |
|
||
| Technology | 5 | $198B |
|
||
| Engineering / Construction | 4 | $72B |
|
||
| Energy Services | 3 | $60B |
|
||
| Utilities | 3 | $41B |
|
||
| Healthcare | 2 | $330B |
|
||
Price history
-3.8% since first listed4 events — show timeline
- 2026-05-15 Pending — HARMLS
- 2026-05-06 Price Changed $324,900 HARMLS
- 2026-04-01 Price Changed $329,900 HARMLS
- 2026-03-31 Listed $337,900 HARMLS
Cash-flow waterfall
monthlySold comps — $/sqft
last 12 mo · ≤1 miLoading sold comps…