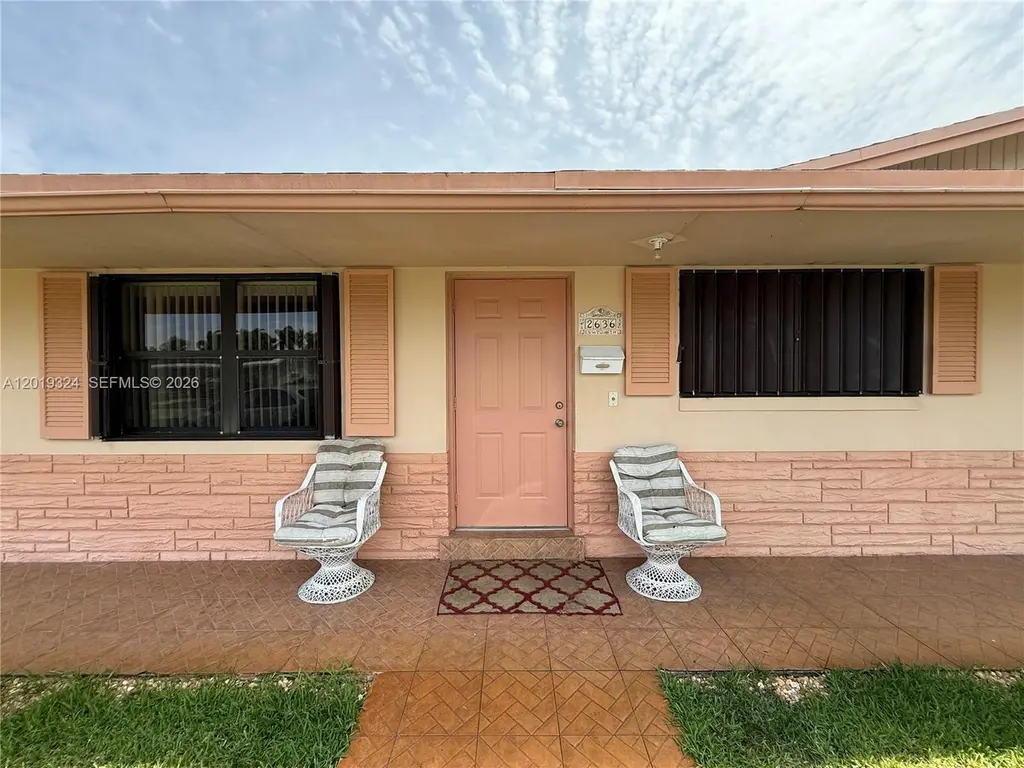
2636 Nassau Rd · Palm Springs, FL
Flood risk 1/10 · Minimal
- FEMA flood zone
- X (unshaded)
- Chance of flooding over 30 yrs
- 0.0%
- Est. flood insurance / yr
- $507 – $1,088
Fire risk 1/10 · Minimal
- Est. fire insurance / yr
- $947 – $1,759
Heat risk 9/10 · Severe
- Hot days now (above 105°F)
- 7 days/yr
- Hot days in 30 yrs
- 25 days/yr
Wind risk 10/10 · Severe
- Chance of severe wind over 30 yrs
- 99.0%
Air-quality risk 2/10 · Minimal
- Unhealthy air days now
- 0 days/yr
- Unhealthy air days in 30 yrs
- 2 days/yr
Risk factors via First Street. Map © Google.
Why this score? — see what drove the B grade
The composite is a weighted blend of 9 inputs, each scored 0–100. Each bar is that input's sub-score; the figure is the points it added to the 100-point composite (weight × sub-score).
- Cash flow +30.0/30.0
- 1% rule +10.0/10.0
- DSCR +10.0/10.0
- ARV discount +7.5/15.0
- Schools +4.3/10.0
- Livability +3.7/5.0
- Rent growth +2.7/5.0
- Condition / age +2.5/5.0
- Appreciation +0.0/10.0
$200,000
🖨 Deal sheet 📄 Offer letter ✓ Due diligence
Listing remarks
Offer subject to third-party (lender) approval. Property requires updating throughout, including older roof and systems. Please submit all offers via MLS Offers. Showing requests must be scheduled through Showing Assist, do not call. Property is occupied. * * * DO NOT DISTURB OCCUPANTS. NO TRESPASSING. * * * PLEASE TEXT AGENT FOR FASTER RESPONSE.
Key facts
- 9,296 sq ft lot
- Garage
- Built 1988
Property features AI
Exterior
- Parking: Detached 1-car garage; Circular driveway
- Utilities: Public water; Public sewer
- Home design: Single-story home
- Construction: Block construction; Shingle roof; Effective year built
- Exterior features: North-facing lot; Less than quarter acre lot
Interior
- Kitchen: Refrigerator
- Bedrooms: Bedroom on main level
- Flooring: Tile flooring
- Bathrooms: 2 full bathrooms
- Heating & cooling: Central heating; Central air conditioning
- Interior features: First floor entry; Bedroom on main level; Family room
Neighborhood map
What this means for you Summary
Snapshot
- This is a 4-bed/2.0-bath single-family listed at $200k.
Deal economics
- At list price, monthly cash flow is $1k ($14k/yr) — positive.
- The deal already cash-flows at list — no discount required.
- Meets the 1% rule at list price ($3k rent vs $200k).
- Recommended offer: $197k (1.5% below list) — sets the bar for market timing.
Location & tenants
- Location reads 73/100 on livability (#297 in FL) — a middle-class / working-renter tenant base. Strengths: cost of living A+, housing A+, health & safety A; Watch: employment D+, schools D-, amenities F.
- Palm Beach (suburban): math 46% / reading 53% proficiency, ranked #34 of 73 in FL (top 47%) — families likely to look elsewhere, expect single-tenant / working-renter base with shorter leases.
- Market conditions: Rents flat; 99 active listings in the ZIP; 25 comparable units currently listed for rent nearby; rentals at typical pace (median 24d on market — plan ~3-4 weeks tenant-placement turnaround); solid renter incomes; 3,974 units permitted in Palm Beach County in 2024 (1,012 in 5+ unit buildings).
- At $3,110/mo this rent would consume 48% of the median local household income ($77k/yr) (locally 768% of renters already pay >50% of income on rent) — very limited rent-growth headroom before tenants either downsize or default.
Forward outlook
- Local home prices are declining (-3.0%/yr); year-one equity from $1k of loan paydown is wiped out by about $6k of value loss. Plan a longer hold.
- Palm Beach County population projected at +30% by 2050 — long-run rental-demand tailwind backs the buy-and-hold thesis.
- At projected returns (-3.0% appreciation + 0.7% rent growth), your $56k cash investment doubles in ~6 years — after that, you're playing with house money.
Negotiation context
- It's been on market 15 days — a 2% lower offer ($197k) is reasonable based on typical stale-listing flexibility.
- Current owner paid $74k; list at $200k implies a 170% gain — meaningful room to come down on a strong offer.
Risks & watch-outs
- Climate carrying-cost: severe wind risk, 99% chance of damaging wind over 30y; extreme-heat days projected 7→25/yr by 2055 (HVAC capex compounding) — expect insurance premiums to compound above CPI over the hold.
Questions for the listing agent
- Is there a deadline driving the sale (1031 exchange, divorce, estate, relocation)? That informs how much negotiation room exists.
- Schools are D-rated, which usually means shorter tenancies and higher turnover. Who's the typical renter profile here, and what's been the actual vacancy rate?
- What's the average days-on-market for RENTAL listings here right now (not sales)? A rising rental-DOM trend means longer vacancies and softer asking-rent achievability than the comps imply.
- What's the recent tenant-quality profile in this submarket — average credit score on applications, eviction rate, late-payment / NSF rate, and stable-employment percentage? A property-management company in the area should have these aggregated.
- How much new for-sale + rental construction is in the pipeline within 1–3 miles? Heavy new supply typically softens prices + rents 12–24 months out; constrained supply supports both.
Investment metrics
- 1% rule
- 1.56% ✓
- Cap rate
- 13.29%
- Cash-on-cash
- 24.99%
- DSCR
- 2.11
- GRM
- 5.4
CMA / ARV
No comps found within radius.
Projected returns pro-forma
-3.0% appreciation · 0.68% rent growth · sell at horizon
- IRR
- 15.9%
- Equity multiple
- 1.62×
- Total profit
- $34,762
- Equity at exit
- $29,821
- IRR
- 22.8%
- Equity multiple
- 2.75×
- Total profit
- $98,079
- Equity at exit
- $17,292
Cash invested: $56,000 (down + closing). Projections, not guarantees.
Landlord ↔ Tenant lean methodology
- Overall (STATE)
- 87 Strongly Landlord-Friendly
- State Florida
- 87 Strongly Landlord-Friendly · R+3
- County
- — inherits STATE
- City
- — inherits STATE
ZIP-level market 33406
- Rents YoY
- 0.7%
- Active inventory
- 99
- Price-to-rent
- 5.4×
Monthly cashflow live
- Estimated rent
- $3,110 high interval (Pro) →
- Mortgage (P&I)
- −$1,049
- Tax from tax record
- −$159 /mo · $1,906/yr
- Insurance
- −$83
- HOA
- −$0
- Vacancy / Maint / Mgmt
- −$653
- Net cashflow
- $1,166
Break-even live
UW: 25.0% down · 7.5% · 30yr · 1.5% tax · 5.0% vac · 8.0% maint · 8.0% mgmt
Financing live
Cash to close
- Down payment
- $50,000
- Closing costs
- $6,000
- Reserves months
- —
- Total cash needed
- —
Loan-product check · same deal, 3 products live
Conventional
25% down · 7.5% · 30yr
- Down + closing
- —
- Monthly P&I
- —
- Monthly cashflow
- —
- DSCR
- —
- Eligible?
- —
Personal DTI + credit; lowest rate.
DSCR
20% down · 8.5% · 30yr
- Down + closing
- —
- Monthly P&I
- —
- Monthly cashflow
- —
- DSCR
- —
- Eligible?
- —
No personal income docs; deal must DSCR.
Hard money
10% down · 12.0% · 12mo
- Down + closing
- —
- Monthly P&I
- —
- Monthly cashflow
- —
- DSCR
- —
- Eligible?
- —
Short-term bridge; refi at stabilization.
Rent comps 25 comps
| Address | Beds | Baths | Sqft | Rent | $/sqft | DOM | Units | Dist |
|---|---|---|---|---|---|---|---|---|
| 2374 Post St West Palm Beach, FL | 3.0 | 2.5 | 1612 | $2,900 | $1.80 | 24d | 1 | 0.15mi |
| 2374 Post St West Palm Beach, FL | 3.0 | 2.5 | 1612 | $2,900 | $1.80 | 17d | 1 | 0.15mi |
| 2394 Post St West Palm Beach, FL | 3.0 | 2.5 | 1612 | $2,800 | $1.74 | 24d | 1 | 0.16mi |
| 2394 Post St West Palm Beach, FL | 3.0 | 2.5 | 1612 | $2,800 | $1.74 | 19d | 1 | 0.16mi |
| 2820 Troubadour St West Palm Beach, FL | 3.0 | 2.5 | 1691 | $3,000 | $1.77 | 24d | 1 | 0.21mi |
| 2833 Troubadour St #2833 Palm Springs, FL | 3.0 | 2.5 | 1691 | $3,200 | $1.89 | 2d | 1 | 0.22mi |
| 2854 Bard St Palm Springs, FL | 3.0 | 2.5 | 1612 | $2,900 | $1.80 | 24d | 1 | 0.25mi |
| 2637 Exuma Rd West Palm Beach, FL | 4.0 | 2.0 | 1546 | $3,800 | $2.46 | 3d | 1 | 0.32mi |
| 1905 Meadow Ct West Palm Beach, FL | 3.0 | 2.0 | 1222 | $7,000 | $5.73 | 24d | 1 | 0.43mi |
| 2085 S Congress Ave Palm Springs, FL | 1.0–3.0 | 1.0–2.0 | 963 | $3,060 | $3.18 | 2d | 14 | 0.52mi |
| 1837 16th Ave N Lake Worth Beach, FL | 3.0 | 2.0 | 1746 | $4,990 | $2.86 | 24d | 1 | 0.86mi |
| 1160 Sepia Ln Lake Worth, FL | 3.0 | 2.5 | 1578 | $2,600 | $1.65 | 2d | 1 | 0.91mi |
| 441 San Mateo Dr Palm Springs, FL | 3.0 | 2.0 | 1092 | $3,000 | $2.75 | 24d | 1 | 0.97mi |
| 2508 10th Ave N Lake Worth Beach, FL | 3.0 | 2.0 | 1025 | $2,557 | $2.49 | 24d | 1 | 0.98mi |
| 910 Rudolf Rd Lake Worth, FL | 3.0 | 1.0 | 1000 | $2,500 | $2.50 | 24d | 1 | 1.00mi |
| 124 Abaco Dr Palm Springs, FL | 3.0 | 2.0 | 988 | $2,900 | $2.94 | 15d | 1 | 1.03mi |
| 1717 16th Ct N Lake Worth Beach, FL | 3.0 | 2.0 | 1360 | $3,250 | $2.39 | 24d | 1 | 1.12mi |
| 6504 Heather Way West Palm Beach, FL | 3.0 | 2.0 | 1643 | $3,400 | $2.07 | 7d | 1 | 1.14mi |
| 724 Springdale Cir Palm Springs, FL | 3.0 | 2.5 | 1540 | $2,600 | $1.69 | 15d | 1 | 1.15mi |
| 744 Springdale Cir Palm Springs, FL | 3.0 | 2.5 | 1540 | $2,900 | $1.88 | 24d | 1 | 1.18mi |
| 1317 Willow Rd West Palm Beach, FL | 3.0 | 2.0 | 1502 | $3,200 | $2.13 | 15d | 1 | 1.18mi |
| 3125 Shelby Way Palm Springs, FL | 3.0 | 2.0 | 1408 | $3,000 | $2.13 | 20d | 1 | 1.41mi |
| 824 Winters St West Palm Beach, FL | 3.0 | 2.0 | 1370 | $3,000 | $2.19 | 24d | 1 | 1.44mi |
| 1217 N D St Lake Worth Beach, FL | 3.0 | 1.0 | 926 | $2,700 | $2.92 | 22d | 1 | 1.46mi |
| 6003 Waterview Cir Palm Springs, FL | 3.0 | 2.5 | 1500 | $2,550 | $1.70 | 24d | 1 | 1.48mi |
Listing history 5 events
-
2026-06-18days on market $200,000 Active 15 DOM
-
2026-06-17status $200,000 Active 14 DOM
-
2026-05-13$200,000 Active
-
1987-06-01soldstatus $74,000
-
1978-01-01soldstatus $43,500
ⓘ Source: listings_history table (triggers on properties + properties_extension) + one-shot
backfill from property_details.listing_events for pre-trigger history.
Tax reassessment forecast FL · Resets to sale price
- Current annual tax
- $1,906 · $159/mo
- Projected year-2 tax
- $1,906 · $159/mo
- Expected delta
- $0/yr ($0/mo · 0.0%)
ⓘ Screening estimate from a state-policy table — verify with the county assessor before closing.
Climate risk First Street
- Flood 1/10 Low FEMA zone X (unshaded) · 0% chance over 30 yrs
- Wildfire 1/10 Low
- Heat 9/10 Extreme 7 d/yr ≥105°F today · 25 d/yr by 30 yrs out
- Wind 10/10 Extreme 99% chance of damaging wind over 30 yrs
- Air quality 2/10 Low 0 unhealthy d/yr today · 2 by 30 yrs out
Nearby sold comps map
Loading sold comps map…
Walkable amenities ~0.75 mi
Loading nearby amenities…
Taxation est. · year 1
- Rental income
- $37,324
- − Mortgage interest
- −$11,203
- − Property taxes
- −$1,906
- − Insurance
- −$1,000
- − Repairs & maintenance
- −$2,986
- − Management
- −$2,986
- − Depreciation
- −$5,818
- Taxable income
- $11,425
- Est. tax owed @ 24.0%
- −$2,742
- After-tax cash flow
- $11,252/yr
For passive investors: Depreciation is non-cash, so a rental often shows a tax loss while cash-flowing — sheltering income. Rental losses are passive: they offset passive income freely, and up to $25,000/yr can offset ordinary (W-2) income if you actively participate and your MAGI is under $100k (phasing out to $0 by $150k); unused losses carry forward. On sale, claimed depreciation is recaptured at up to 25%, and gains may owe capital-gains tax (a 1031 exchange can defer both). Figures are a year-1 estimate at your 24.0% rate — not tax advice; consult a CPA.
Schools (NCES district)
- District
- Palm Beach
- NCES district ID
- 1201500
- Math proficiency
- 46% ▼ -16.00%
- Reading proficiency
- 53% ▼ -4.00%
- Median HH income
- $53,943
- Composite
- 42.72/100
- National rank
- #3160
- State rank
- #34 of 73 in FL
Livability — Palm Springs
- Score
- 73/100
- State rank
- #297
- US rank
- #5045
Category grades
Schools grade is shown separately in the Schools card above.
Census & demographics
- County
- Palm Beach County · 1,438,312 people
- City population
- 49,443
- Metro
- Miami-Fort Lauderdale-Pompano Beach, FL
- Population (ZIP)
- 26,945
- Household income
- $77,075
- Rent vs Own
- Severe rent burden
- 768.0
Population outlook (Palm Beach County) Hauer SSP2
- Today (2025)
- 1,637,487 people
- By 2030
- 1,743,255 · +6.5%
- By 2040
- 1,948,712 · +19.0%
- By 2050
- 2,132,979 · +30.3%
- By 2075
- 2,530,027 · +54.5%
- By 2100
- 2,706,979 · +65.3%
Race, ethnicity, and origin ACS 2023
- Neighborhood character
- Diverse neighborhood (Simpson 0.59)
- Race & ethnicity
- Hispanic / Latino 54% White 33% Two or more races 29% Black 8% Asian 3%
- Hispanic origin (detail)
- Mexican 8% Puerto Rican 5% Cuban 17% Dominican 5% Salvadoran 1%
- Common ancestry
- Hispanic 3% Lithuanian 2% Romanian 1%
- Foreign-born
- 39% · Canada, Jamaica, Vietnam
- Languages at home
- 45% English-only · Spanish 49% French/Haitian/Cajun 2% Other Indo-European 1%
Political lean MEDSL · Palm Beach
- 2024 margin
- Toss-up / Even · D 50.0% · R 49.2%
- 2008→2024 swing
- -22.1pp toward R · 2008: 22.9pp · 2024: 0.8pp
- All cycles
- 2024: D+0.8 2020: D+12.8 2016: D+15.3 2012: D+17.0 2008: D+22.9
Not yet ingested
- Civics
- —
Market trends
- HPI YoY
- ▼ -384.39%
- Current HPI
- 441.2523
- Rent YoY
- ▲ 0.68%
- Metro
- Miami-Fort Lauderdale-Pompano Beach, FL
- State GDP YoY
- ▲ 3.28%
- F500 in state
- 36
Industry mix (Fortune 500 HQ in FL)
| Industry | F500 HQs | Revenue |
|---|---|---|
| Industrial Technology | 2 | $29B |
|
||
| Insurance | 2 | $17B |
|
||
| Retail | 1 | $60B |
|
||
| Technology Distribution | 1 | $58B |
|
||
| Homebuilding | 1 | $35B |
|
||
| Technology Manufacturing | 1 | $35B |
|
||
Price history
+359.8% since first listed3 events — show timeline
- 2026-05-13 Listed $200,000 MARMLS
- 1987-06-01 Sold (Public Records) $74,000 Public Records
- 1978-01-01 Sold (Public Records) $43,500 Public Records
Property tax history
+2.5%/yrLatest (2025): $1,906 · +3.4% YoY. Source: county tax records.
Cash-flow waterfall
monthlySold comps — $/sqft
last 12 mo · ≤1 miLoading sold comps…