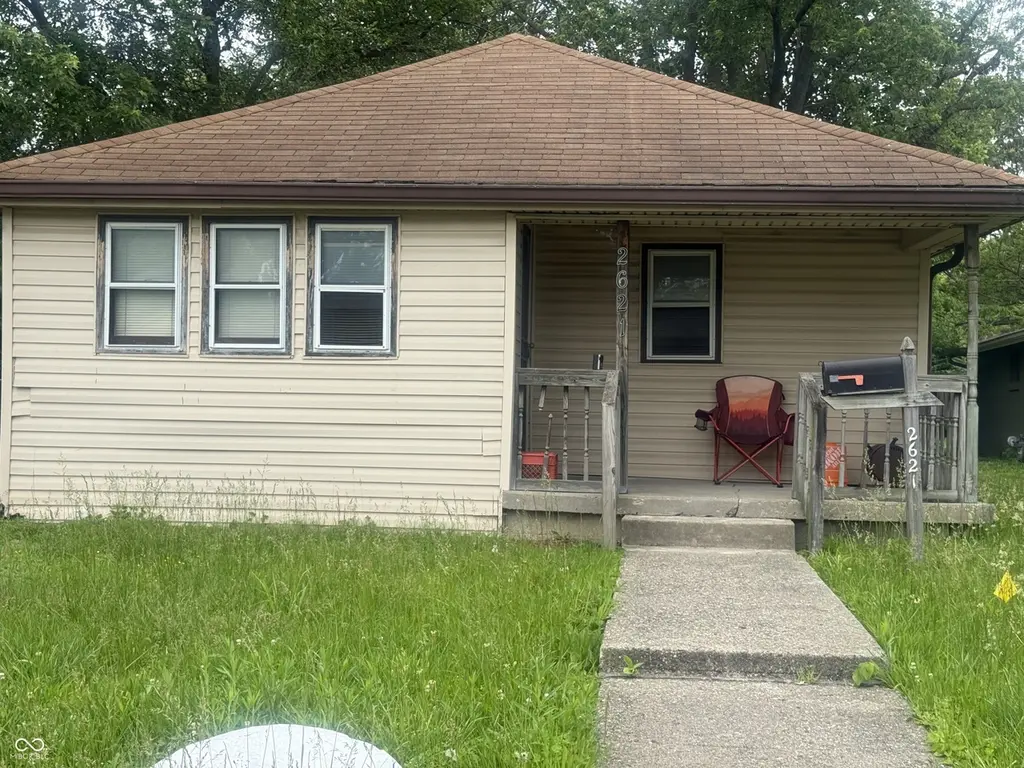
2621 N Tacoma Ave · Indianapolis city (balance), IN
Flood risk 1/10 · Minimal
- FEMA flood zone
- X (unshaded)
- Chance of flooding over 30 yrs
- 0.0%
- Est. flood insurance / yr
- $507 – $1,088
Fire risk 1/10 · Minimal
- Est. fire insurance / yr
- $717 – $1,331
Heat risk 3/10 · Minor
- Hot days now (above 102°F)
- 7 days/yr
- Hot days in 30 yrs
- 19 days/yr
Wind risk 2/10 · Minimal
- Chance of severe wind over 30 yrs
- 0.0%
Air-quality risk 4/10 · Minor
- Unhealthy air days now
- 5 days/yr
- Unhealthy air days in 30 yrs
- 7 days/yr
Risk factors via First Street. Map © Google.
Why this score? — see what drove the C- grade
The composite is a weighted blend of 9 inputs, each scored 0–100. Each bar is that input's sub-score; the figure is the points it added to the 100-point composite (weight × sub-score).
- Cash flow +24.6/30.0
- DSCR +8.0/10.0
- 1% rule +6.5/10.0
- ARV discount +4.4/15.0
- Rent growth +2.7/5.0
- Livability +2.5/5.0
- Condition / age +2.5/5.0
- Schools +1.4/10.0
- Appreciation +0.0/10.0
$90,000
🖨 Deal sheet 📄 Offer letter ✓ Due diligence
Listing remarks
At 2621 N Tacoma AVE, Indianapolis, IN, USA, discover a single-family residence built in 1930, offering 1560 square feet of living space on a 5097 square foot lot. This property provides a unique opportunity to embrace a home with character and potential. The residence features two comfortable bedrooms, offering flexible arrangements for rest and personal space. A single full bathroom serves the home, designed for everyday convenience. This charming property, spread across 1.5 stories, presents a distinctive layout that adds to its appeal. We invite you to experience the possibilities this distinctive property offers.
Key facts
- 5,097 sq ft lot
- Garage
- Built 1930
Property features AI
Finance
- HOA & community: Community features include sidewalks and street lights
Exterior
- Parking: Detached garage (1 garage space); On-street parking; Also listed as no designated parking in one field
- Utilities: Community sewer; Private water; Municipal solid waste service
- Home design: Single family residence (attached property); One and one-half stories; North-facing
- Construction: Wood siding; Crawl space foundation
- Exterior features: Street lights and sidewalks in the community
Interior
- Kitchen: Gas cooktop; Disposal; Refrigerator
- Bedrooms: Two bedrooms on the upper level
- Bathrooms: One full bathroom with tub and shower (main level)
- Heating & cooling: Forced air heating; Central air conditioning
- Interior features: Attic with pull-down stairs; Family room (main level)
- Laundry & utility: In-unit laundry
Neighborhood map
What this means for you Summary
Snapshot
- This is a 2-bed/1.0-bath single-family listed at $90k.
Deal economics
- At list price, monthly cash flow is $187 ($2k/yr) — positive.
- The deal already cash-flows at list — no discount required.
- Meets the 1% rule at list price ($1k rent vs $90k).
- Cap rate 8.8% vs local median 4.4% in Indianapolis city (balance) — top-decile yield for the area; either an underpriced asset or a hidden risk that comps aren't pricing in. Stress-test before assuming the spread holds.
Location & tenants
- Location reads: area grade C — affects rentability + tenant quality, not the cash-flow math above.
- Indianapolis Public Schools (urban): math 14% / reading 20% proficiency, ranked #286 of 301 in IN (top 95%) — low school quality limits family demand, transient renter base, plan for 1-2y turnover; 77% free/reduced lunch — lower-income household profile, screen leases tightly.
- Market conditions: Rents flat; 334 active listings in the ZIP; 40 comparable units currently listed for rent nearby; rentals at typical pace (median 24d on market — plan ~3-4 weeks tenant-placement turnaround); lower-income renter base — watch delinquency; 1,906 units permitted in Marion County in 2024 (621 in 5+ unit buildings).
- This rent runs 33% of the median local income ($38k/yr) — at the standard rent-burdened threshold; future hikes will face affordability resistance.
Forward outlook
- Local home prices are declining (-3.0%/yr); year-one equity from $622 of loan paydown is wiped out by about $3k of value loss. Plan a longer hold.
- Marion County population projected at +18% by 2050 — long-run rental-demand tailwind backs the buy-and-hold thesis.
Negotiation context
- Only 10 days on market — expect competitive offers; lowballing is unlikely to land.
- 5 sale attempts since 2y ago with the ask held roughly flat each time — persistent listings suggest the price (not the market) is what's stuck; bring a comps-based counter.
Risks & watch-outs
- Watch-outs: built in 1930 — expect roof / HVAC / electrical / plumbing capex.
Questions for the listing agent
- Built in 1930 — when were the roof, HVAC, electrical panel, plumbing, and water heater last replaced?
- Is there a deadline driving the sale (1031 exchange, divorce, estate, relocation)? That informs how much negotiation room exists.
- What's the average days-on-market for RENTAL listings here right now (not sales)? A rising rental-DOM trend means longer vacancies and softer asking-rent achievability than the comps imply.
- What's the recent tenant-quality profile in this submarket — average credit score on applications, eviction rate, late-payment / NSF rate, and stable-employment percentage? A property-management company in the area should have these aggregated.
- How much new for-sale + rental construction is in the pipeline within 1–3 miles? Heavy new supply typically softens prices + rents 12–24 months out; constrained supply supports both.
Investment metrics
- 1% rule
- 1.15% ✓
- Cap rate
- 8.78%
- Cash-on-cash
- 8.89%
- DSCR
- 1.40
- GRM
- 7.3
CMA / ARV
- ARV (on-the-fly)
- $84,240
- Comps found
- 12
Show comp detail 12 sales within ~0.75 mi
| Address | Dist | Beds/Ba | Sqft | Sold | Price | $/sf | Match |
|---|---|---|---|---|---|---|---|
| 2839 N Lasalle St | 0.56mi | 2/1.0 | 768 (-2%) | 5mo | $55,000 | $72 | 67 |
| 2347 N Rural St | 0.29mi | 2/1.0 | 864 (+11%) | 4mo | $50,000 | $58 | 66 |
| 2801 Brouse Ave | 0.23mi | 2/1.0 | 720 (-8%) | 13mo | $74,900 | $104 | 65 |
| 2724 N Dearborn St | 0.43mi | 2/1.0 | 720 (-8%) | 10mo | $95,000 | $132 | 59 |
| 2942 N Dearborn St | 0.57mi | 2/1.0 | 825 (+6%) | 7mo | $70,000 | $85 | 58 |
| 3135 N Temple Ave | 0.65mi | 1/1.0 (-1) | 725 (-7%) | 4mo | $78,000 | $108 | 50 |
| 3015 Adams St | 0.74mi | 2/1.0 | 819 (+5%) | 9mo | $155,000 | $189 | 50 |
| 2959 N Lasalle St | 0.65mi | 2/1.0 | 720 (-8%) | 11mo | $59,900 | $83 | 48 |
| 3051 N Tacoma Ave | 0.54mi | 2/1.0 | 856 (+10%) | 15mo | $101,000 | $118 | 46 |
| 3105 N Tacoma Ave | 0.59mi | 2/1.0 | 696 (-11%) | 10mo | $137,500 | $198 | 46 |
| 3061 N Tacoma Ave | 0.56mi | 2/1.0 | 672 (-14%) | 6mo | $43,000 | $64 | 45 |
| 2818 N Lasalle St | 0.52mi | 3/2.0 (+1) | 875 (+12%) | 2mo | $195,000 | $223 | 45 |
Match score weights: distance 35% · size 25% · config 20% · recency 20%. Top-matched comps best support the ARV.
Projected returns pro-forma
-3.0% appreciation · 0.81% rent growth · sell at horizon
- IRR
- -5.3%
- Equity multiple
- 0.81×
- Total profit
- $-4,899
- Equity at exit
- $13,419
- IRR
- 1.5%
- Equity multiple
- 1.09×
- Total profit
- $2,385
- Equity at exit
- $7,782
Cash invested: $25,200 (down + closing). Projections, not guarantees.
Landlord ↔ Tenant lean methodology
- Overall (STATE)
- 90 Strongly Landlord-Friendly
- State Indiana
- 90 Strongly Landlord-Friendly · R+11
- County
- — inherits STATE
- City
- — inherits STATE
ZIP-level market 46218
- Home prices YoY
- -17.1%
- Rents YoY
- 0.8%
- Active inventory
- 334
- Price-to-rent
- 7.3×
Monthly cashflow live
- Estimated rent
- $1,032 high interval (Pro) →
- Mortgage (P&I)
- −$472
- Tax from tax record
- −$119 /mo · $1,433/yr
- Insurance
- −$38
- HOA
- −$0
- Vacancy / Maint / Mgmt
- −$217
- Net cashflow
- $187
Break-even live
UW: 25.0% down · 7.5% · 30yr · 1.5% tax · 5.0% vac · 8.0% maint · 8.0% mgmt
Financing live
Cash to close
- Down payment
- $22,500
- Closing costs
- $2,700
- Reserves months
- —
- Total cash needed
- —
Loan-product check · same deal, 3 products live
Conventional
25% down · 7.5% · 30yr
- Down + closing
- —
- Monthly P&I
- —
- Monthly cashflow
- —
- DSCR
- —
- Eligible?
- —
Personal DTI + credit; lowest rate.
DSCR
20% down · 8.5% · 30yr
- Down + closing
- —
- Monthly P&I
- —
- Monthly cashflow
- —
- DSCR
- —
- Eligible?
- —
No personal income docs; deal must DSCR.
Hard money
10% down · 12.0% · 12mo
- Down + closing
- —
- Monthly P&I
- —
- Monthly cashflow
- —
- DSCR
- —
- Eligible?
- —
Short-term bridge; refi at stabilization.
Rent comps 40 comps
| Address | Beds | Baths | Sqft | Rent | $/sqft | DOM | Units | Dist |
|---|---|---|---|---|---|---|---|---|
| 2530 N Temple Ave Indianapolis, IN | 1.0 | 1.0 | 720 | $750 | $1.04 | 20d | 1 | 0.04mi |
| 2821 Oxford Ln Indianapolis, IN | 1.0 | 1.0 | 640 | $825 | $1.29 | 44d | 1 | 0.19mi |
| 2010 E 25th St Indianapolis, IN | 2.0 | 1.0 | 792 | $775 | $0.98 | 24d | 1 | 0.31mi |
| 3011 Oxford Ln Indianapolis, IN | 1.0 | 1.0 | 640 | $800 | $1.25 | 44d | 1 | 0.31mi |
| 2449 Wheeler St Indianapolis, IN | 1.0 | 1.0 | 600 | $950 | $1.58 | 24d | 1 | 0.38mi |
| 2820 Caroline Ave Indianapolis, IN | 3.0 | 1.5 | 1112 | $1,250 | $1.12 | 24d | 1 | 0.38mi |
| 2372 Beckwith Dr Indianapolis, IN | 4.0 | 1.0–1.5 | 779 | $1,064 | $1.36 | 2d | 32 | 0.39mi |
| 2931 N Tacoma Ave Unit 31 Indianapolis, IN | 2.0 | 1.0 | 800 | $950 | $1.19 | 7d | 1 | 0.40mi |
| 2422 Adams St Unit 2 Indianapolis, IN | 1.0 | 1.0 | 700 | $850 | $1.21 | 44d | 1 | 0.56mi |
| 2410 Adams St Indianapolis, IN | 3.0 | 1.0 | 900 | $1,200 | $1.33 | 10d | 1 | 0.57mi |
| 2930 N Dearborn St Indianapolis, IN | 1.0 | 1.0 | 536 | $599 | $1.12 | 24d | 1 | 0.57mi |
| 2920 N Lasalle St Indianapolis, IN | 3.0 | 1.0 | 875 | $1,095 | $1.25 | 18d | 1 | 0.60mi |
| 2722 N Olney St Indianapolis, IN | 2.0 | 1.0 | 650 | $795 | $1.22 | 44d | 1 | 0.68mi |
| 2949 Adams St Indianapolis, IN | 2.0 | 1.0 | 978 | $1,150 | $1.18 | 44d | 1 | 0.70mi |
| 2045 N Dearborn St Indianapolis, IN | 3.0 | 2.0 | 912 | $1,145 | $1.26 | 24d | 1 | 0.73mi |
| 1931 N Oxford St Indianapolis, IN | 1.0 | 1.0 | 616 | $875 | $1.42 | 4d | 1 | 0.80mi |
| 2815 Brookside Ave Indianapolis, IN | 3.0 | 2.0 | 1120 | $1,350 | $1.21 | 10d | 1 | 0.81mi |
| 2841 E 19th St Indianapolis, IN | 2.0 | 1.0 | 812 | $850 | $1.05 | 4d | 1 | 0.86mi |
| 2549 Columbia Ave Unit 1332865P Indianapolis, IN | 3.0 | 2.0 | 893 | $2,274 | $2.55 | 2d | 1 | 0.88mi |
| 2827 E 18th St Indianapolis, IN | 2.0 | 1.0 | 726 | $1,300 | $1.79 | 24d | 1 | 0.93mi |
| 3207 N Arsenal Ave Indianapolis, IN | 3.0 | 1.0 | 994 | $1,195 | $1.20 | 24d | 1 | 0.99mi |
| 3058 Brookside Parkway North Dr Indianapolis, IN | 1.0 | 1.0 | 700 | $875 | $1.25 | 12d | 1 | 1.00mi |
| 3363 Nicholas Ave Indianapolis, IN | 2.0 | 1.0 | 720 | $1,000 | $1.39 | 4d | 1 | 1.00mi |
| 3132 Dr Andrew J Brown Ave Indianapolis, IN | 2.0 | 1.0–2.0 | 791 | $2,120 | $2.68 | 2d | 46 | 1.07mi |
| 2405 E 16th St Indianapolis, IN | 3.0 | 1.0 | 1120 | $1,450 | $1.29 | 15d | 1 | 1.12mi |
| 2862 N Chester Ave Indianapolis, IN | 3.0 | 2.0 | 1076 | $1,520 | $1.41 | 44d | 1 | 1.13mi |
| 2529 Guilford Ave Unit A Indianapolis, IN | 2.0 | 1.5 | 1000 | $1,495 | $1.50 | 44d | 1 | 1.15mi |
| 3920 E 30th St Indianapolis, IN | 3.0 | 1.0 | 1071 | $1,350 | $1.26 | 7d | 1 | 1.16mi |
| 3920 E 30th St Indianapolis, IN | 3.0 | 1.0 | 1071 | $1,350 | $1.26 | 4d | 1 | 1.16mi |
| 3472 N Dearborn St Indianapolis, IN | 2.0 | 1.0 | 890 | $1,099 | $1.23 | 20d | 1 | 1.17mi |
| 3139 Guilford Ave Indianapolis, IN | 3.0 | 1.0 | 1068 | $1,345 | $1.26 | 44d | 1 | 1.21mi |
| 3535 N Oxford St Indianapolis, IN | 3.0 | 1.0 | 1015 | $1,500 | $1.48 | 22d | 1 | 1.21mi |
| 2864 Forest Manor Ave Indianapolis, IN | 3.0 | 1.0 | 1018 | $1,500 | $1.47 | 24d | 1 | 1.21mi |
| 1902 E 35th St Indianapolis, IN | 3.0 | 1.0 | 1100 | $1,600 | $1.45 | 44d | 1 | 1.22mi |
| 3421 N Olney St Indianapolis, IN | 2.0 | 1.0 | 720 | $1,195 | $1.66 | 16d | 1 | 1.24mi |
| 3383 Station St Indianapolis, IN | 3.0 | 1.0 | 744 | $1,250 | $1.68 | 24d | 1 | 1.26mi |
| 3203 Sutherland Ave Unit 1310761P Indianapolis, IN | 2.0 | 1.0 | 1097 | $3,668 | $3.34 | 2d | 1 | 1.28mi |
| 1505 N Tuxedo St Unit 1507 Indianapolis, IN | 2.0 | 1.0 | 1000 | $1,100 | $1.10 | 44d | 1 | 1.28mi |
| 1644 Doctor Andrew J Brown Ave Unit A&B Indianapolis, IN | 1.0 | 1.0 | 550 | $1,300 | $2.36 | 44d | 1 | 1.28mi |
| 1315 N Rural St Indianapolis, IN | 1.0 | 1.0 | 700 | $1,000 | $1.43 | 4d | 1 | 1.31mi |
Listing history 8 events
-
2026-06-18days on market $90,000 Active 10 DOM
-
2026-06-17days on market $90,000 Active 9 DOM
-
2026-06-16days on market $90,000 Active 8 DOM
-
2026-06-15days on market $90,000 Active 7 DOM
-
2026-06-13days on market $90,000 Active 5 DOM
-
2026-06-13days on market $90,000 Active 4 DOM
-
2026-06-08remarks 625-char remark
-
2026-06-08$90,000 Active 1 DOM
ⓘ Source: listings_history table (triggers on properties + properties_extension) + one-shot
backfill from property_details.listing_events for pre-trigger history.
Tax reassessment forecast IN · Partial reset (capped growth)
- Current annual tax
- $1,433 · $119/mo
- Projected year-2 tax
- $1,433 · $119/mo
- Expected delta
- $0/yr ($0/mo · 0.0%)
ⓘ Screening estimate from a state-policy table — verify with the county assessor before closing.
Climate risk First Street
- Flood 1/10 Low FEMA zone X (unshaded) · 0% chance over 30 yrs
- Wildfire 1/10 Low
- Heat 3/10 Moderate 7 d/yr ≥102°F today · 19 d/yr by 30 yrs out
- Wind 2/10 Low 0% chance of damaging wind over 30 yrs
- Air quality 4/10 Moderate 5 unhealthy d/yr today · 7 by 30 yrs out
Nearby sold comps map
Loading sold comps map…
Walkable amenities ~0.75 mi
Loading nearby amenities…
Taxation est. · year 1
- Rental income
- $12,388
- − Mortgage interest
- −$5,041
- − Property taxes
- −$1,433
- − Insurance
- −$450
- − Repairs & maintenance
- −$991
- − Management
- −$991
- − Depreciation
- −$2,618
- Taxable income
- $864
- Est. tax owed @ 24.0%
- −$207
- After-tax cash flow
- $2,033/yr
For passive investors: Depreciation is non-cash, so a rental often shows a tax loss while cash-flowing — sheltering income. Rental losses are passive: they offset passive income freely, and up to $25,000/yr can offset ordinary (W-2) income if you actively participate and your MAGI is under $100k (phasing out to $0 by $150k); unused losses carry forward. On sale, claimed depreciation is recaptured at up to 25%, and gains may owe capital-gains tax (a 1031 exchange can defer both). Figures are a year-1 estimate at your 24.0% rate — not tax advice; consult a CPA.
Schools (NCES district)
- District
- Indianapolis Public Schools
- NCES district ID
- 1804770
- Math proficiency
- 14% ▼ -7.00%
- Reading proficiency
- 20% ▼ -3.00%
- Median HH income
- $32,034
- Composite
- 13.69/100
- National rank
- #9499
- State rank
- #286 of 301 in IN
Livability — Indianapolis city (balance)
No livability data for this city. (Only ~50 U.S. cities are tracked.)
Census & demographics
- Census place
- Indianapolis city (balance), IN
- County
- Marion County · 998,460 people
- City population
- 881,119
- Metro
- Indianapolis-Carmel-Anderson, IN
- Population (ZIP)
- 29,360
- Household income
- $38,063
- Rent vs Own
- Severe rent burden
- 2340.0
Population outlook (Marion County) Hauer SSP2
- Today (2025)
- 1,025,572 people
- By 2030
- 1,065,727 · +3.9%
- By 2040
- 1,141,577 · +11.3%
- By 2050
- 1,208,920 · +17.9%
- By 2075
- 1,367,288 · +33.3%
- By 2100
- 1,438,201 · +40.2%
Race, ethnicity, and origin ACS 2023
- Neighborhood character
- Predominantly Black (68%)
- Race & ethnicity
- Black 68% White 18% Hispanic / Latino 9% Two or more races 6%
- Hispanic origin (detail)
- Mexican 6%
- Common ancestry
- Romanian 1%
- Foreign-born
- 5% · Canada, Philippines
- Languages at home
- 92% English-only · Spanish 7%
Political lean MEDSL · Marion
- 2024 margin
- Strong D (+27.7) · D 63.0% · R 35.3% · Other 1.7%
- 2008→2024 swing
- -0.7pp no change · 2008: 28.4pp · 2024: 27.7pp
- All cycles
- 2024: D+27.7 2020: D+29.1 2016: D+22.8 2012: D+22.2 2008: D+28.4
Not yet ingested
- Civics
- —
Market trends
- HPI YoY
- ▼ -81.57%
- Current HPI
- 395.7071
- Rent YoY
- ▲ 0.81%
- Metro
- Indianapolis-Carmel-Anderson, IN
- State GDP YoY
- ▲ 2.90%
- F500 in state
- 18
Industry mix (Fortune 500 HQ in IN)
| Industry | F500 HQs | Revenue |
|---|---|---|
| Industrial Machinery | 2 | $37B |
|
||
| Healthcare | 1 | $177B |
|
||
| Pharmaceuticals | 1 | $45B |
|
||
| Metals / Steel | 1 | $18B |
|
||
| Agriculture | 1 | $17B |
|
||
| Packaging | 1 | $12B |
|
||
Price history
-14.3% since first listed12 events — show timeline
- 2026-06-08 Listed $90,000 MIBOR as Distributed by MLS Grid
- 2026-05-01 Listing Removed — MIBOR as Distributed by MLS Grid
- 2025-08-27 Price Changed $100,000 MIBOR as Distributed by MLS Grid
- 2025-07-23 Relisted — MIBOR as Distributed by MLS Grid
- 2025-07-14 Pending — MIBOR as Distributed by MLS Grid
- 2025-06-04 Price Changed $115,000 MIBOR as Distributed by MLS Grid
- 2025-05-12 Listed $125,000 MIBOR as Distributed by MLS Grid
- 2025-03-18 Listing Removed — MIBOR as Distributed by MLS Grid
- 2025-02-20 Relisted — MIBOR as Distributed by MLS Grid
- 2024-11-19 Pending — MIBOR as Distributed by MLS Grid
- 2024-10-22 Price Changed $90,000 MIBOR as Distributed by MLS Grid
- 2024-09-23 Listed $105,000 MIBOR as Distributed by MLS Grid
Property tax history
+17.3%/yrLatest (2025): $1,433 · +7.3% YoY. Source: county tax records.
Cash-flow waterfall
monthlySold comps — $/sqft
last 12 mo · ≤1 miLoading sold comps…