5353 Richmond Ave #4 · Houston, TX
Flood risk 7/10 · Major
- FEMA flood zone
- X (unshaded)
- Chance of flooding over 30 yrs
- 0.99%
- Est. flood insurance / yr
- $507 – $1,088
Fire risk 1/10 · Minimal
- Est. fire insurance / yr
- $1,222 – $2,270
Heat risk 9/10 · Severe
- Hot days now (above 109°F)
- 7 days/yr
- Hot days in 30 yrs
- 25 days/yr
Wind risk 9/10 · Severe
- Chance of severe wind over 30 yrs
- 99.0%
Air-quality risk 2/10 · Minimal
- Unhealthy air days now
- 2 days/yr
- Unhealthy air days in 30 yrs
- 2 days/yr
Risk factors via First Street. Map © Google.
Why this score? — see what drove the D grade
The composite is a weighted blend of 9 inputs, each scored 0–100. Each bar is that input's sub-score; the figure is the points it added to the 100-point composite (weight × sub-score).
- ARV discount +15.0/15.0
- 1% rule +9.3/10.0
- Cash flow +7.2/30.0
- Livability +3.7/5.0
- Schools +2.7/10.0
- Condition / age +2.5/5.0
- Rent growth +2.1/5.0
- DSCR +1.4/10.0
- Appreciation +0.0/10.0
$89,000
🖨 Deal sheet 📄 Offer letter ✓ Due diligence
Listing remarks MLS
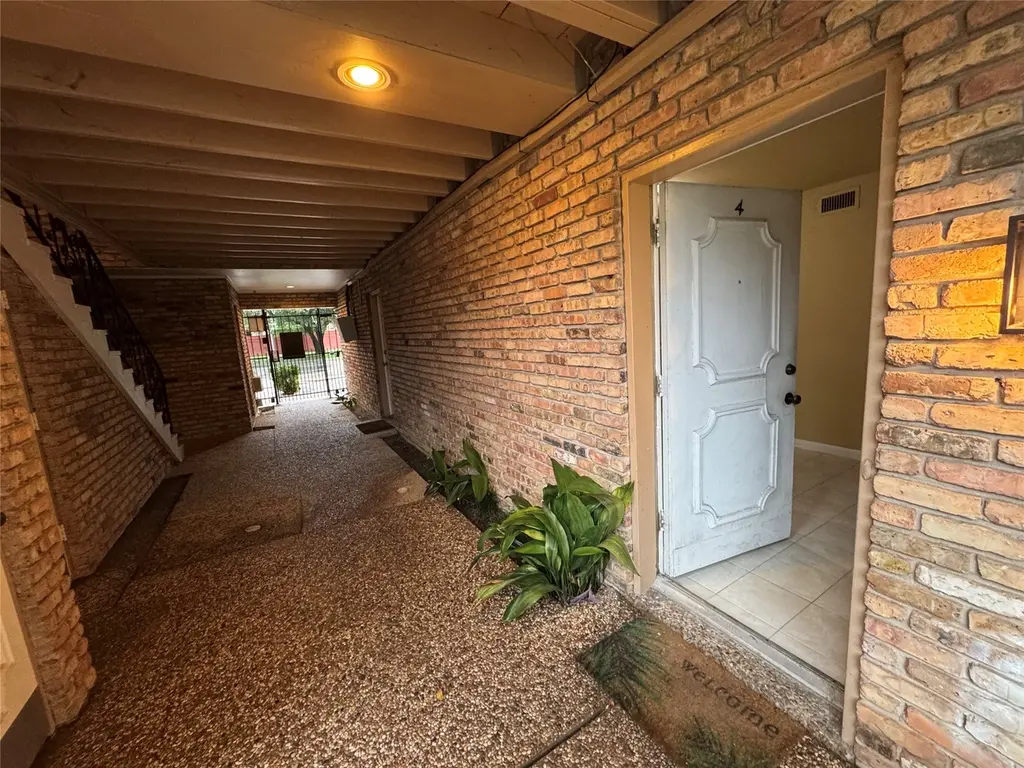
Updated unit: stainless steel appliances, granite counter tops, new ceramic tiles throughout, updated chrome fixtures. HOA fees include all utilities. Great central location. Ideal for new buyer and/or investor.
Key facts
- Remodeled bathroom
- Pool facing
- Tile flooring
Tags
Property features AI
Finance
- HOA & community: Association managed by pmg management; Monthly association fee of $446; Association covers common areas, cable TV, electricity, structure maintenance, sewer, utilities, and water; Community pool
Exterior
- Parking: Detached carport; Assigned parking; 1 carport space
- Security: Gated community
- Utilities: Public water; Public sewer
- Home design: Residential property; Single-story; Built in 1965; Slab foundation
- Construction: Brick, stone, and wood siding construction
- Exterior features: Composition roof; Large lot (approx. 93,606 sq ft)
Interior
- Kitchen: Dishwasher; Electric range; Garbage disposal; Granite counters
- Bedrooms: Primary bedroom on first floor (approx. 14 x 13)
- Bathrooms: 1 full bathroom
- Heating & cooling: Central heating (electric); Central air conditioning (electric)
- Interior features: Granite counters; Seller disclosure available
- Laundry & utility: Washer; Dryer
Neighborhood map
What this means for you Summary
Snapshot
- This is a 1-bed/1.0-bath condo listed at $89k.
Deal economics
- At list price, monthly cash flow is $-189 ($-2k/yr) — negative.
- To cash-flow at today's rent, offer at most $56k (37.4% below list).
- Meets the 1% rule at list price ($1k rent vs $89k).
- Recommended offer: $56k (37.4% below list) — sets the bar for cash-flow.
- Cap rate 4.6% vs local median 3.2% in Houston — top-decile yield for the area; either an underpriced asset or a hidden risk that comps aren't pricing in. Stress-test before assuming the spread holds.
Location & tenants
- Location reads 74/100 on livability (#184 in TX, #4,771 nationally) — a middle-class / working-renter tenant base. Strengths: amenities A+, cost of living A+, housing A+; Watch: crime F.
- Houston ISD (urban): math 27% / reading 35% proficiency, ranked #593 of 826 in TX (top 72%) — families likely to look elsewhere, expect single-tenant / working-renter base with shorter leases; 71% free/reduced lunch — lower-income household profile, screen leases tightly.
- Zoned schools: School At St George Place (math 34% / reading 46%, grade F, #1,514 of 4,322 statewide, top 36%, 782 students, 55% FRL); Tanglewood Middle (math 29% / reading 42%, grade F, #827 of 1,662 statewide, top 51%, 808 students, 62% FRL); Wisdom H S (math 17% / reading 16%, grade F, #1,497 of 1,632 statewide, top 92%, 2,260 students, 97% FRL) — zoned schools at 71% FRL track the district average.
- Market conditions: Rents soft (-1.7%/yr); 313 active listings in the ZIP; 40 comparable units currently listed for rent nearby; rentals leasing fast (median 8d on market — plan ~1-2 weeks tenant-placement turnaround); solid renter incomes; 29,883 units permitted in Harris County in 2024 (8,621 in 5+ unit buildings).
- This rent is only 16% of the median local income ($93k/yr) — well below the 30% rent-burden line; pricing power to push rent on renewal without tenant pushback.
Forward outlook
- Local home prices are declining (-3.0%/yr); year-one equity from $615 of loan paydown is wiped out by about $3k of value loss. Plan a longer hold.
- Harris County population projected at +47% by 2050 — long-run rental-demand tailwind backs the buy-and-hold thesis.
Negotiation context
- It's been on market 48 days — a 3% lower offer ($86k) is reasonable based on typical stale-listing flexibility.
- 4 sale attempts since 20y ago; this cycle's ask has dropped $6k (6%) from the opening price — seller is motivated, your offer sets the floor, not the list.
Risks & watch-outs
- Watch-outs: flood insurance adds $66/mo; HOA is 35% of rent.
- Climate carrying-cost: major flood risk; severe wind risk, 99% chance of damaging wind over 30y; extreme-heat days projected 7→25/yr by 2055 (HVAC capex compounding) — expect insurance premiums to compound above CPI over the hold.
Questions for the listing agent
- What do current leases actually rent for vs. the listed asking? Can we see a recent rent roll and the last 12 months of T-12 income?
- It's been on market 48 days. Have you received any prior offers? Is the seller open to a 37% concession, seller financing, or rate buy-down credit?
- Built in 1965 — when were the roof, HVAC, electrical panel, plumbing, and water heater last replaced?
- What's the actual annual flood-insurance premium (NFIP or private), and is the property in a SFHA with mandatory coverage?
- What does the HOA fee cover, when was the last increase, and are there any pending special assessments or reserve-fund shortfalls?
- Any open or pending special assessments — roof, HVAC, plumbing, elevator, façade? What's the per-unit balance and payoff schedule, and is the seller paying it off at close or rolling it to the buyer?
- Is there a deadline driving the sale (1031 exchange, divorce, estate, relocation)? That informs how much negotiation room exists.
- Schools are D-rated, which usually means shorter tenancies and higher turnover. Who's the typical renter profile here, and what's been the actual vacancy rate?
- Crime grade is F in this area — have there been break-ins, vandalism, or insurance claims at this property in the last 3 years? What carrier currently insures it and at what premium?
- The area grade is low — what's the realistic commute time and amenity access for the typical tenant pool here? Any planned neighborhood developments (good or bad) we should know about?
- What's the average days-on-market for RENTAL listings here right now (not sales)? A rising rental-DOM trend means longer vacancies and softer asking-rent achievability than the comps imply.
- What's the recent tenant-quality profile in this submarket — average credit score on applications, eviction rate, late-payment / NSF rate, and stable-employment percentage? A property-management company in the area should have these aggregated.
- How much new apartment / multifamily construction is in the pipeline within 1–3 miles? Heavy new supply (>2% of stock underway) typically softens rents 12–24 months out; light construction supports rent growth.
Investment metrics
- 1% rule
- 1.43% ✓
- Cap rate
- 4.65%
- Cash-on-cash
- -5.88%
- DSCR
- 0.74
- GRM
- 5.8
CMA / ARV
- ARV (median comp)
- $116,723
- List price
- $89,000
- Delta
- -23.75%
- Verdict
- UNDERPRICED
- Comps
- 20 within 1.0 mi
Projected returns pro-forma
-3.0% appreciation · 0.0% rent growth · sell at horizon
- IRR
- -39.9%
- Equity multiple
- -0.20×
- Total profit
- $-29,784
- Equity at exit
- $13,270
- IRR
- —
- Equity multiple
- -1.18×
- Total profit
- $-54,276
- Equity at exit
- $7,695
Cash invested: $24,920 (down + closing). Projections, not guarantees.
Landlord ↔ Tenant lean methodology
- Overall (STATE)
- 87 Strongly Landlord-Friendly
- State Texas
- 87 Strongly Landlord-Friendly · R+5
- County
- — inherits STATE
- City
- — inherits STATE
ZIP-level market 77056
- Rents YoY
- -1.7%
- Active inventory
- 313
- Price-to-rent
- 5.8×
Monthly cashflow live
- Estimated rent
- $1,271 high interval (Pro) →
- Mortgage (P&I)
- −$467
- Tax from tax record
- −$176 /mo · $2,115/yr
- Insurance
- −$37
- Flood insurance flood zone
- −$66 /mo · $798/yr
- HOA
- −$446
- Vacancy / Maint / Mgmt
- −$267
- Net cashflow
- $-189
Break-even live
UW: 25.0% down · 7.5% · 30yr · 1.5% tax · 5.0% vac · 8.0% maint · 8.0% mgmt
Financing live
Cash to close
- Down payment
- $22,250
- Closing costs
- $2,670
- Reserves months
- —
- Total cash needed
- —
Loan-product check · same deal, 3 products live
Conventional
25% down · 7.5% · 30yr
- Down + closing
- —
- Monthly P&I
- —
- Monthly cashflow
- —
- DSCR
- —
- Eligible?
- —
Personal DTI + credit; lowest rate.
DSCR
20% down · 8.5% · 30yr
- Down + closing
- —
- Monthly P&I
- —
- Monthly cashflow
- —
- DSCR
- —
- Eligible?
- —
No personal income docs; deal must DSCR.
Hard money
10% down · 12.0% · 12mo
- Down + closing
- —
- Monthly P&I
- —
- Monthly cashflow
- —
- DSCR
- —
- Eligible?
- —
Short-term bridge; refi at stabilization.
Rent comps 40 comps
| Address | Beds | Baths | Sqft | Rent | $/sqft | DOM | Units | Dist |
|---|---|---|---|---|---|---|---|---|
| 5331 Beverly Hill St Houston, TX | 1.0–4.0 | 1.0–2.5 | 1370 | $866 | $0.63 | 2d | 84 | 0.08mi |
| 5333 Richmond Ave #3 Houston, TX | 1.0 | 1.0 | 686 | $949 | $1.38 | 24d | 1 | 0.09mi |
| 5333 Richmond Ave #23 Houston, TX | 1.0 | 1.0 | 678 | $1,699 | $2.51 | 43d | 1 | 0.09mi |
| 5455 Richmond Ave Unit 5455-1092 Houston, TX | 1.0 | 2.0 | 654 | $1,150 | $1.76 | 24d | 1 | 0.11mi |
| 5455 Richmond Ave Houston, TX | 1.0–2.0 | 1.0–2.0 | 943 | $1,095 | $1.16 | 2d | 20 | 0.12mi |
| 3099 Yorktown St Houston, TX | 1.0 | 1.0 | 699 | $1,299 | $1.86 | 18d | 1 | 0.29mi |
| 3300 Sage Rd Houston, TX | 1.0–2.0 | 1.0–2.0 | 891 | $1,274 | $1.43 | 2d | 33 | 0.31mi |
| 5151 Richmond Ave Unit 5225 Houston, TX | 1.0 | 1.0 | 630 | $1,069 | $1.70 | 11d | 1 | 0.35mi |
| 5151 Richmond Ave Unit 1165 Houston, TX | 1.0 | 1.0 | 630 | $1,027 | $1.63 | 3d | 1 | 0.36mi |
| 5151 Richmond Ave Houston, TX | 1.0 | 1.0 | 630 | $1,019 | $1.62 | 12d | 1 | 0.36mi |
| 5151 Richmond Ave Unit 324 Houston, TX | 1.0 | 1.0 | 630 | $1,030 | $1.63 | 7d | 1 | 0.36mi |
| 5151 Richmond Ave Unit 5172 Houston, TX | 1.0 | 1.0 | 630 | $1,087 | $1.73 | 14d | 1 | 0.36mi |
| 3360 McCue Rd Houston, TX | 1.0–2.0 | 1.0–2.5 | 902 | $1,745 | $1.93 | 3d | 37 | 0.39mi |
| 3055 Sage Rd Ste 130 Houston, TX | 1.0 | 1.0 | 627 | $1,047 | $1.67 | 24d | 1 | 0.40mi |
| 5195 Hidalgo St Houston, TX | 1.0 | 1.0 | 685 | $1,420 | $2.07 | 24d | 1 | 0.40mi |
| 3323 McCue Rd Houston, TX | 1.0–3.0 | 1.0–2.0 | 1029 | $1,093 | $1.06 | 1d | 45 | 0.43mi |
| 5151 Hidalgo St Houston, TX | 1.0–2.0 | 1.0–2.0 | 923 | $1,393 | $1.51 | 7d | 3 | 0.44mi |
| 5151 Hidalgo St Unit 5193 Houston, TX | 1.0 | 1.0 | 578 | $1,402 | $2.43 | 11d | 1 | 0.44mi |
| 5151 Hidalgo St Unit 5166 Houston, TX | 1.0 | 1.0 | 625 | $1,432 | $2.29 | 11d | 1 | 0.44mi |
| 5151 Hidalgo St Unit 1187 Houston, TX | 1.0 | 1.0 | 625 | $1,390 | $2.22 | 3d | 1 | 0.44mi |
| 5151 Hidalgo St Unit 1162 Houston, TX | 1.0 | 1.0 | 625 | $1,393 | $2.23 | 5d | 1 | 0.44mi |
| 5151 Hidalgo St Unit 5166 Houston, TX | 1.0 | 1.0 | 627 | $1,350 | $2.15 | 15d | 1 | 0.44mi |
| 6061 Beverly Hills Walk Houston, TX | 1.0–2.0 | 1.0–2.0 | 971 | $895 | $0.92 | 2d | 62 | 0.46mi |
| 3363 McCue Rd Houston, TX | 1.0–3.0 | 1.0–2.0 | 1026 | $1,170 | $1.14 | 2d | 18 | 0.47mi |
| 5151 Hidalgo St Unit 165 Houston, TX | 1.0 | 1.0 | 578 | $1,370 | $2.37 | 3d | 1 | 0.49mi |
| 5192 Hidalgo St Houston, TX | 1.0 | 1.0 | 706 | $1,065 | $1.51 | 24d | 1 | 0.52mi |
| 5199 Alabama St Houston, TX | 1.0 | 1.0 | 745 | $1,793 | $2.41 | 12d | 1 | 0.55mi |
| 5510 S Rice Ave Houston, TX | 1.0 | 1.0 | 638 | $1,039 | $1.63 | 12d | 1 | 0.56mi |
| 2687 Yorktown St Houston, TX | 1.0 | 1.0 | 742 | $1,237 | $1.67 | 24d | 1 | 0.56mi |
| 5510 S Rice Ave Unit 5531 Houston, TX | 1.0 | 1.0 | 638 | $1,130 | $1.77 | 14d | 1 | 0.56mi |
| 5510 S Rice Ave Unit 325 Houston, TX | 1.0 | 1.0 | 638 | $1,047 | $1.64 | 3d | 1 | 0.56mi |
| 5510 S Rice Ave Unit 324 Houston, TX | 1.0 | 1.0 | 638 | $1,050 | $1.65 | 7d | 1 | 0.56mi |
| 5510 S Rice Ave Unit 1162 Houston, TX | 1.0 | 1.0 | 638 | $1,050 | $1.65 | 5d | 1 | 0.56mi |
| 5510 S Rice Ave Unit 5584 Houston, TX | 1.0 | 1.0 | 638 | $1,089 | $1.71 | 11d | 1 | 0.56mi |
| 5510 S Rice Ave Unit 1047 Houston, TX | 1.0 | 1.0 | 638 | $1,090 | $1.71 | 11d | 1 | 0.59mi |
| 5401 Chimney Rock Rd Houston, TX | 1.0–2.0 | 1.0–2.0 | 827 | $804 | $0.97 | 2d | 10 | 0.60mi |
| 3100 Post Oak Blvd Houston, TX | 2.0 | 1.0–2.0 | 971 | $2,026 | $2.09 | 2d | 24 | 0.63mi |
| 2801 Waterwall Dr Houston, TX | 1.0–2.0 | 1.0–2.0 | 1080 | $1,572 | $1.45 | 1d | 22 | 0.64mi |
| 5500 El Camino Del Rey St Houston, TX | 3.0 | 1.0–2.5 | 890 | $888 | $1.00 | 1d | 24 | 0.70mi |
| 5250 Brownway St Houston, TX | 2.0 | 1.0–2.0 | 903 | $2,218 | $2.46 | 2d | 39 | 0.72mi |
HOA detail condo
- Monthly dues
- $446 · $5,352/yr
- Assessments
- None detected in remarks — confirm with the listing agent.
Listing history 24 events
-
2026-06-18days on market $89,000 Active 48 DOM
-
2026-06-17days on market $89,000 Active 47 DOM
-
2026-06-16days on market $89,000 Active 46 DOM
-
2026-06-16price $89,000 Active 45 DOM
-
2026-06-15days on market $95,000 Active 45 DOM
-
2026-06-13days on market $95,000 Active 43 DOM
-
2026-06-10days on market $95,000 Active 39 DOM
-
2026-06-08days on market $95,000 Active 38 DOM
-
2026-06-07days on market $95,000 Active 37 DOM
-
2026-06-04days on market $95,000 Active 34 DOM
-
2026-06-01days on market $95,000 Active 31 DOM
-
2026-05-31days on market $95,000 Active 30 DOM
-
2026-05-01$95,000 Active 188-char remark
-
2010-02-26soldstatus
-
2010-02-26soldstatus
-
2010-02-24soldstatus 213-char remark
Show marketing remark (213 chars)
Updated unit: stainless steel appliances, granite counter tops, new ceramic tiles throughout, updated chrome fixtures. HOA fees include all utilities. Great central location. Ideal for new buyer and/or investor.
-
2009-10-21historical 213-char remark
Show marketing remark (213 chars)
Updated unit: stainless steel appliances, granite counter tops, new ceramic tiles throughout, updated chrome fixtures. HOA fees include all utilities. Great central location. Ideal for new buyer and/or investor.
-
2009-04-18$60,500 213-char remark
Show marketing remark (213 chars)
Updated unit: stainless steel appliances, granite counter tops, new ceramic tiles throughout, updated chrome fixtures. HOA fees include all utilities. Great central location. Ideal for new buyer and/or investor.
-
2007-10-03soldstatus
-
2007-09-29historical
-
2007-09-17$49,900
-
2006-08-01historical
-
2006-07-05$49,900
-
1990-06-14soldstatus
ⓘ Source: listings_history table (triggers on properties + properties_extension) + one-shot
backfill from property_details.listing_events for pre-trigger history.
Tax reassessment forecast TX · Resets to sale price
- Current annual tax
- $2,115 · $176/mo
- Projected year-2 tax
- $2,115 · $176/mo
- Expected delta
- $0/yr ($0/mo · 0.0%)
ⓘ Screening estimate from a state-policy table — verify with the county assessor before closing.
Climate risk First Street
- Flood 7/10 Severe FEMA zone X (unshaded) · 99% chance over 30 yrs
- Wildfire 1/10 Low
- Heat 9/10 Extreme 7 d/yr ≥109°F today · 25 d/yr by 30 yrs out
- Wind 9/10 Extreme 99% chance of damaging wind over 30 yrs
- Air quality 2/10 Low 2 unhealthy d/yr today · 2 by 30 yrs out
Nearby sold comps map
Loading sold comps map…
Walkable amenities ~0.75 mi
Loading nearby amenities…
Taxation est. · year 1
- Rental income
- $15,249
- − Mortgage interest
- −$4,985
- − Property taxes
- −$2,115
- − Insurance
- −$1,242
- − Repairs & maintenance
- −$1,220
- − Management
- −$1,220
- − HOA
- −$5,352
- − Depreciation
- −$2,589
- Taxable loss
- −$3,475
- Est. tax savings @ 24.0%
- +$834
- After-tax cash flow
- $-1,429/yr
For passive investors: Depreciation is non-cash, so a rental often shows a tax loss while cash-flowing — sheltering income. Rental losses are passive: they offset passive income freely, and up to $25,000/yr can offset ordinary (W-2) income if you actively participate and your MAGI is under $100k (phasing out to $0 by $150k); unused losses carry forward. On sale, claimed depreciation is recaptured at up to 25%, and gains may owe capital-gains tax (a 1031 exchange can defer both). Figures are a year-1 estimate at your 24.0% rate — not tax advice; consult a CPA.
Schools (NCES district)
- District
- Houston ISD
- NCES district ID
- 4823640
- Math proficiency
- 27% ▼ -18.00%
- Reading proficiency
- 35% ▼ -6.00%
- Median HH income
- $46,054
- Composite
- 26.63/100
- National rank
- #7173
- State rank
- #593 of 826 in TX
Livability — Houston
- Score
- 74/100
- State rank
- #184
- US rank
- #4771
Category grades
Schools grade is shown separately in the Schools card above.
Census & demographics
- Census place
- Houston, TX
- County
- Harris County · 4,702,590 people
- City population
- 3,226,434
- Metro
- Houston-The Woodlands-Sugar Land, TX
- Population (ZIP)
- 22,877
- Household income
- $93,499
- Rent vs Own
- Severe rent burden
- 2132.0
Population outlook (Harris County) Hauer SSP2
- Today (2025)
- 5,571,493 people
- By 2030
- 6,089,821 · +9.3%
- By 2040
- 7,142,806 · +28.2%
- By 2050
- 8,185,864 · +46.9%
- By 2075
- 10,574,329 · +89.8%
- By 2100
- 12,109,958 · +117.4%
Race, ethnicity, and origin ACS 2023
- Neighborhood character
- Diverse neighborhood (Simpson 0.64)
- Race & ethnicity
- White 54% Hispanic / Latino 22% Asian 14% Two or more races 13% Black 8%
- Hispanic origin (detail)
- Mexican 11% Puerto Rican 1% Salvadoran 1%
- Common ancestry
- Lithuanian 3% Slovak 2% Italian 2%
- Foreign-born
- 29% · Canada, Jamaica, China
- Languages at home
- 60% English-only · Spanish 20% Other Indo-European 7% Other Asian/Pacific 2%
Political lean MEDSL · Harris
- 2024 margin
- Lean D (+5.5) · D 52.0% · R 46.4% · Other 1.6%
- 2008→2024 swing
- +3.9pp toward D · 2008: 1.6pp · 2024: 5.5pp
- All cycles
- 2024: D+5.5 2020: D+13.3 2016: D+12.4 2012: D+0.1 2008: D+1.6
Not yet ingested
- Civics
- —
Market trends
- HPI YoY
- ▼ -127.46%
- Current HPI
- 175.1726
- Rent YoY
- ▼ -1.70%
- Metro
- Houston-The Woodlands-Sugar Land, TX
- State GDP YoY
- ▲ 3.95%
- F500 in state
- 110
Industry mix (Fortune 500 HQ in TX)
| Industry | F500 HQs | Revenue |
|---|---|---|
| Energy | 16 | $1,198B |
|
||
| Technology | 5 | $198B |
|
||
| Engineering / Construction | 4 | $72B |
|
||
| Energy Services | 3 | $60B |
|
||
| Utilities | 3 | $41B |
|
||
| Healthcare | 2 | $330B |
|
||
Price history
+78.4% since first listed13 events — show timeline
- 2026-06-15 Price Changed $89,000 HARMLS
- 2026-05-01 Listed $95,000 HARMLS
- 2010-02-26 Sold (Public Records) — Public Records
- 2010-02-26 Sold (Public Records) — Public Records
- 2010-02-24 Sold (MLS) — HARMLS
- 2009-10-21 Listing Removed — HARMLS
- 2009-04-18 Listed $60,500 HARMLS
- 2007-10-03 Sold (Public Records) — Public Records
- 2007-09-29 Listing Removed — HARMLS
- 2007-09-17 Listed $49,900 HARMLS
- 2006-08-01 Listing Removed — HARMLS
- 2006-07-05 Listed $49,900 HARMLS
- 1990-06-14 Sold (Public Records) — Public Records
Property tax history
+3.0%/yrLatest (2025): $2,115 · +1.6% YoY. Source: county tax records.
Cash-flow waterfall
monthlySold comps — $/sqft
last 12 mo · ≤1 miLoading sold comps…