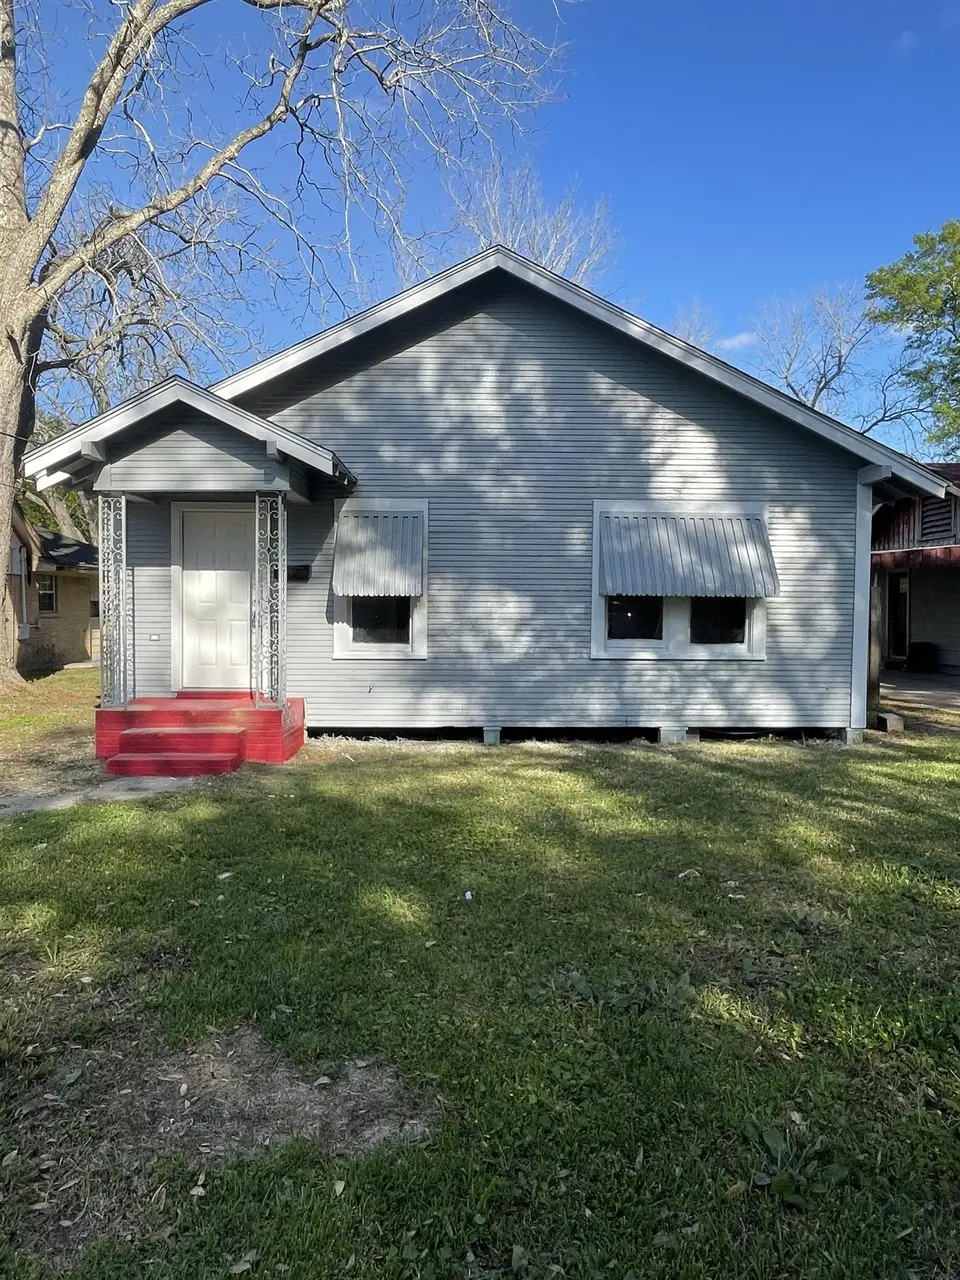
5135 Irving St · Beaumont, TX
Flood risk 1/10 · Minimal
- FEMA flood zone
- X
- Chance of flooding over 30 yrs
- 0.0%
- Est. flood insurance / yr
- $507 – $1,088
Fire risk 2/10 · Minimal
- Est. fire insurance / yr
- $1,222 – $2,270
Heat risk 9/10 · Severe
- Hot days now (above 109°F)
- 7 days/yr
- Hot days in 30 yrs
- 24 days/yr
Wind risk 9/10 · Severe
- Chance of severe wind over 30 yrs
- 99.0%
Air-quality risk 2/10 · Minimal
- Unhealthy air days now
- 1 days/yr
- Unhealthy air days in 30 yrs
- 1 days/yr
Risk factors via First Street. Map © Google.
Why this score? — see what drove the C grade
The composite is a weighted blend of 9 inputs, each scored 0–100. Each bar is that input's sub-score; the figure is the points it added to the 100-point composite (weight × sub-score).
- Cash flow +30.0/30.0
- DSCR +10.0/10.0
- 1% rule +9.8/10.0
- Livability +3.2/5.0
- Rent growth +2.5/5.0
- Condition / age +2.5/5.0
- Schools +1.5/10.0
- ARV discount +0.0/15.0
- Appreciation +0.0/10.0
$74,900
🖨 Deal sheet (PDF) 📄 Offer letter ✓ Due diligence
Key facts
- 7,000 sq ft lot
- Built 1962
- Listed 43 days
Property features AI
Finance
- Other: Municipal Utility District disclosure available; Lease not considered
Exterior
- Parking: No parking
- Utilities: Public water; Public sewer
- Home design: Residential property; Built in 1962; Single-level living area of 1,188
- Construction: Wood siding exterior; Composition roof; Pillar/post/pier foundation
- Exterior features: Cleared lot; Asphalt road frontage
Interior
- Bedrooms: Space for 3 bedrooms
- Bathrooms: 1 full bathroom
- Heating & cooling: Central heating (electric); Central air conditioning (electric)
- Interior features: Total of 4 rooms
Neighborhood map
What this means for you Summary
Snapshot
- This is a 3-bed/1.0-bath single-family listed at $75k.
Deal economics
- At list price, monthly cash flow is $334 ($4k/yr) — positive.
- The deal already cash-flows at list — no discount required.
- Meets the 1% rule at list price ($1k rent vs $75k).
- Recommended offer: $73k (3.0% below list) — sets the bar for market timing.
- Cap rate 11.6% vs local median 5.3% in Beaumont — top-decile yield for the area; either an underpriced asset or a hidden risk that comps aren't pricing in. Stress-test before assuming the spread holds.
Location & tenants
- Location reads 64/100 on livability (#739 in TX) — a middle-class / working-renter tenant base. Strengths: cost of living A+, housing A+, health & safety A+; Watch: employment D, crime F, amenities F.
- Beaumont ISD (urban): math 14% / reading 22% proficiency, ranked #789 of 826 in TX (top 96%) — low school quality limits family demand, transient renter base, plan for 1-2y turnover; 69% free/reduced lunch — lower-income household profile, screen leases tightly.
- Zoned schools: Blanchette El (math 6% / reading 12%, grade F, #4,293 of 4,322 statewide, top 99%, 568 students, 96% FRL) — zoned schools average 96% FRL vs 69% district-wide (27 pts higher); higher-poverty schools than district average — tighter screening recommended.
- Market conditions: 206 active listings in the ZIP; 12 comparable units currently listed for rent nearby; rentals at typical pace (median 25d on market — plan ~3-4 weeks tenant-placement turnaround); 42% of comp listings sitting > 30 days — soft ceiling on asking rent; 343 units permitted in Jefferson County in 2024 (0 in 5+ unit buildings).
Forward outlook
- Local home prices are declining (-3.0%/yr); year-one equity from $518 of loan paydown is wiped out by about $2k of value loss. Plan a longer hold.
- At projected returns (-3.0% appreciation + 3.0% rent growth), your $21k cash investment doubles in ~7 years — after that, you're playing with house money.
Negotiation context
- It's been on market 43 days — a 3% lower offer ($73k) is reasonable based on typical stale-listing flexibility.
Risks & watch-outs
- Climate carrying-cost: severe wind risk, 99% chance of damaging wind over 30y; extreme-heat days projected 7→24/yr by 2055 (HVAC capex compounding) — expect insurance premiums to compound above CPI over the hold.
Questions for the listing agent
- It's been on market 43 days. Have you received any prior offers? Is the seller open to a 3% concession, seller financing, or rate buy-down credit?
- Built in 1962 — when were the roof, HVAC, electrical panel, plumbing, and water heater last replaced?
- Is there a deadline driving the sale (1031 exchange, divorce, estate, relocation)? That informs how much negotiation room exists.
- Schools are D-rated, which usually means shorter tenancies and higher turnover. Who's the typical renter profile here, and what's been the actual vacancy rate?
- Crime grade is F in this area — have there been break-ins, vandalism, or insurance claims at this property in the last 3 years? What carrier currently insures it and at what premium?
- What's the average days-on-market for RENTAL listings here right now (not sales)? A rising rental-DOM trend means longer vacancies and softer asking-rent achievability than the comps imply.
- What's the recent tenant-quality profile in this submarket — average credit score on applications, eviction rate, late-payment / NSF rate, and stable-employment percentage? A property-management company in the area should have these aggregated.
- How much new for-sale + rental construction is in the pipeline within 1–3 miles? Heavy new supply typically softens prices + rents 12–24 months out; constrained supply supports both.
Investment metrics
- 1% rule
- 1.48% ✓
- Cap rate
- 11.65%
- Cash-on-cash
- 19.12%
- DSCR
- 1.85
- GRM
- 5.6
CMA / ARV
- ARV (median comp)
- $62,450
- List price
- $74,900
- Delta
- 19.94%
- Verdict
- OVERPRICED
- Comps
- 20 within 1.0 mi
Show comp detail 4 sales within ~0.75 mi
| Address | Dist | Beds/Ba | Sqft | Sold | Price | $/sf | Match |
|---|---|---|---|---|---|---|---|
| 4995 Highland Ave | 0.10mi | 2/1.0 (-1) | 1,112 (-6%) | 2mo | $65,000 | $58 | 78 |
| 795 Highland Dr | 0.24mi | 3/1.0 | 1,183 (-0%) | 20mo | $89,900 | $76 | 71 |
| 1050 Boyd St | 0.44mi | 3/1.0 | 1,316 (+11%) | 2mo | $109,000 | $83 | 60 |
| 468 Alabama | 0.36mi | 3/1.0 | 1,075 (-10%) | 10mo | $54,900 | $51 | 59 |
Match score weights: distance 35% · size 25% · config 20% · recency 20%. Top-matched comps best support the ARV.
Projected returns pro-forma
-3.0% appreciation · 3.0% rent growth · sell at horizon
- IRR
- 11.0%
- Equity multiple
- 1.44×
- Total profit
- $9,175
- Equity at exit
- $11,168
- IRR
- 20.1%
- Equity multiple
- 2.69×
- Total profit
- $35,521
- Equity at exit
- $6,476
Cash invested: $20,972 (down + closing). Projections, not guarantees.
Landlord ↔ Tenant lean methodology
- Overall (STATE)
- 87 Strongly Landlord-Friendly
- State Texas
- 87 Strongly Landlord-Friendly · R+5
- County
- — inherits STATE
- City
- — inherits STATE
ZIP-level market 77705
- Home prices YoY
- -29.7%
- Active inventory
- 206
- Price-to-rent
- 5.6×
Monthly cashflow live
- Estimated rent
- $1,110 high interval (Pro) →
- Mortgage (P&I)
- −$393
- Tax from tax record
- −$119 /mo · $1,427/yr
- Insurance
- −$31
- HOA
- −$0
- Vacancy / Maint / Mgmt
- −$233
- Net cashflow
- $334
Break-even live
Sensitivity live
| Price | -10% $377 | -5% $355 | +0% $334 | +5% $313 | +10% $292 |
|---|---|---|---|---|---|
| Rent | -10% $246 | -5% $290 | +0% $334 | +5% $378 | +10% $422 |
| Rate | -1.0pp $372 | -0.5pp $353 | base $334 | +0.5pp $315 | +1.0pp $295 |
UW: 25.0% down · 7.5% · 30yr · 1.5% tax · 5.0% vac · 8.0% maint · 8.0% mgmt
Financing live
Cash to close
- Down payment
- $18,725
- Closing costs
- $2,247
- Reserves months
- —
- Total cash needed
- —
Loan-product check · same deal, 3 products live
Conventional
25% down · 7.5% · 30yr
- Down + closing
- —
- Monthly P&I
- —
- Monthly cashflow
- —
- DSCR
- —
- Eligible?
- —
Personal DTI + credit; lowest rate.
DSCR
20% down · 8.5% · 30yr
- Down + closing
- —
- Monthly P&I
- —
- Monthly cashflow
- —
- DSCR
- —
- Eligible?
- —
No personal income docs; deal must DSCR.
Hard money
10% down · 12.0% · 12mo
- Down + closing
- —
- Monthly P&I
- —
- Monthly cashflow
- —
- DSCR
- —
- Eligible?
- —
Short-term bridge; refi at stabilization.
Rent comps 12 comps
| Address | Beds | Baths | Sqft | Rent | $/sqft | DOM | Units | Dist |
|---|---|---|---|---|---|---|---|---|
| 4670 Maddox St Beaumont, TX | 3.0 | 1.0 | 1187 | $1,195 | $1.01 | 45d | 1 | 0.41mi |
| 365 E Irby St Beaumont, TX | 3.0 | 2.0 | 1281 | $1,495 | $1.17 | 25d | 1 | 0.72mi |
| 677 E Caston St Beaumont, TX | 2.0 | 1.0 | 1070 | $795 | $0.74 | 45d | 1 | 0.72mi |
| 4120 Brandon St Beaumont, TX | 2.0 | 1.0 | 810 | $997 | $1.23 | 25d | 1 | 0.77mi |
| 4030 Howard St Beaumont, TX | 2.0 | 1.0 | 1008 | $795 | $0.79 | 45d | 1 | 0.85mi |
| 4285 Chaison St Beaumont, TX | 2.0 | 1.0 | 904 | $850 | $0.94 | 45d | 1 | 0.86mi |
| 4020 Howard St Beaumont, TX | 3.0 | 2.0 | 1300 | $975 | $0.75 | 45d | 1 | 0.86mi |
| 690 Adams St Unit 206 Beaumont, TX | 2.0 | 1.0 | 878 | $795 | $0.91 | 15d | 1 | 0.99mi |
| 655 Adams St Unit 1 Beaumont, TX | 2.0 | 1.0 | 965 | $750 | $0.78 | 15d | 1 | 1.01mi |
| 315 E Pipkin St Beaumont, TX | 2.0 | 1.0 | 952 | $1,000 | $1.05 | 15d | 1 | 1.03mi |
| 1417 Church St Beaumont, TX | 2.0 | 1.0 | 1440 | $1,100 | $0.76 | 15d | 1 | 1.27mi |
| 614 Euclid St Beaumont, TX | 4.0 | 2.0 | 1378 | $1,395 | $1.01 | 25d | 1 | 1.48mi |
Listing history 17 events
-
2026-06-15days on market $74,900 Active 43 DOM
-
2026-06-14days on market $74,900 Active 41 DOM
-
2026-06-13days on market $74,900 Active 40 DOM
-
2026-06-10days on market $74,900 Active 38 DOM
-
2026-06-09days on market $74,900 Active 37 DOM
-
2026-06-08days on market $74,900 Active 36 DOM
-
2026-06-07days on market $74,900 Active 35 DOM
-
2026-06-03days on market $74,900 Active 31 DOM
-
2026-06-02days on market $74,900 Active 30 DOM
-
2026-06-01days on market $74,900 Active 29 DOM
-
2026-05-31days on market $74,900 Active 28 DOM
-
2026-05-30days on market $74,900 Active 27 DOM
-
2026-05-03$74,900 Active 494-char remark
-
2026-05-02price $74,900 458-char remark
-
2026-03-18$79,900 Active 458-char remark
-
2015-11-13soldstatus
-
2009-07-14soldstatus
ⓘ Source: listings_history table (triggers on properties + properties_extension) + one-shot
backfill from property_details.listing_events for pre-trigger history.
Tax reassessment forecast TX · Resets to sale price
- Current annual tax
- $1,427 · $119/mo
- Projected year-2 tax
- $1,427 · $119/mo
- Expected delta
- $0/yr ($0/mo · 0.0%)
ⓘ Screening estimate from a state-policy table — verify with the county assessor before closing.
Climate risk First Street
- Flood 1/10 Low FEMA zone X · 0% chance over 30 yrs
- Wildfire 2/10 Low
- Heat 9/10 Extreme 7 d/yr ≥109°F today · 24 d/yr by 30 yrs out
- Wind 9/10 Extreme 99% chance of damaging wind over 30 yrs
- Air quality 2/10 Low 1 unhealthy d/yr today · 1 by 30 yrs out
Nearby sold comps map
Loading sold comps map…
Walkable amenities ~0.75 mi
Loading nearby amenities…
Taxation est. · year 1
- Rental income
- $13,322
- − Mortgage interest
- −$4,196
- − Property taxes
- −$1,427
- − Insurance
- −$374
- − Repairs & maintenance
- −$1,066
- − Management
- −$1,066
- − Depreciation
- −$2,179
- Taxable income
- $3,014
- Est. tax owed @ 24.0%
- −$723
- After-tax cash flow
- $3,286/yr
For passive investors: Depreciation is non-cash, so a rental often shows a tax loss while cash-flowing — sheltering income. Rental losses are passive: they offset passive income freely, and up to $25,000/yr can offset ordinary (W-2) income if you actively participate and your MAGI is under $100k (phasing out to $0 by $150k); unused losses carry forward. On sale, claimed depreciation is recaptured at up to 25%, and gains may owe capital-gains tax (a 1031 exchange can defer both). Figures are a year-1 estimate at your 24.0% rate — not tax advice; consult a CPA.
Schools (NCES district)
- District
- Beaumont ISD
- NCES district ID
- 4809670
- Math proficiency
- 14% ▼ -13.00%
- Reading proficiency
- 22% ▼ -7.00%
- Median HH income
- $41,683
- Composite
- 15.43/100
- National rank
- #9316
- State rank
- #789 of 826 in TX
Livability — Beaumont
- Score
- 64/100
- State rank
- #739
- US rank
- #13710
Category grades
Schools grade is shown separately in the Schools card above.
Census & demographics
- Census place
- Beaumont, TX
- County
- Jefferson County · 203,592 people
- City population
- 125,901
- Metro
- Beaumont-Port Arthur, TX
- Population (ZIP)
- 38,259
- Household income
- $54,633
- Rent vs Own
- Severe rent burden
- 776.0
Population outlook (Jefferson County) Hauer SSP2
- Today (2025)
- 259,015 people
- By 2030
- 260,685 · +0.6%
- By 2040
- 263,309 · +1.7%
- By 2050
- 265,237 · +2.4%
- By 2075
- 270,193 · +4.3%
- By 2100
- 255,628 · -1.3%
Race, ethnicity, and origin ACS 2023
- Neighborhood character
- Diverse neighborhood (Simpson 0.66)
- Race & ethnicity
- Black 46% White 29% Hispanic / Latino 21% Two or more races 6% Asian 2%
- Hispanic origin (detail)
- Mexican 13%
- Common ancestry
- Lithuanian 5% Italian 1%
- Foreign-born
- 8% · Canada, Vietnam
- Languages at home
- 80% English-only · Spanish 18% Other Indo-European 1%
Political lean MEDSL · Jefferson
- 2024 margin
- Lean R (+8.9) · D 45.1% · R 54.0%
- 2008→2024 swing
- -11.1pp toward R · 2008: 2.2pp · 2024: -8.9pp
- All cycles
- 2024: R+8.9 2020: R+1.6 2016: R+0.5 2012: D+1.6 2008: D+2.2
Not yet ingested
- Civics
- —
Market trends
- HPI YoY
- ▼ -54.76%
- Current HPI
- 129.3696
- Rent YoY
- —
- Metro
- Beaumont-Port Arthur, TX
- State GDP YoY
- ▲ 3.95%
- F500 in state
- 110
Industry mix (Fortune 500 HQ in TX)
| Industry | F500 HQs | Revenue |
|---|---|---|
| Energy | 16 | $1,198B |
|
||
| Technology | 5 | $198B |
|
||
| Engineering / Construction | 4 | $72B |
|
||
| Energy Services | 3 | $60B |
|
||
| Utilities | 3 | $41B |
|
||
| Healthcare | 2 | $330B |
|
||
Price history
+0.0% since first listed5 events — show timeline
- 2026-06-16 Listing Removed — HARMLS
- 2026-05-03 Listed $74,900 HARMLS
- 2026-05-02 Price Changed $74,900 BBOR
- 2015-11-13 Sold (Public Records) — Public Records
- 2009-07-14 Sold (Public Records) — Public Records
Property tax history
+5.6%/yrLatest (2025): $1,427 · +13.9% YoY. Source: county tax records.
Cash-flow waterfall
monthlySold comps — $/sqft
last 12 mo · ≤1 miLoading sold comps…